Traefik3
Traefik v2.0 dashboard Prometheus Stack
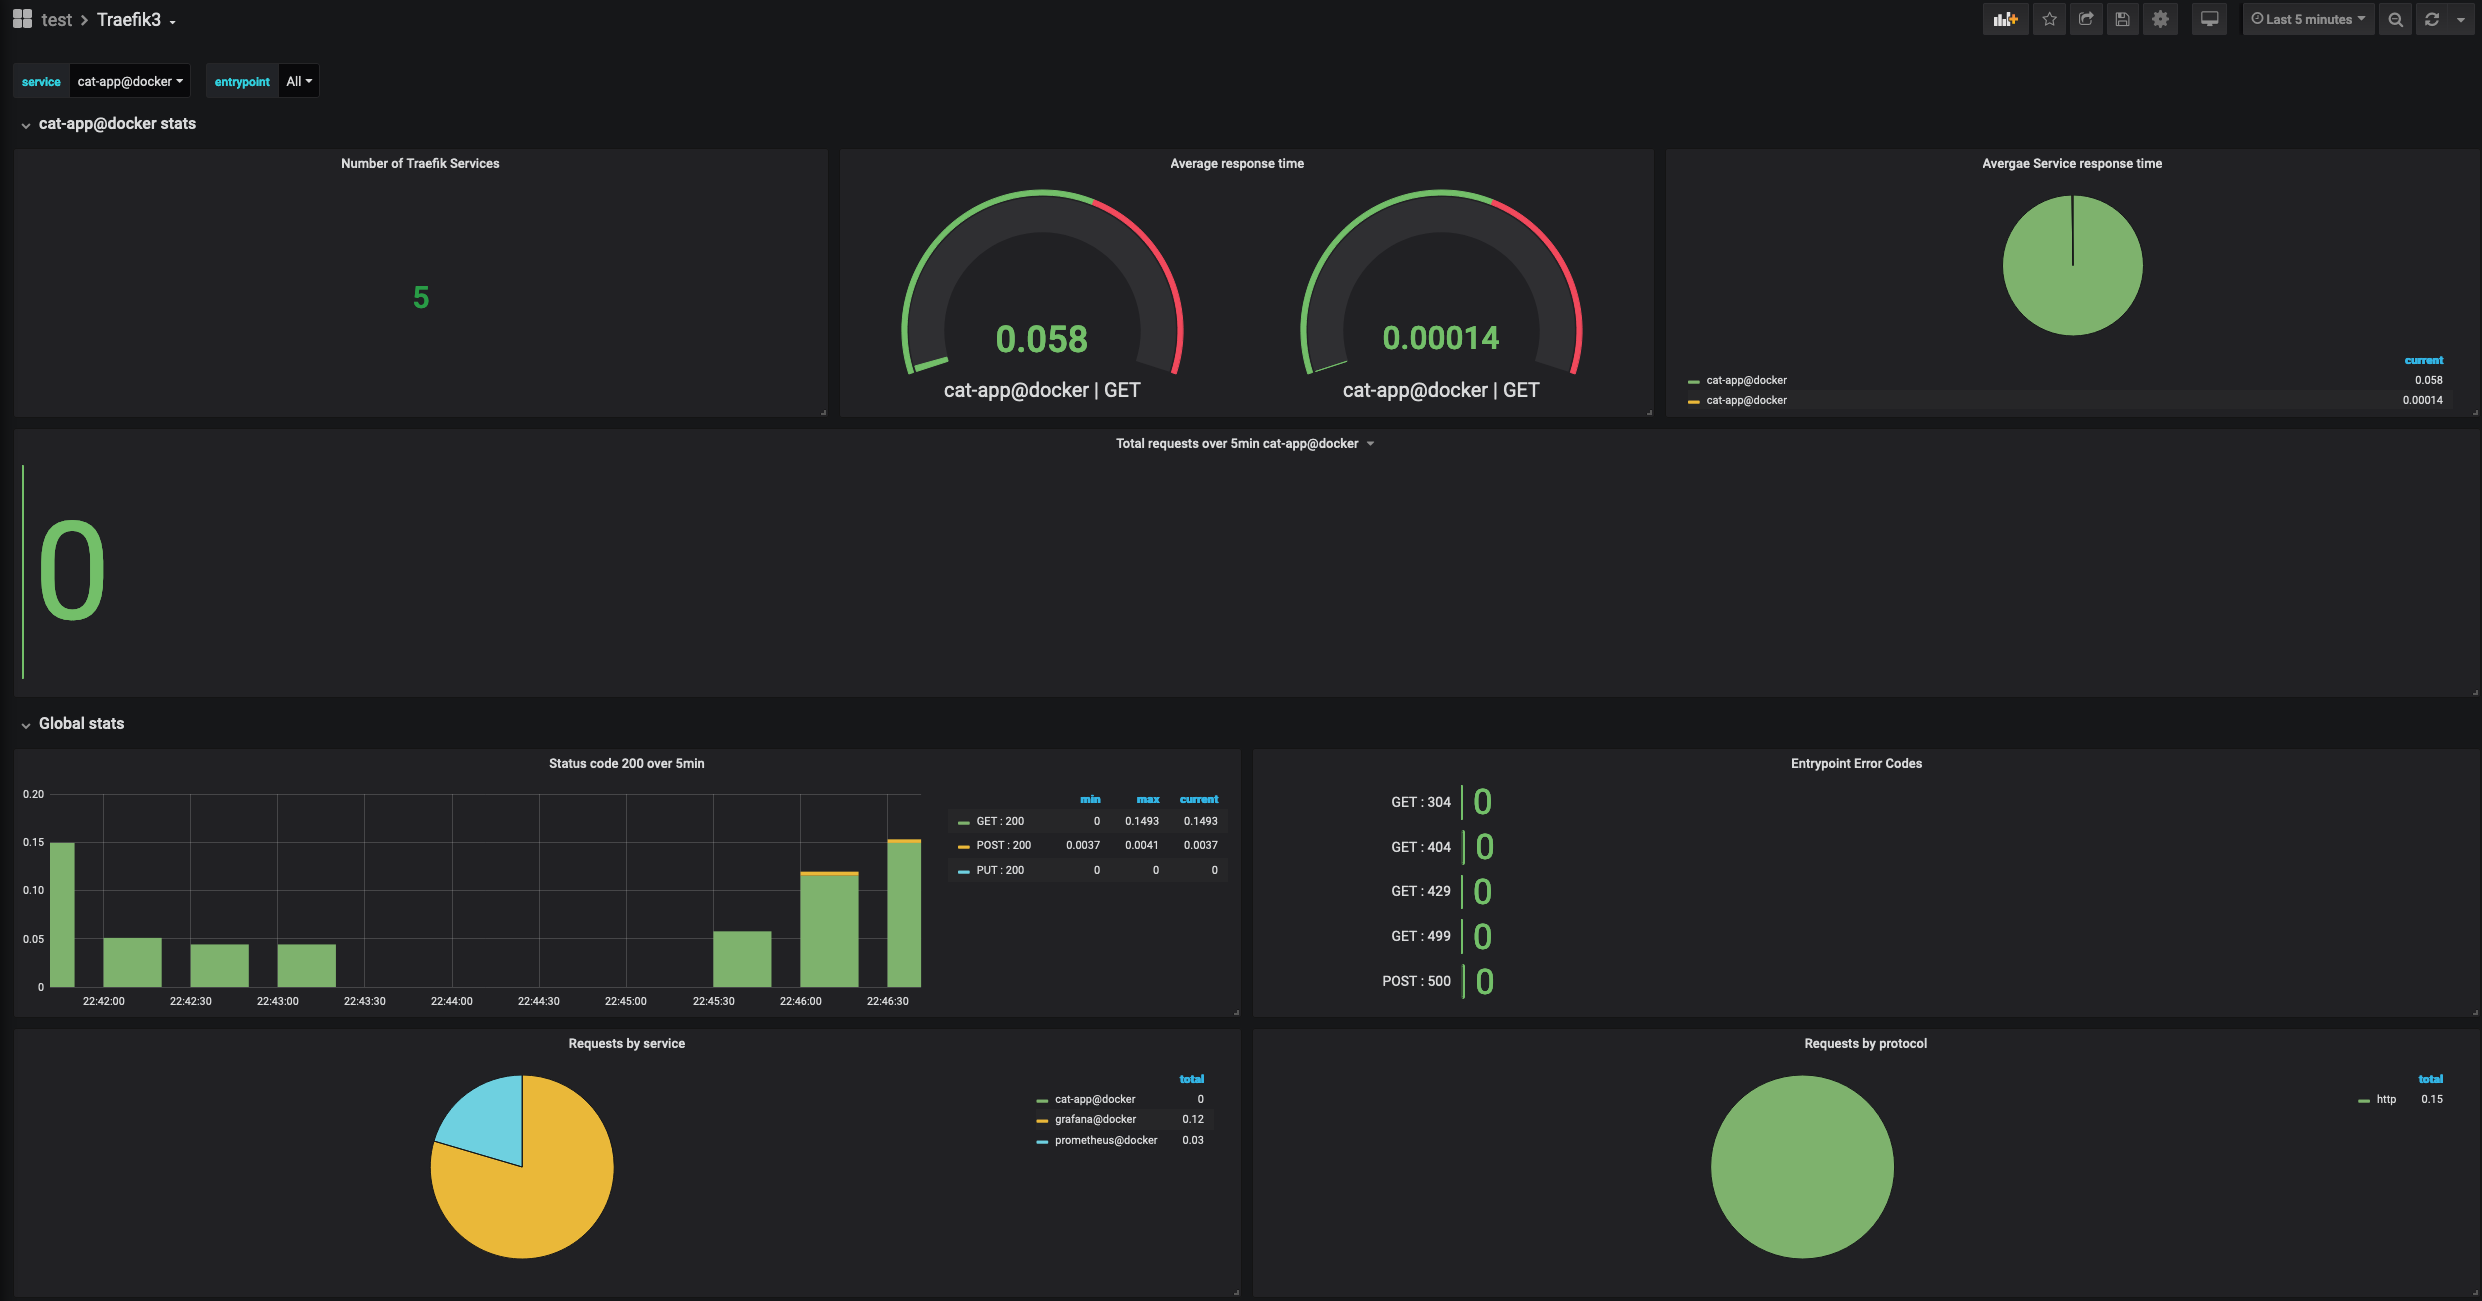
This Dashboard visualizes the metrics consumed from the Traefik Reverse Proxy/Loadbalancer. The metrics are consumed by Prometheus and displayed by Grafana.
Data source config
Collector type:
Collector plugins:
Collector config:
Revisions
Upload an updated version of an exported dashboard.json file from Grafana
| Revision | Description | Created | |
|---|---|---|---|
| Download |