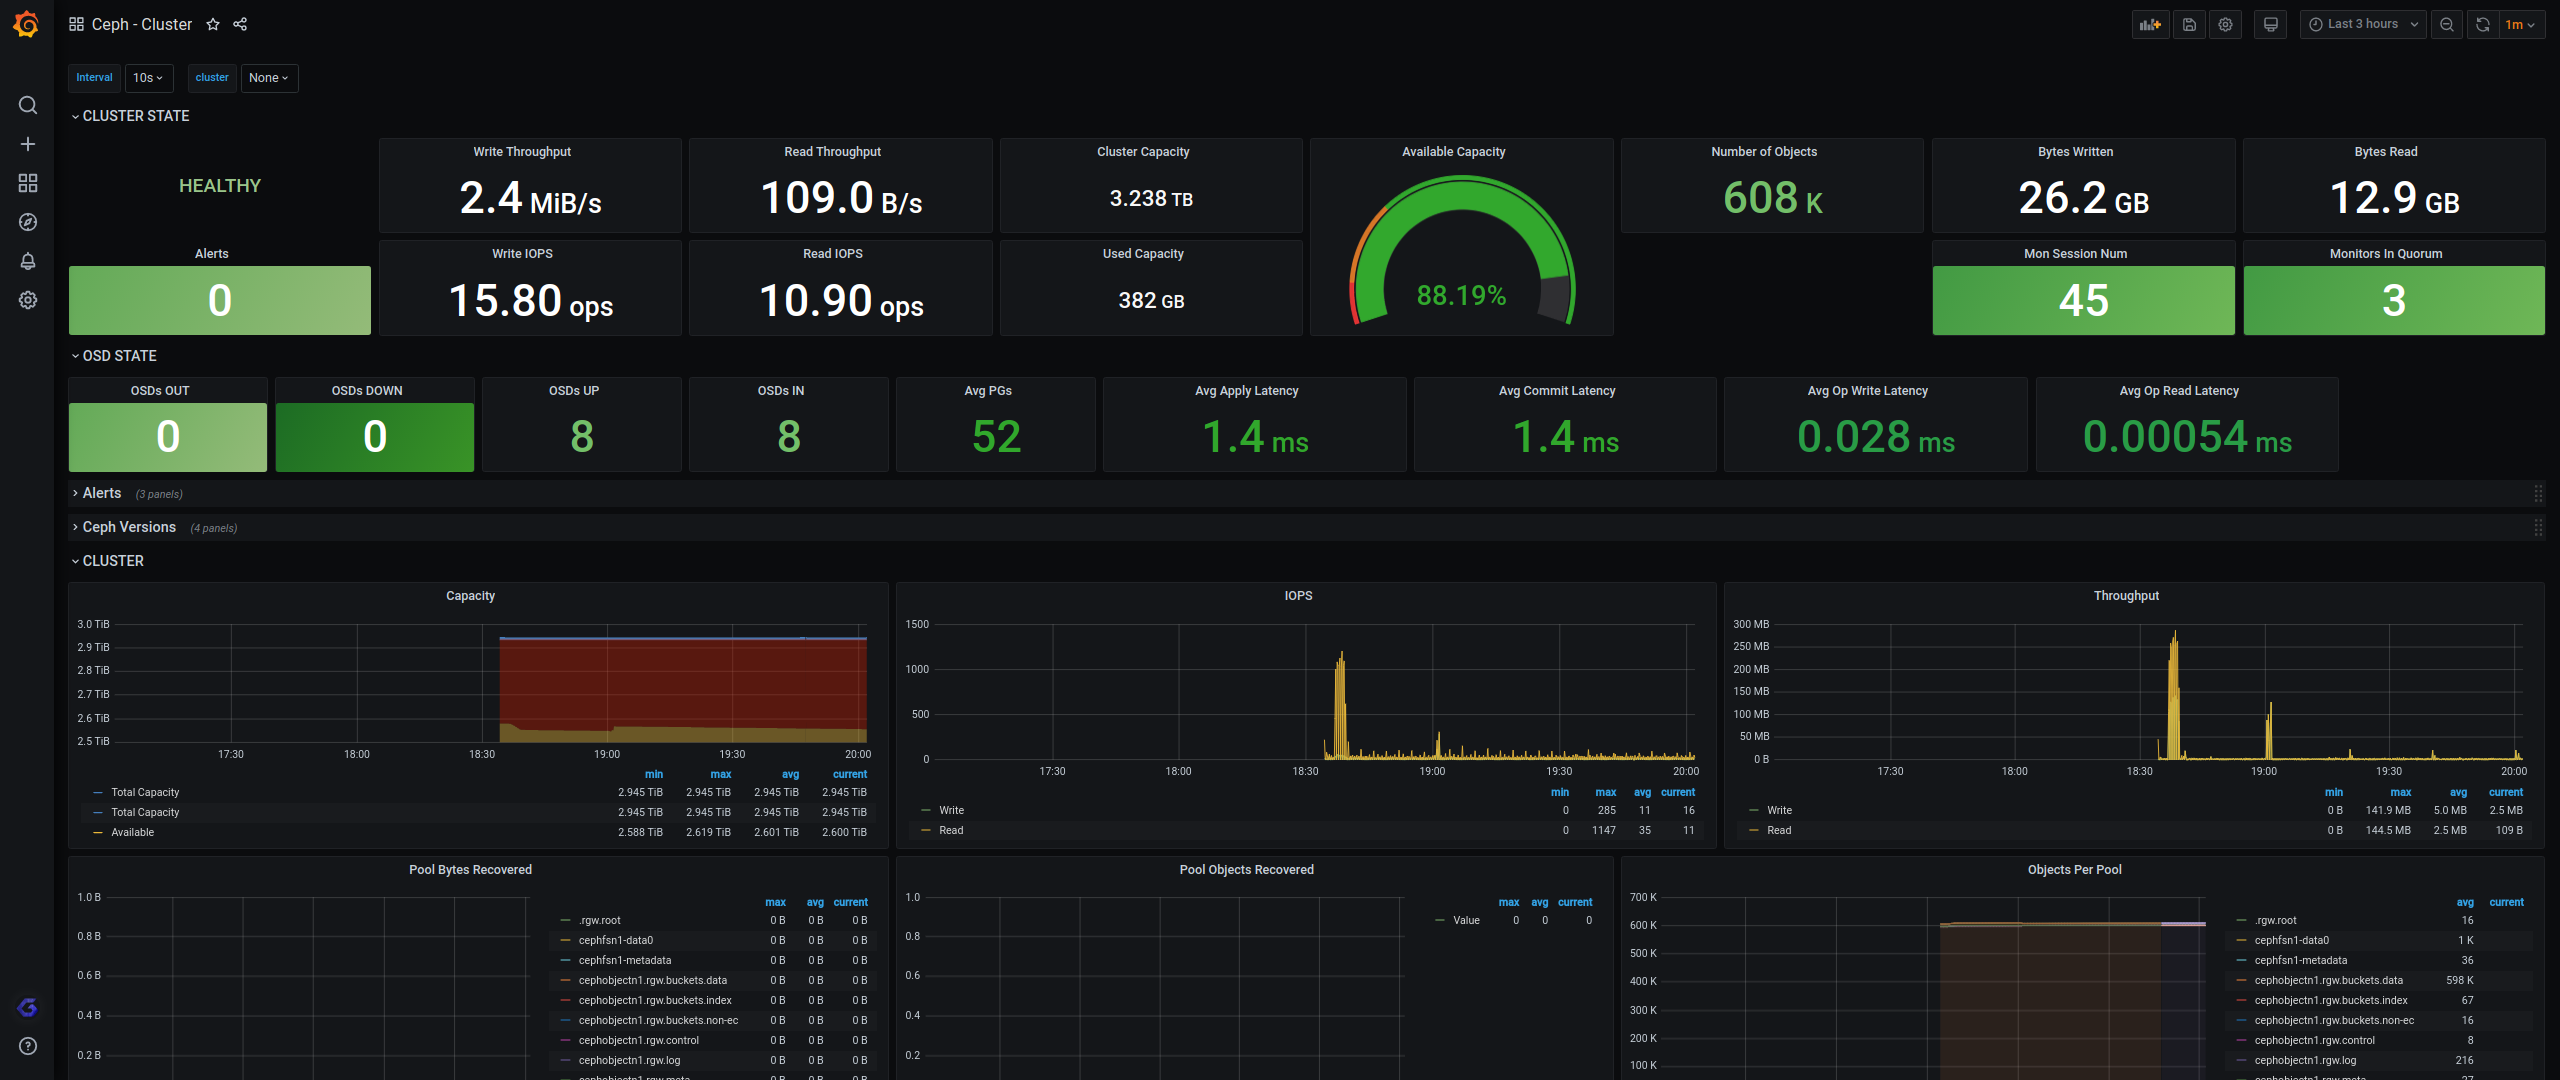
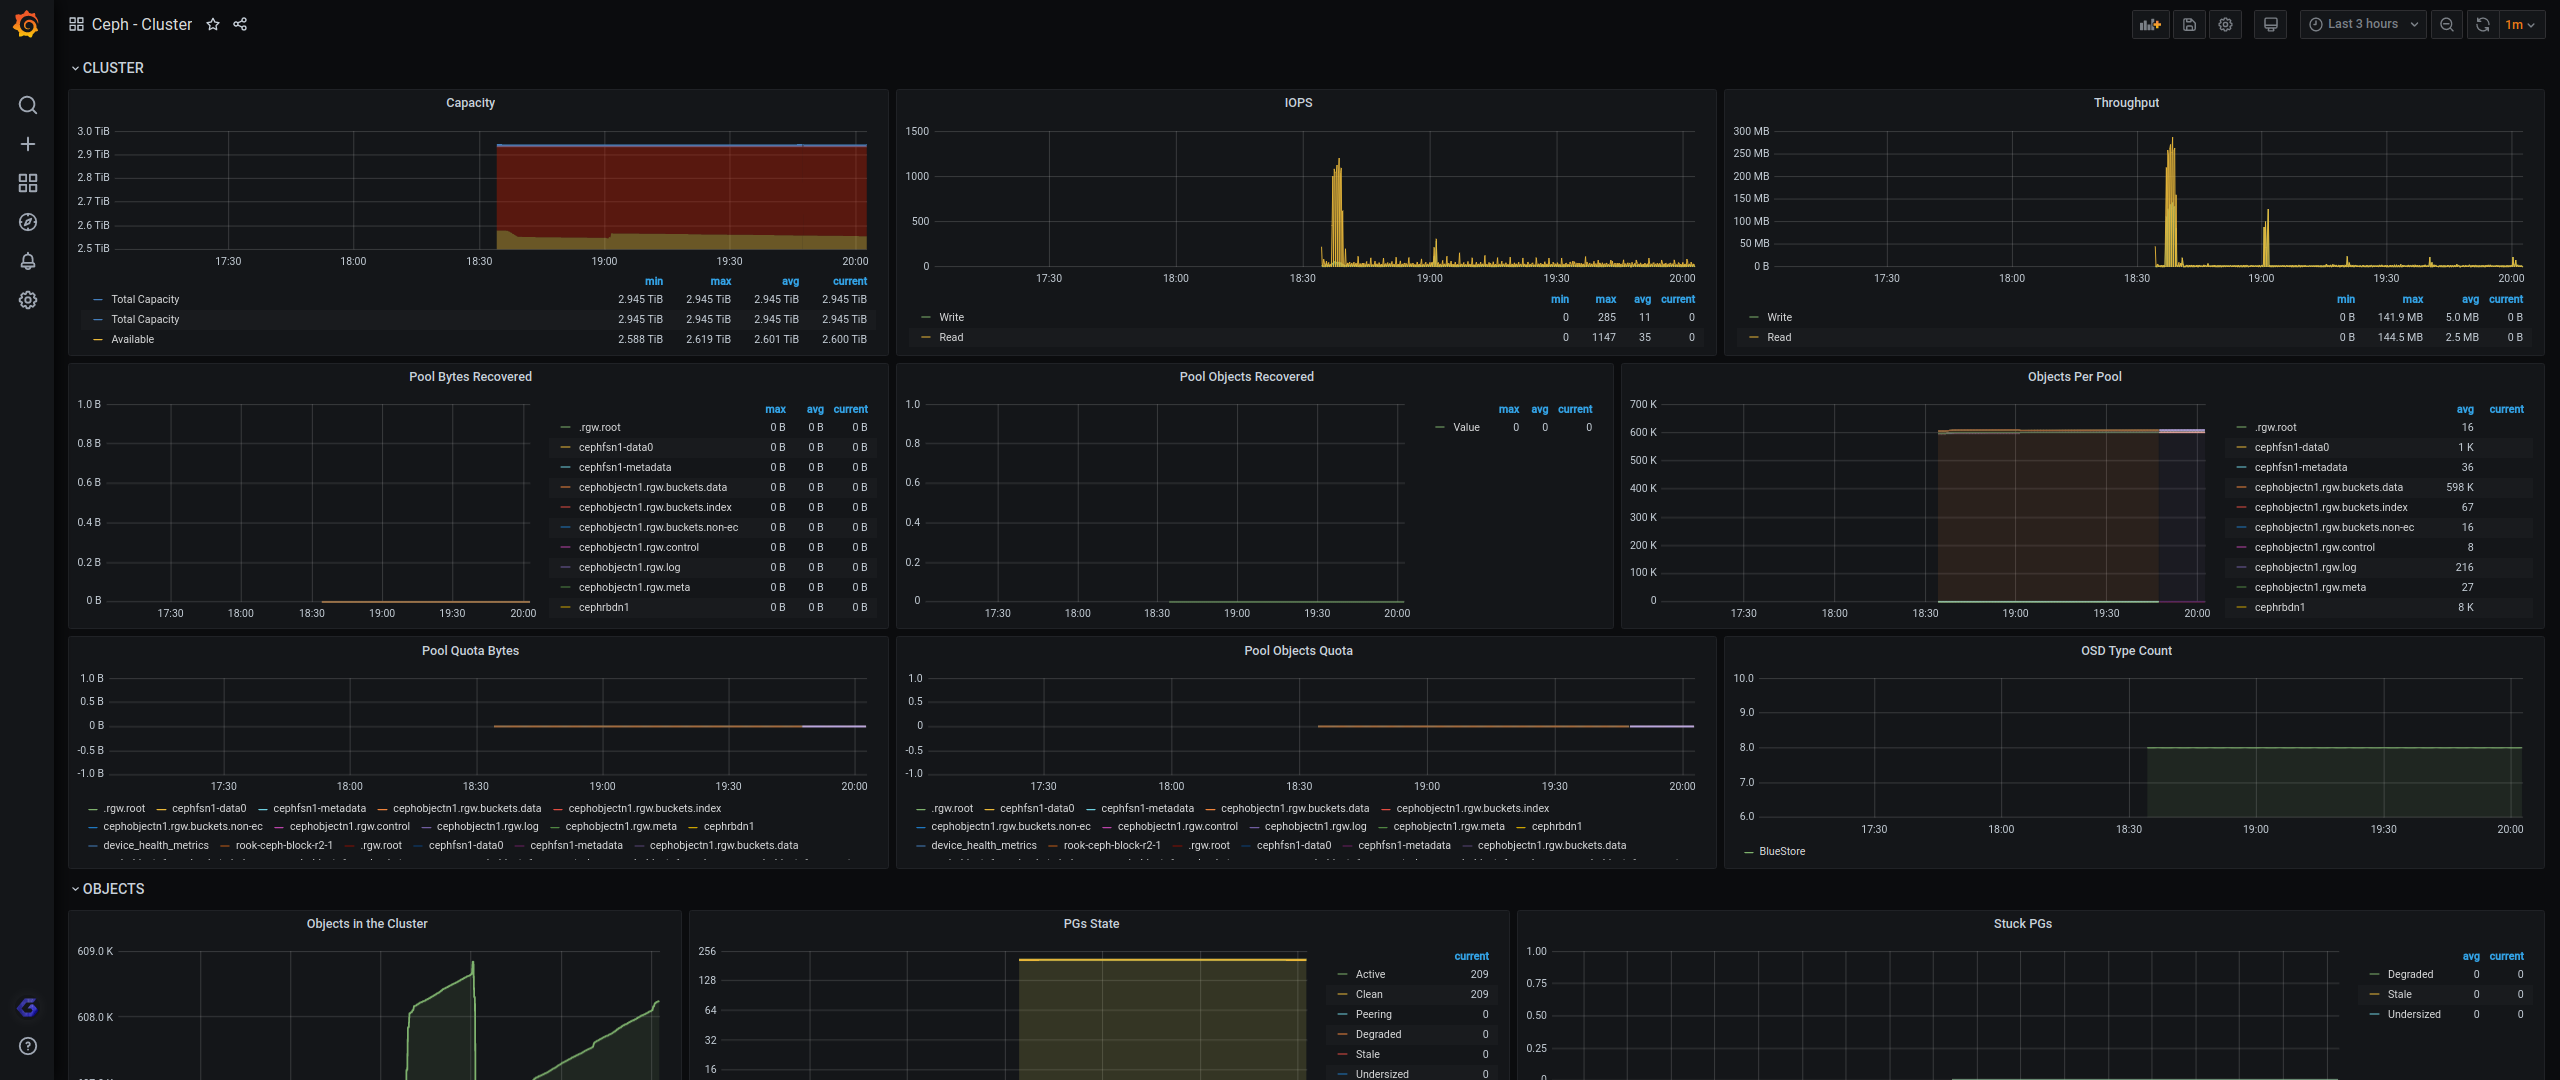
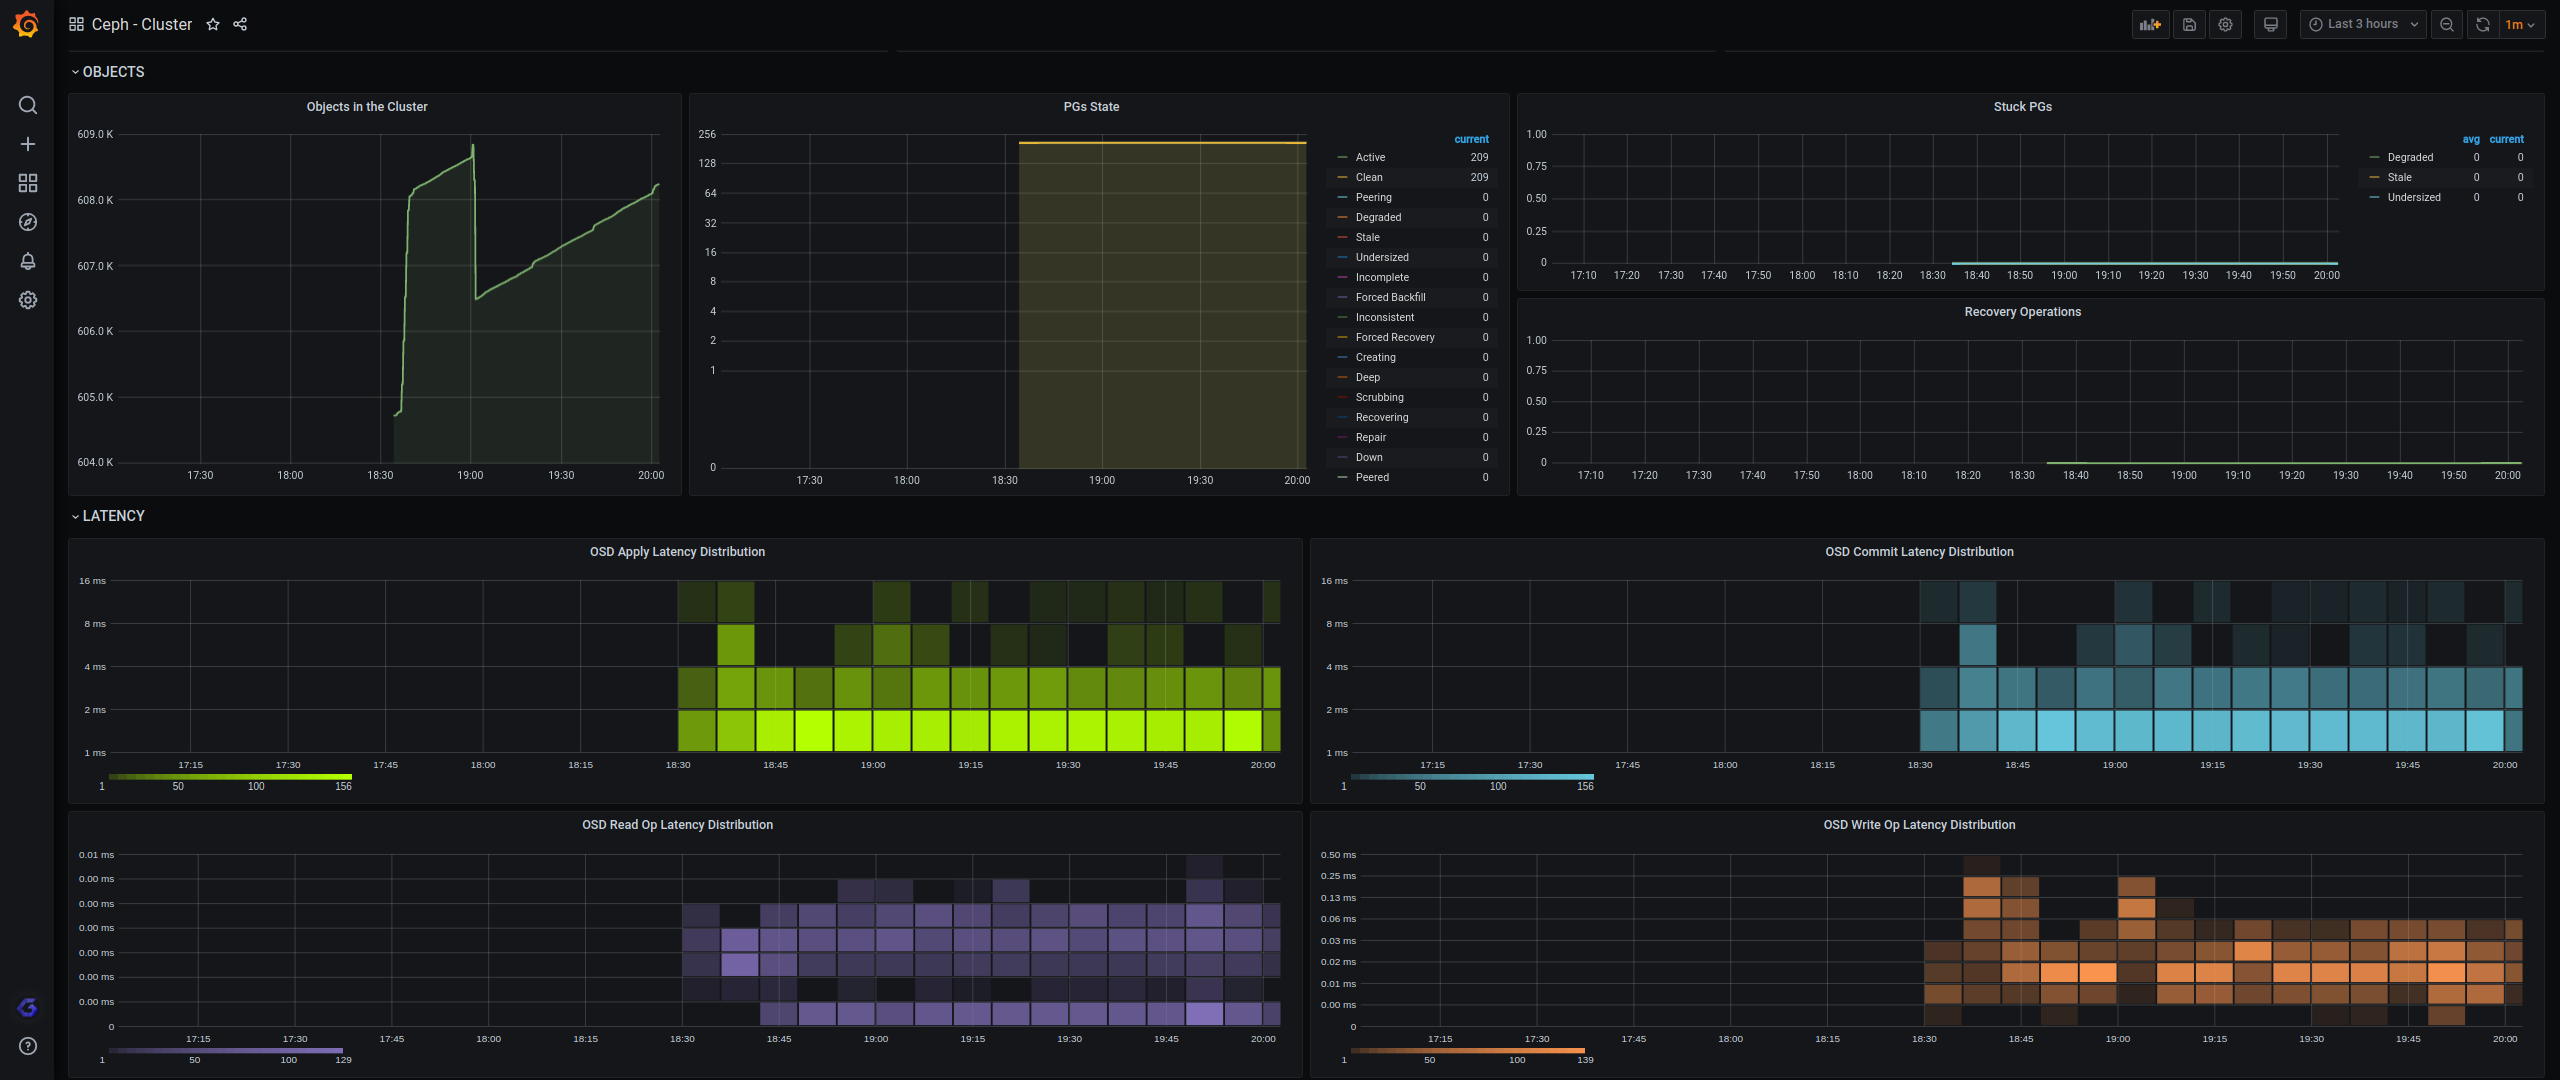
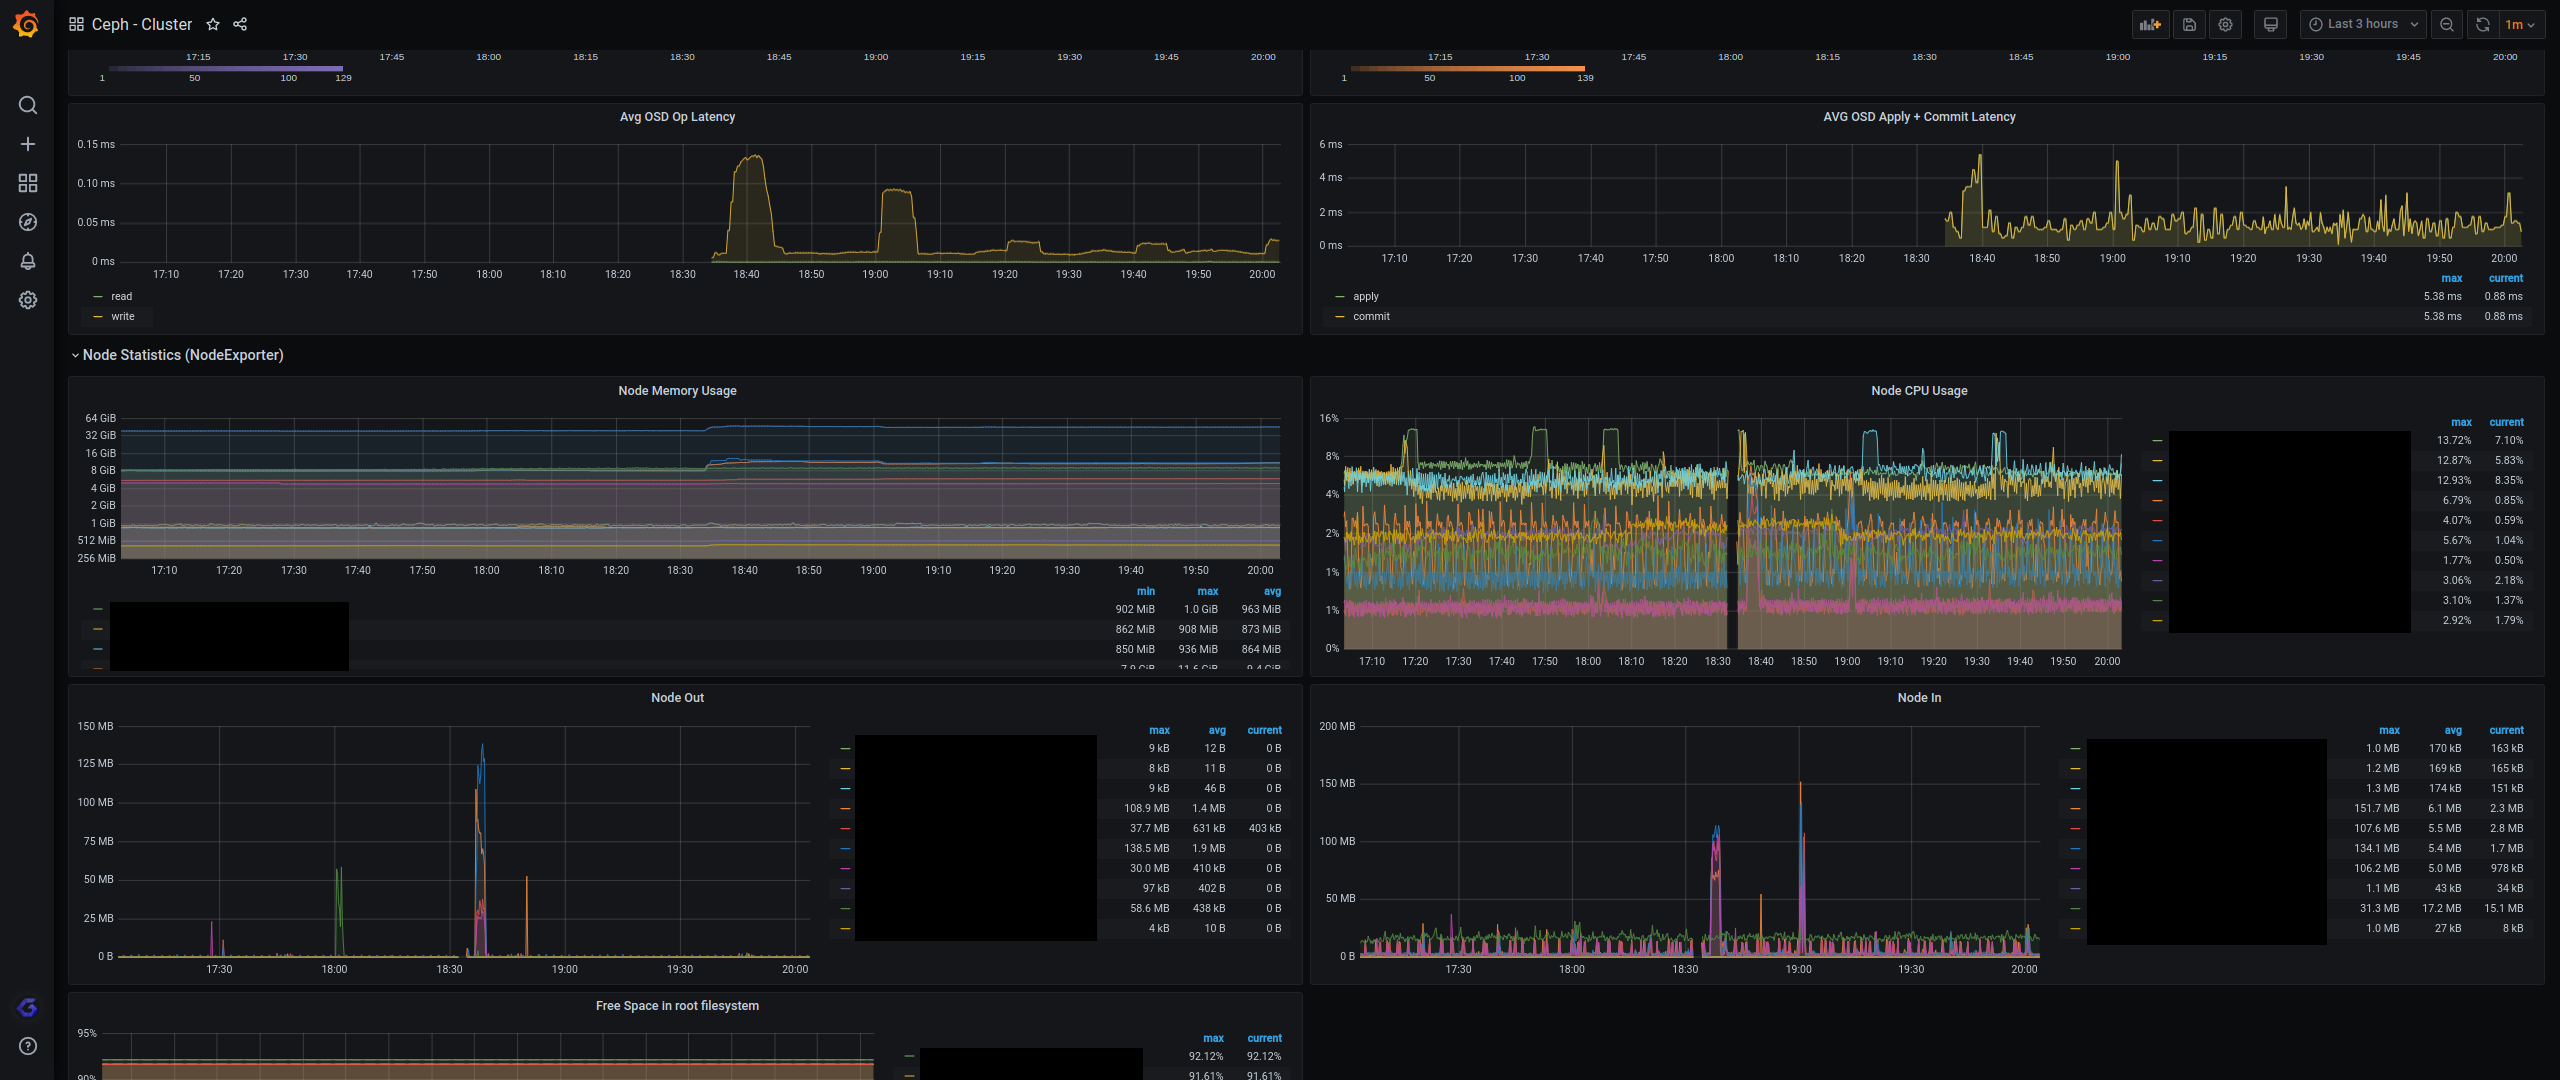
Ceph Cluster
Overview of your Ceph cluster.
Requirements
It is compatible with a Rook Ceph cluster and possibly also most Ceph Cluster with the Ceph MGR Prometheus module enabled.
The Prometheus datasource needs to scrape the Ceph MGR(s) Prometheus Metrics Endpoints. More info on the Ceph MGR Prometheus Module can be found here: http://docs.ceph.com/docs/master/mgr/prometheus/
Credits
It is now based on the official Ceph monitoring-mixins dashboard that has been updated by my colleague Javier Lopez to use the latest Grafana time series panels, see https://github.com/ceph/ceph/pull/51340.
This dashboard was originally based on https://grafana.com/grafana/dashboards/7056 by robvalca since October 2020.
Data source config
Collector config:
Upload an updated version of an exported dashboard.json file from Grafana
| Revision | Description | Created | |
|---|---|---|---|
| Download |
Ceph
Monitor Ceph with Grafana. Easily keep tabs on your cluster with Grafana Cloud's out-of-the-box monitoring solution.
Learn more


