Kubernetes Cluster Health Monitoring
A concise dashboard to monitor metrics collected by Deis Monitor.
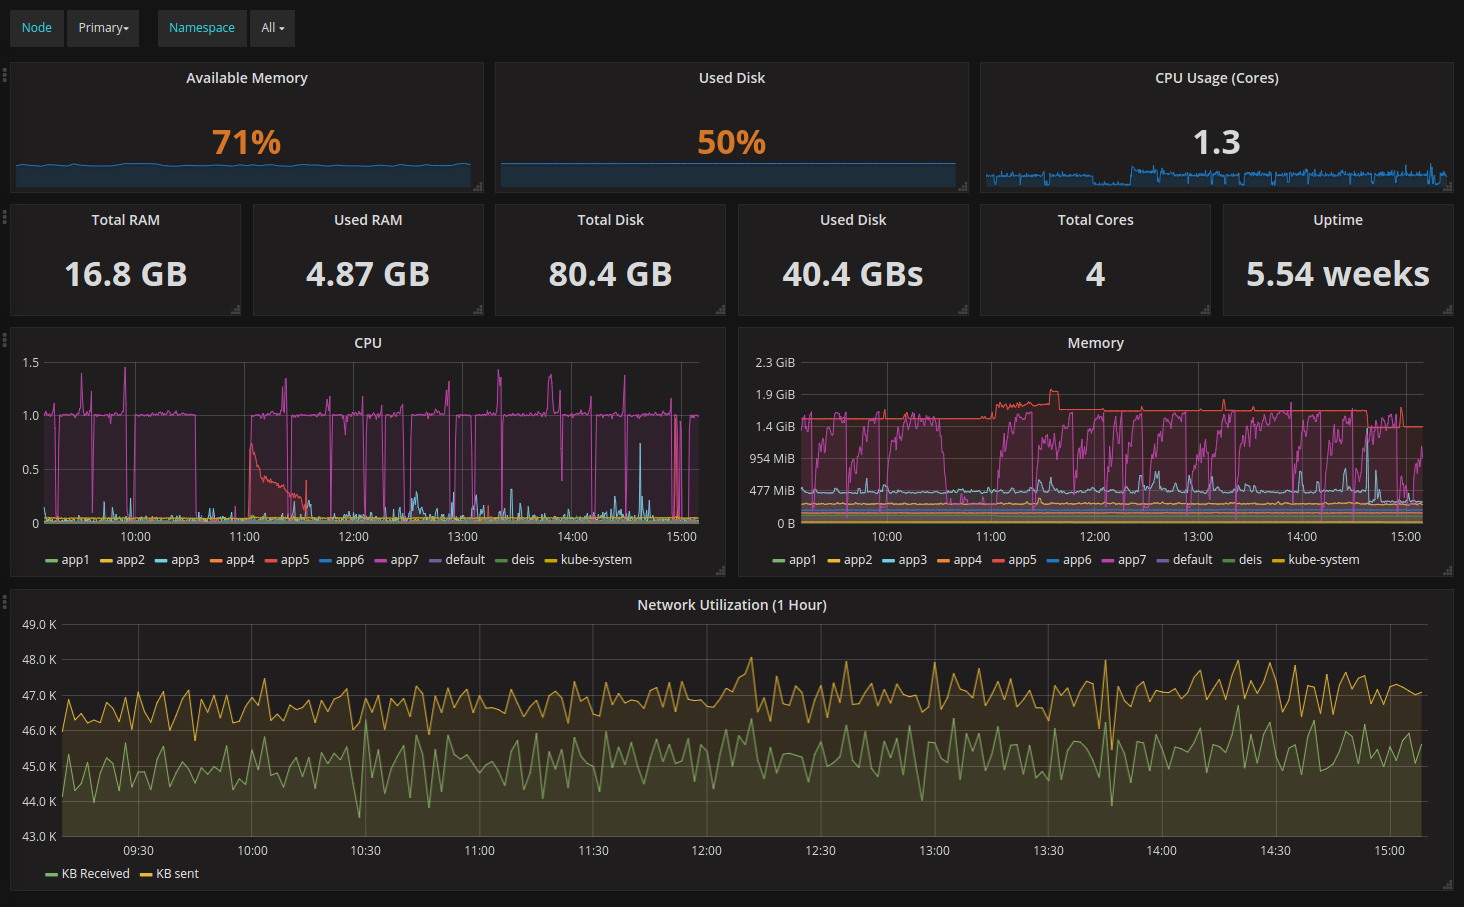
Widgets are built for RAM usage, CPU usage, disk usage and network utilization.
Includes templating to select a particular node and a particular namespace.
Data source config
Collector type:
Collector plugins:
Collector config:
Revisions
Upload an updated version of an exported dashboard.json file from Grafana
| Revision | Description | Created | |
|---|---|---|---|
| Download |
Kubernetes
Monitor your Kubernetes deployment with prebuilt visualizations that allow you to drill down from a high-level cluster overview to pod-specific details in minutes.
Learn more