AWS / CloudWatch / OpenSearch
AWS OpenSearch Service monitoring focused on a selected domain. Compact fleet overview at the top helps you pick a domain; sections below show cluster health, resources, storage, search/indexing throughput, and throttling errors for the selected domain.
AWS OpenSearch Service Monitoring Dashboard for Grafana - CloudWatch Metrics
A Grafana dashboard for monitoring AWS OpenSearch Service (formerly Amazon Elasticsearch Service) domains using native CloudWatch metrics. Track cluster health (green/yellow/red), shard states, JVM memory pressure, garbage collection, search and indexing latency, thread-pool rejections, and snapshot failures - all without installing the OpenSearch Prometheus exporter.
Why monitor AWS OpenSearch Service?
OpenSearch failure modes are predictable: a node falls behind, replicas go unassigned (yellow), then a primary fails (red, writes blocked); or JVM memory pressure stays above 92% long enough that GC eats CPU and queries time out; or the write thread pool saturates, queues fill, and indexing rejections start. Each of these has clear leading indicators in CloudWatch - this dashboard puts them all on one screen so you can act before a domain goes red.
It works equally well for OpenSearch and the legacy Elasticsearch service since both publish to the same AWS/ES namespace.
Features
- Fleet overview - domain count in the region, count of yellow domains, count of red domains, average cluster CPU, top 10 domains by storage and search rate
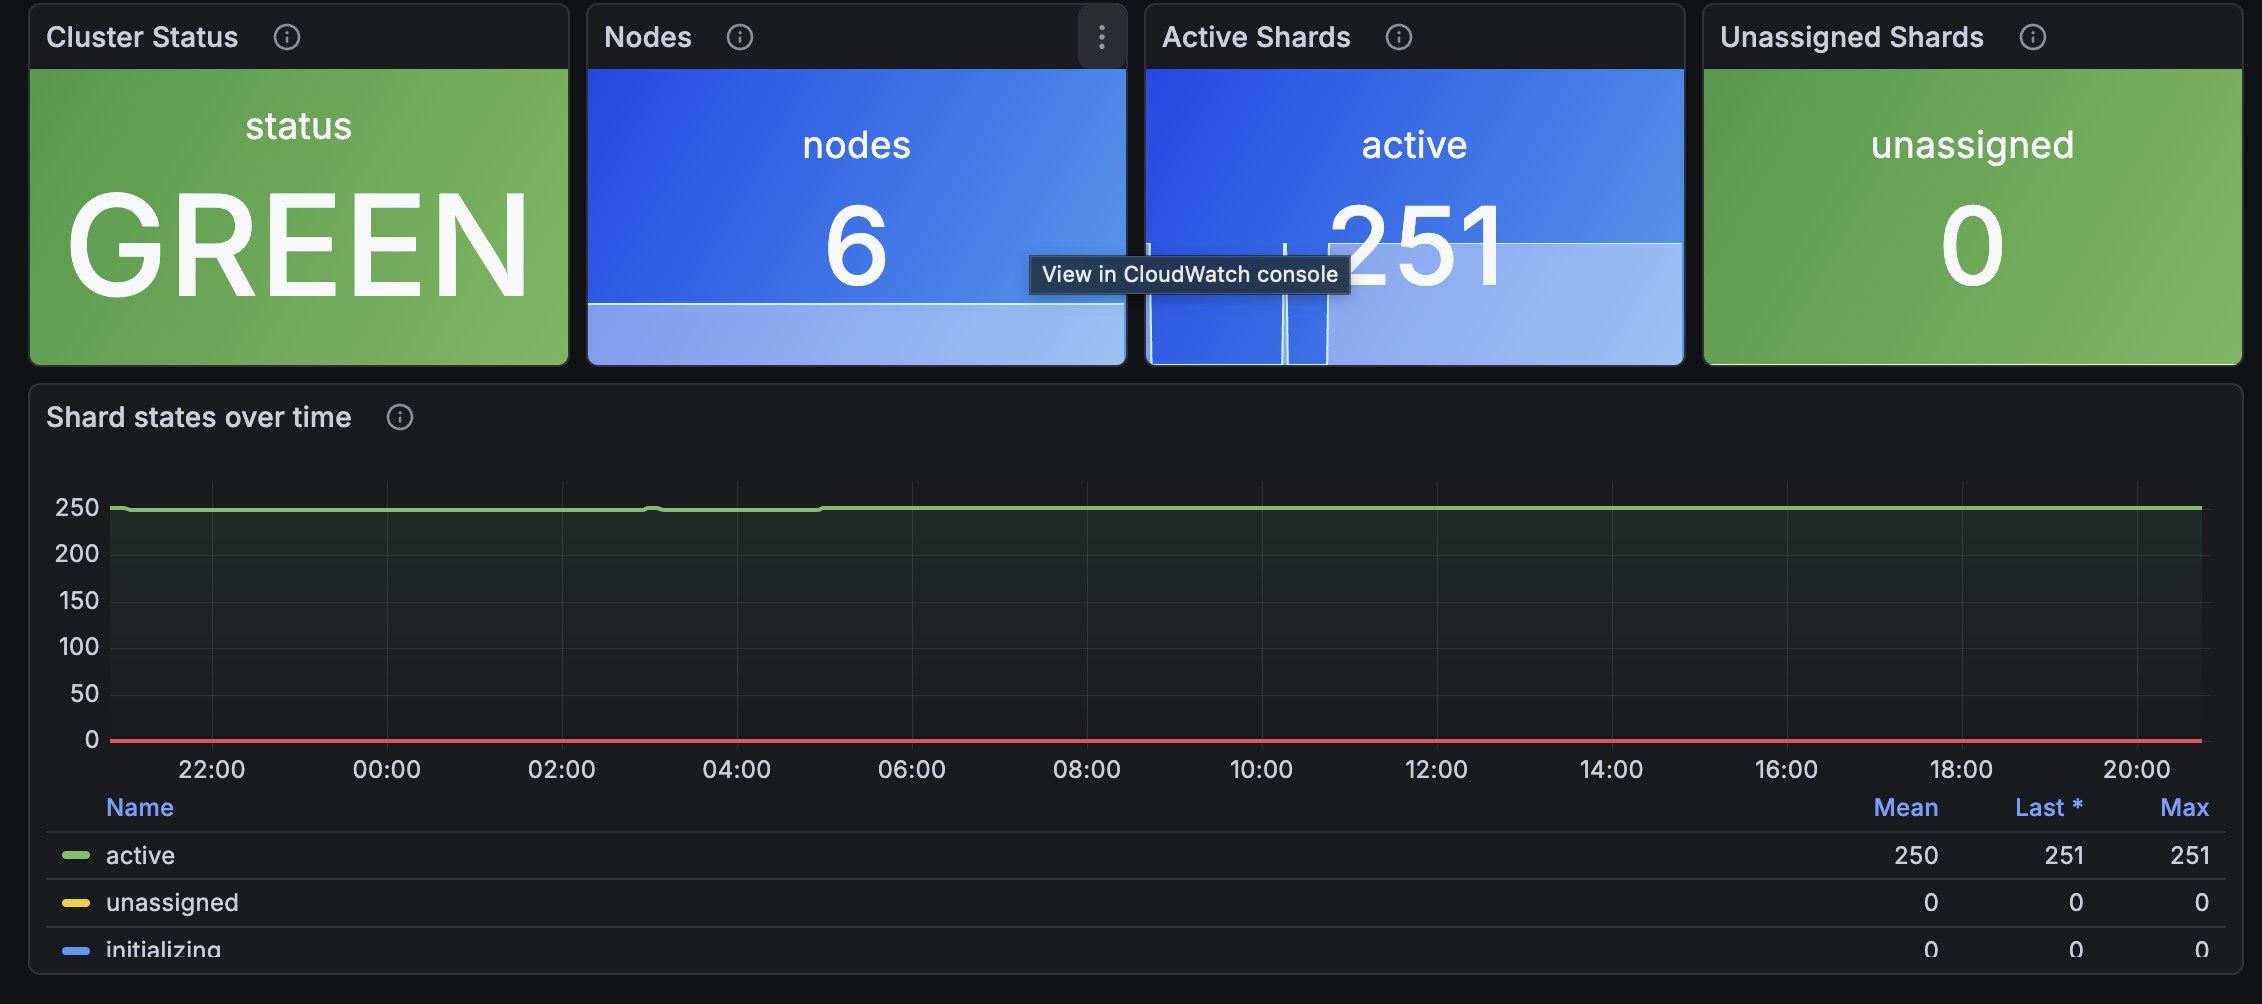
- Cluster health - current status (green/yellow/red mapped to colored label), node count, active shards, unassigned shards
- Shard states over time - active, unassigned, initializing, relocating, delayed-unassigned
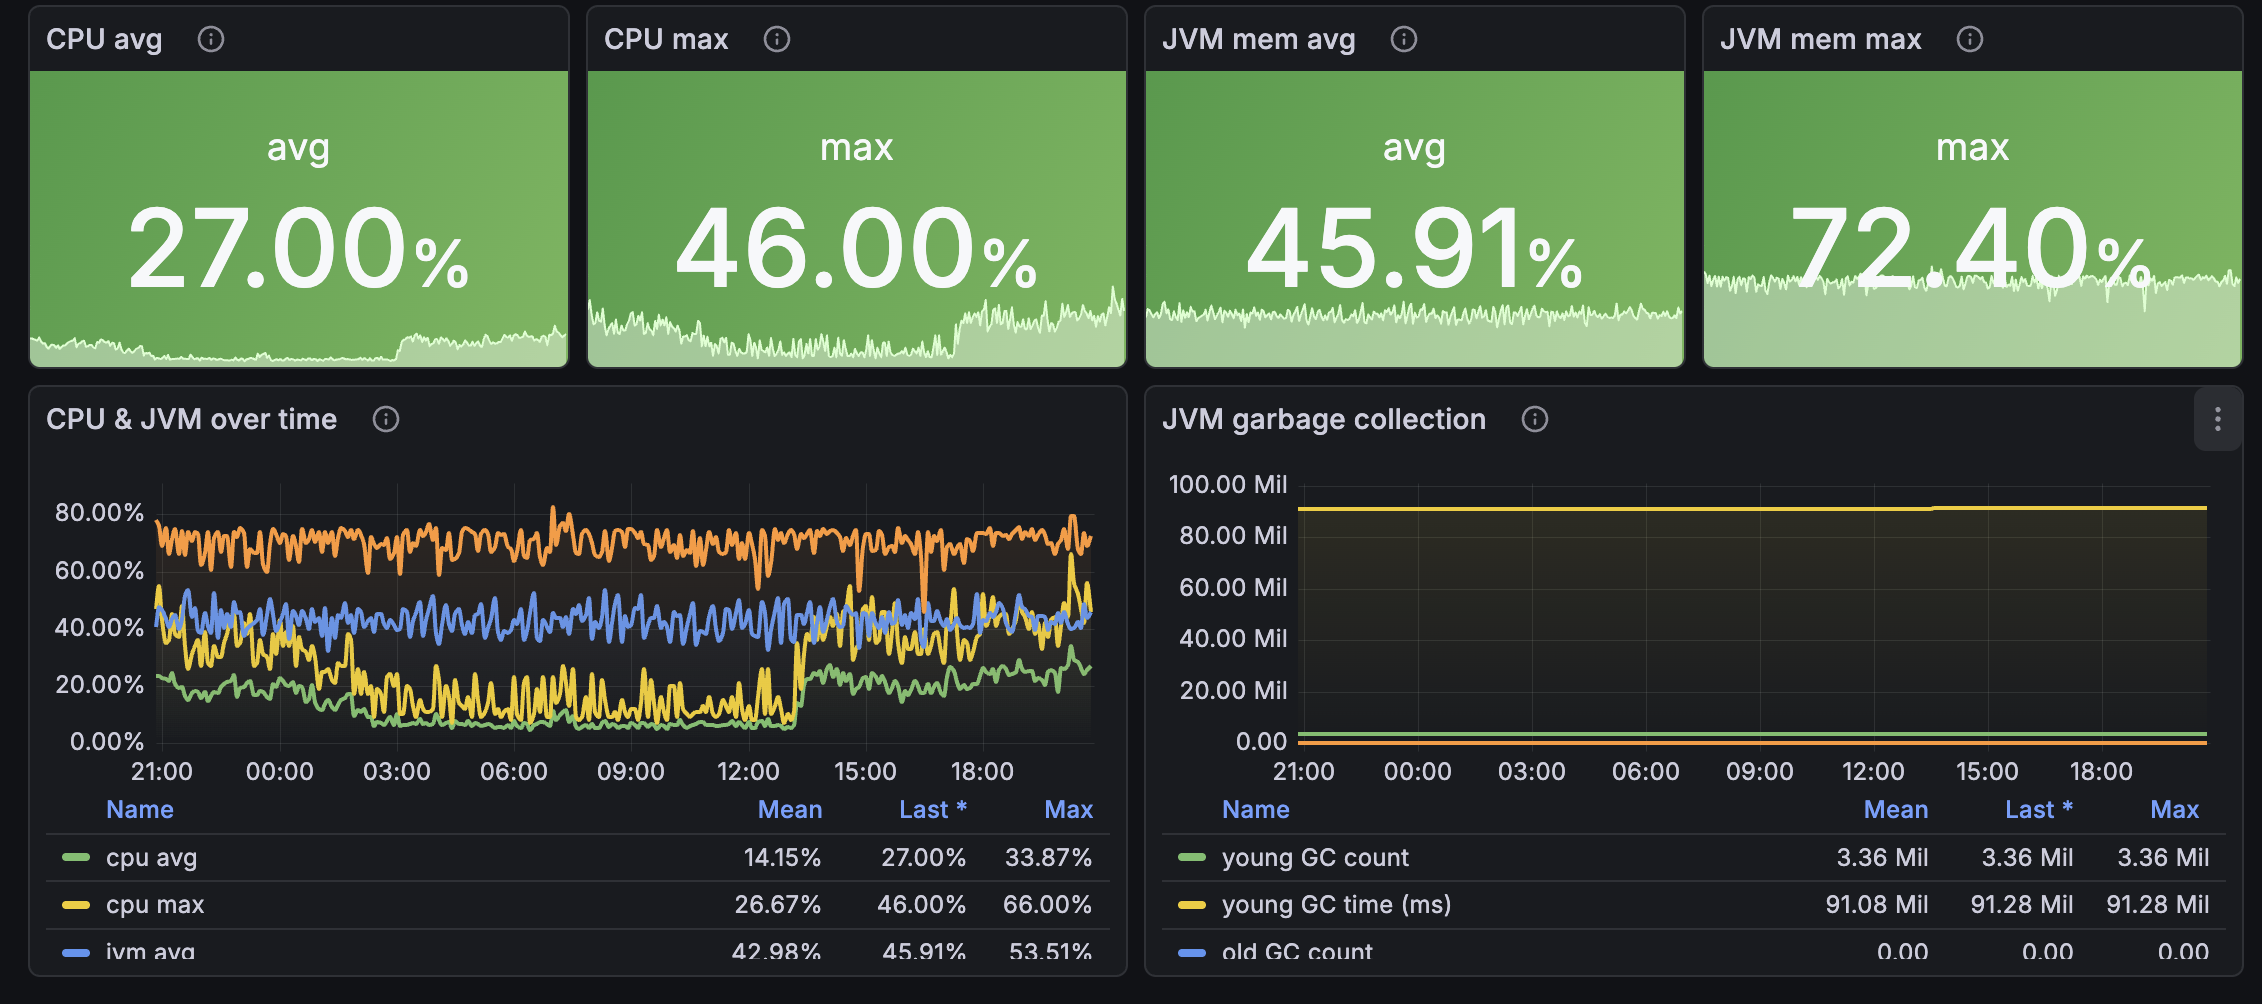
- Resources - CPU and JVM memory pressure (avg and max), JVM garbage collection counts and time (young and old gen)
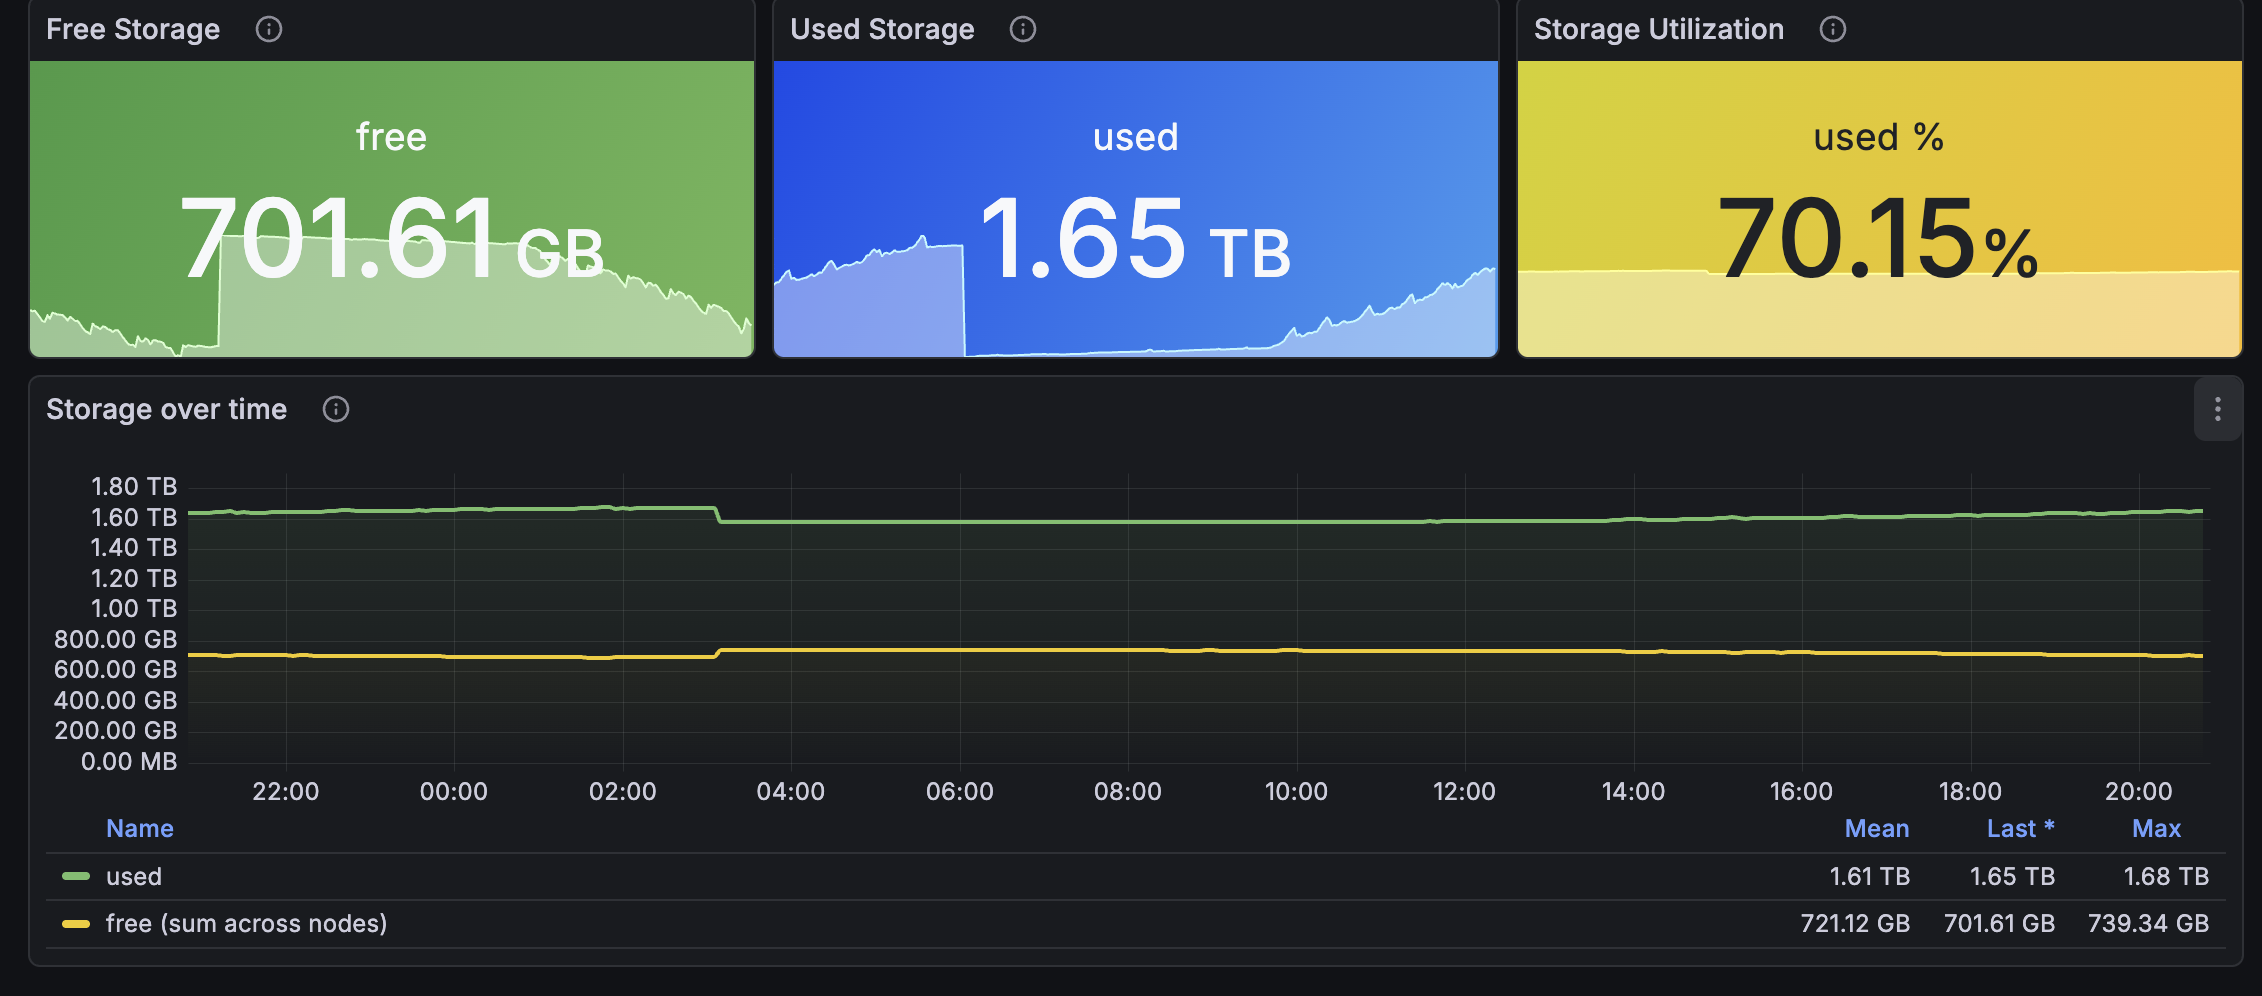
- Storage - free storage on the worst node, total cluster used space, storage utilization %, growth trends
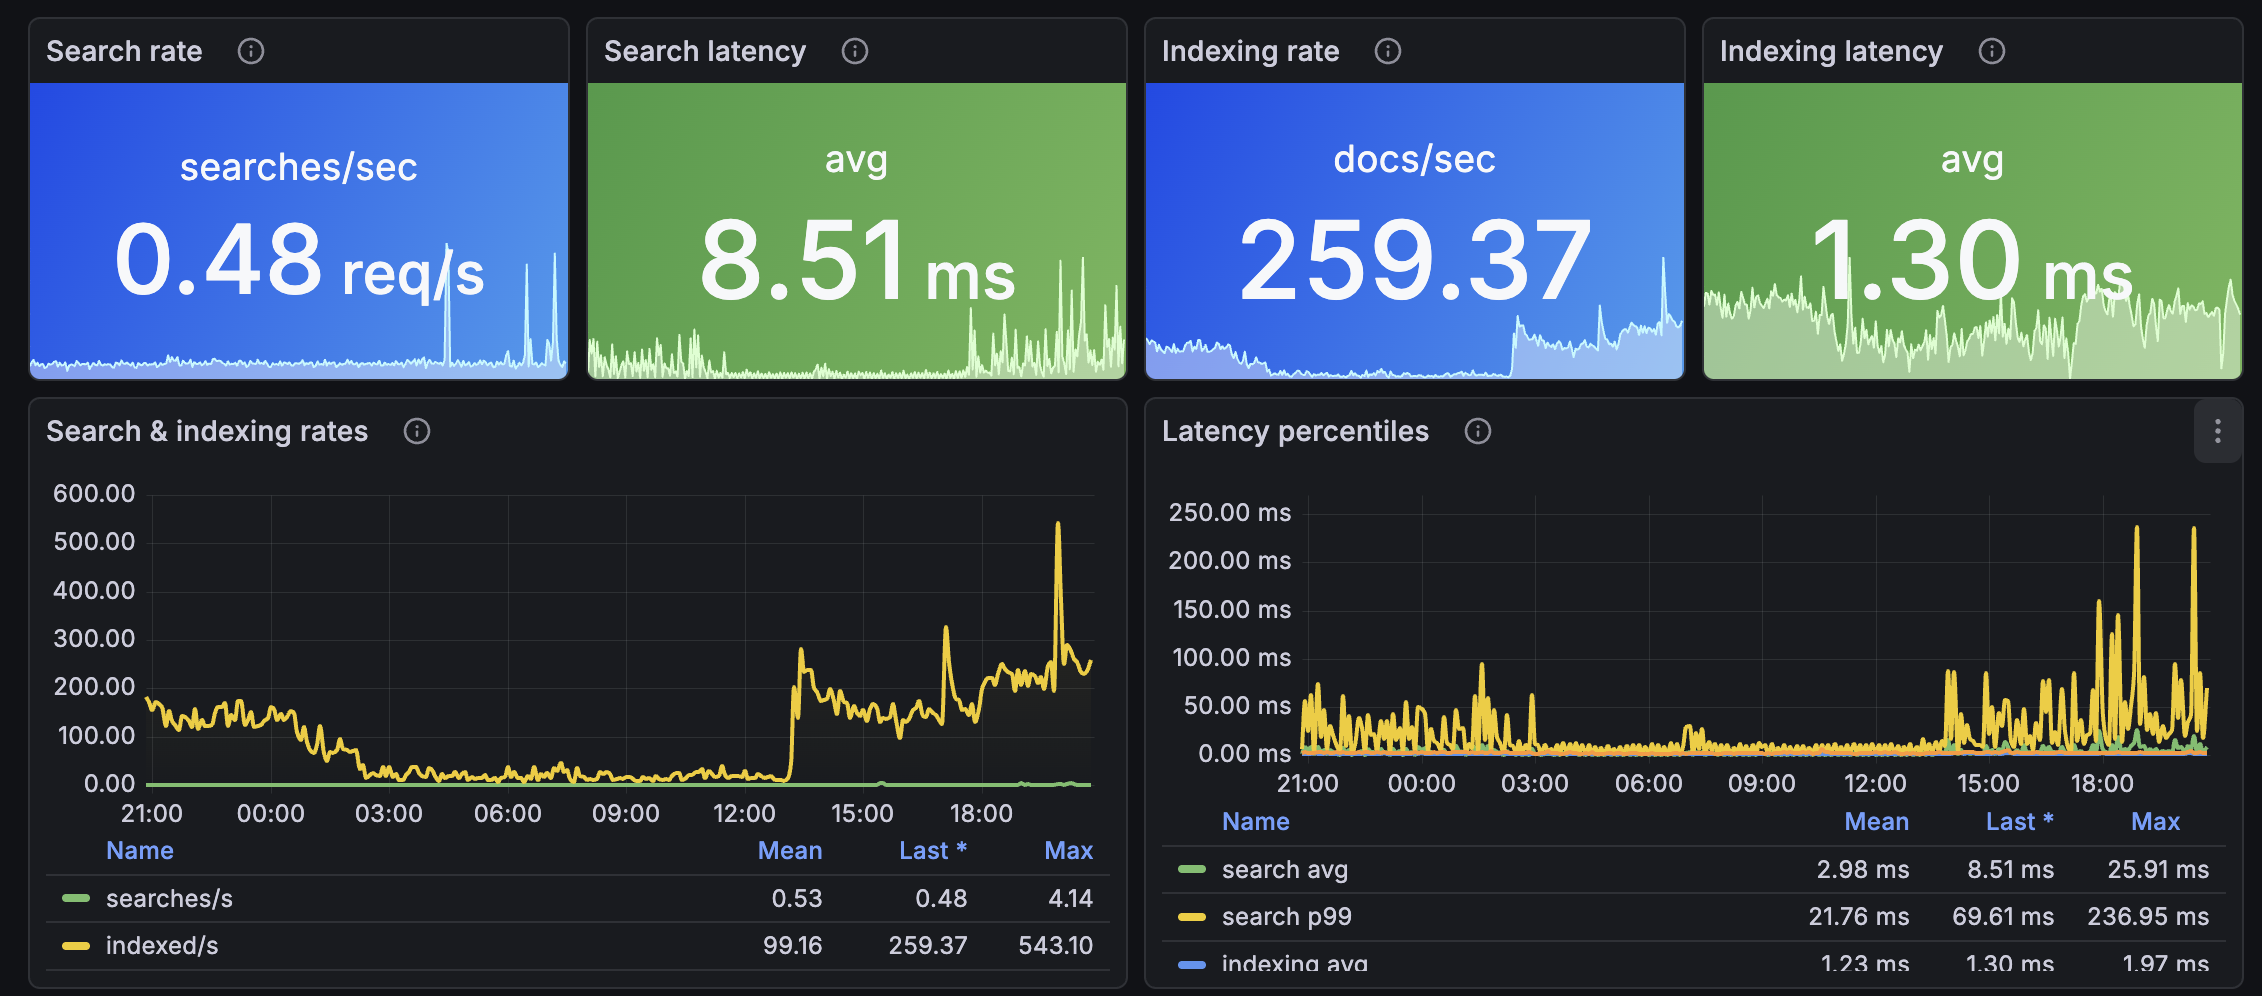
- Search and indexing - search rate, search latency (avg + p99), indexing rate, indexing latency (avg + p99)
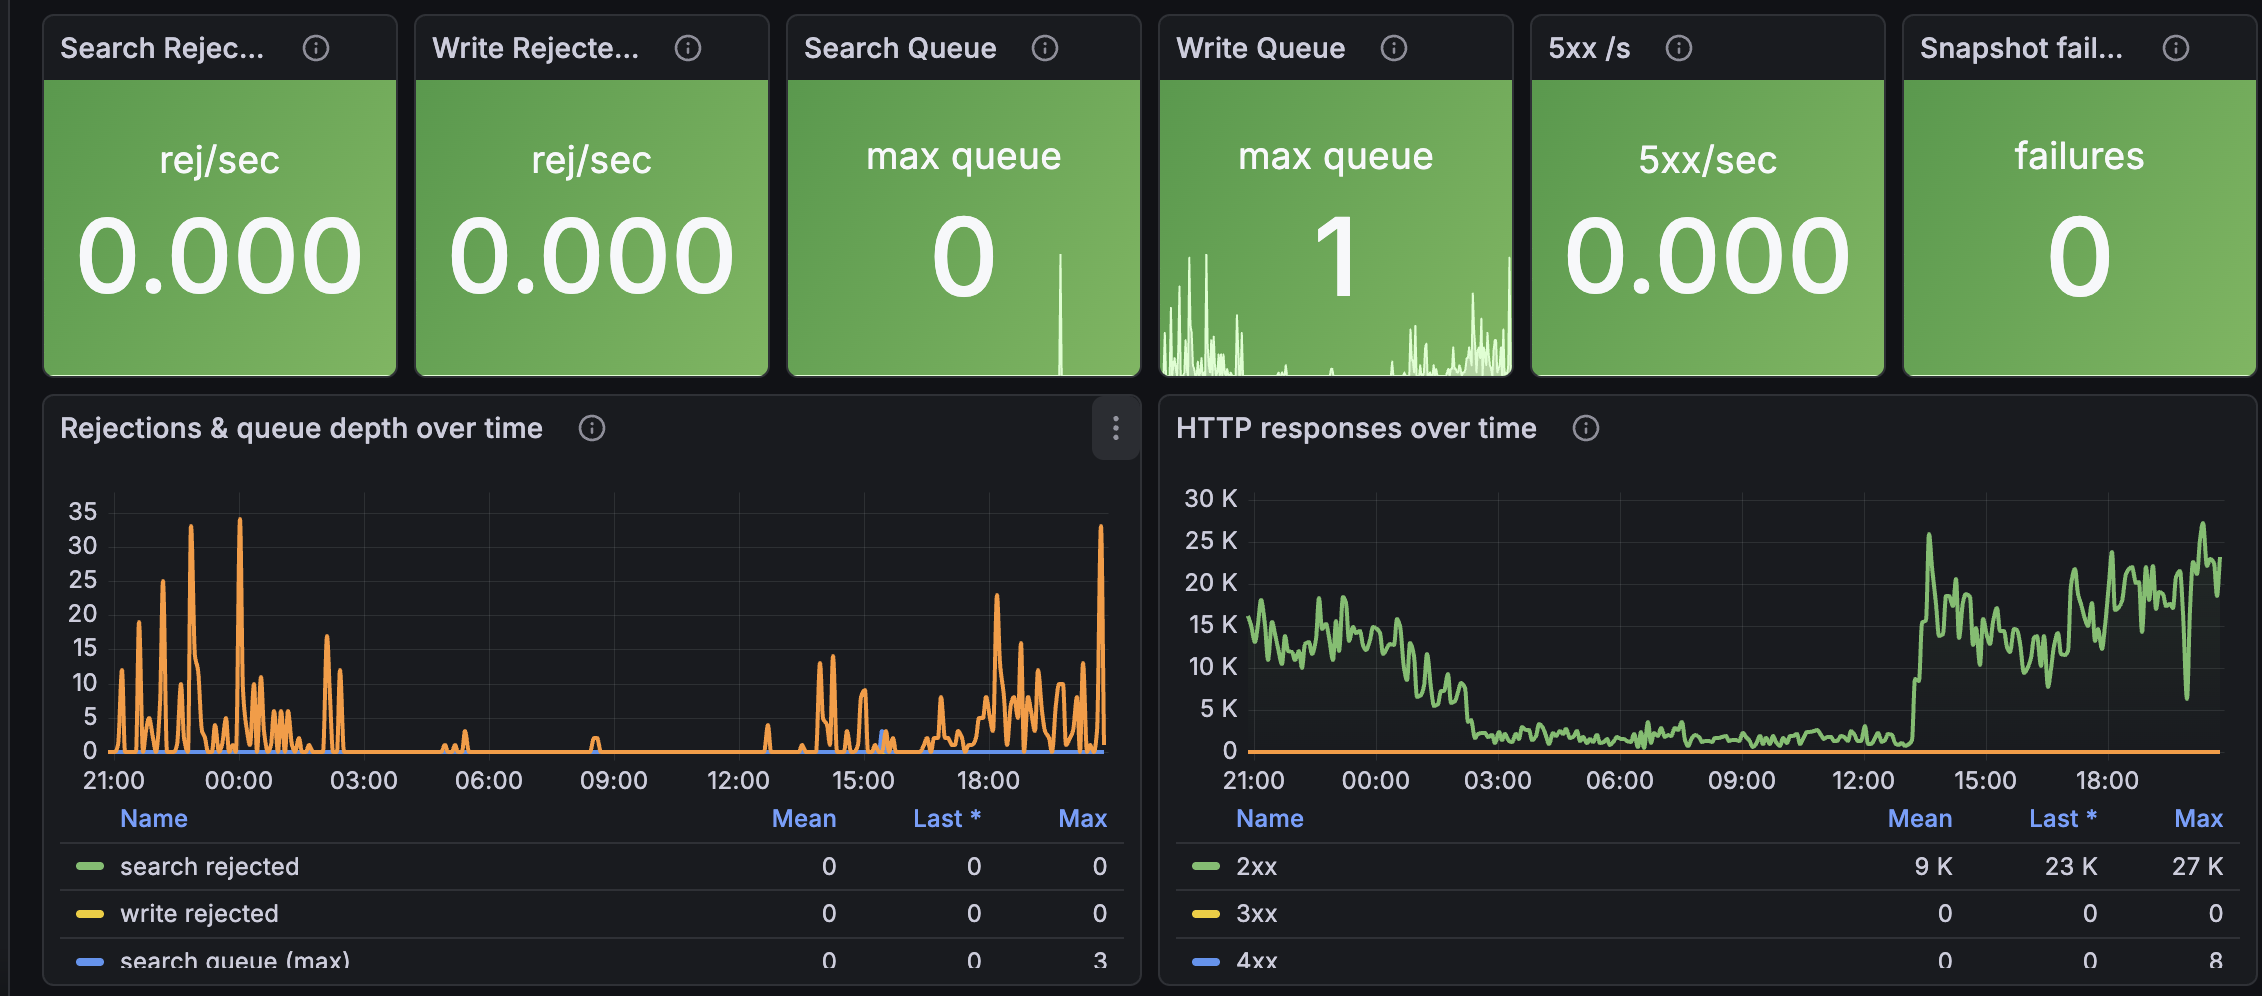
- Throttling and errors - thread-pool search/write rejections per second, search/write queue depth, HTTP response codes (2xx/3xx/4xx/5xx), automated snapshot failures
Key CloudWatch Metrics Used
All metrics are from the AWS/ES namespace, dimensioned by ClientId and DomainName (and Node or TargetGroup where applicable).
ClusterStatus.green / yellow / red
Three binary metrics - exactly one is 1, the others are 0. The dashboard maps them to a single colored label panel.
Nodes, Shards.active, Shards.unassigned, Shards.initializing, Shards.relocating
Cluster topology. Sustained Shards.unassigned > 0 usually means a node failed, the disk-low watermark was breached, or replicas have nowhere to land.
CPUUtilization, JVMMemoryPressure
The two resource metrics that actually predict outages. AWS recommends alarming JVM memory pressure at sustained >80%; above 92% means GC thrash is imminent.
JVMGCYoungCollectionCount, JVMGCYoungCollectionTime, JVMGCOldCollectionCount, JVMGCOldCollectionTime
Garbage collection counts and total time. Frequent old-gen GCs with rising time = heap pressure; scale up or add nodes.
FreeStorageSpace, ClusterUsedSpace
Free space on the worst node (Min stat across nodes) vs total cluster used. Rejects writes when nodes hit the disk-low watermark, so alert well before then.
SearchRate, SearchLatency, IndexingRate, IndexingLatency
Throughput and latency for queries and ingestion. CloudWatch supports p99 natively on the latency metrics - the dashboard uses both avg and p99 to expose tail latency.
ThreadpoolSearchRejected, ThreadpoolWriteRejected, ThreadpoolSearchQueue, ThreadpoolWriteQueue
Rejections only emit when non-zero, so any signal here is a real problem. Watch the queue lines lead the rejection lines - when queues fill up, rejections follow.
AutomatedSnapshotFailure
1 when the last automatic snapshot failed. Non-zero needs investigation immediately; backups are your safety net.
2xx / 3xx / 4xx / 5xx
HTTP response code counts from the domain's REST API. Sudden 4xx surges often mean a client started sending bad queries; 5xx surges = the cluster is in trouble.
Prerequisites
- Grafana 10.0 or later
- AWS CloudWatch datasource plugin configured in Grafana
- IAM permissions on the role/user backing the datasource:
cloudwatch:GetMetricDatacloudwatch:ListMetricscloudwatch:GetMetricStatistics
No OpenSearch domain access policy changes are required since metrics flow through CloudWatch.
Installation
- Download the dashboard JSON.
- In Grafana, go to Dashboards → New → Import.
- Paste the JSON or upload the file.
- When prompted, select your AWS CloudWatch datasource.
- Click Import.
Variables
- Region - AWS region of your OpenSearch domain
- Domain - auto-populated from CloudWatch with every domain that publishes the
Nodesmetric - Period - CloudWatch aggregation period (60s, 300s, or 3600s)
Troubleshooting
Q: The Domains count says 0 even though I have domains.
A: The fleet overview counts only domains currently publishing the Nodes metric. Newly created or paused domains may not appear for a few minutes.
Q: Search/Write Rejected panels are always empty. A: That's healthy - AWS only emits these metrics when non-zero. Empty means no rejections happened in the time range.
Q: Healthy/Unhealthy host panels don't match the console.
A: The dashboard sums HealthyHostCount / UnHealthyHostCount across (TargetGroup, AvailabilityZone) pairs because CloudWatch doesn't emit these without both dimensions. The total matches the console.
Q: Will this work with the older Elasticsearch service?
A: Yes - both legacy Amazon Elasticsearch Service and OpenSearch Service publish to the AWS/ES namespace with the same metric names.
Related AWS Documentation
- Monitoring OpenSearch cluster metrics with CloudWatch
- Recommended CloudWatch alarms for OpenSearch
- Sizing OpenSearch domains
Tags
aws opensearch elasticsearch search cloudwatch monitoring aws-monitoring opensearch-service aws-opensearch cluster-health jvm grafana-dashboard
Data source config
Collector config:
Upload an updated version of an exported dashboard.json file from Grafana
| Revision | Description | Created | |
|---|---|---|---|
| Download |
AWS
Easily visualize and alert on more than 60 Amazon Web Services (AWS) resources using the fully managed Grafana Cloud platform.
Learn more