
AWS / CloudWatch / ElastiCache / Valkey
ElastiCache for Valkey monitoring via native CloudWatch. Pick a cache node from the dropdown (each entry is a node in a replication group).

AWS ElastiCache for Valkey/Redis Monitoring Dashboard for Grafana - CloudWatch Metrics
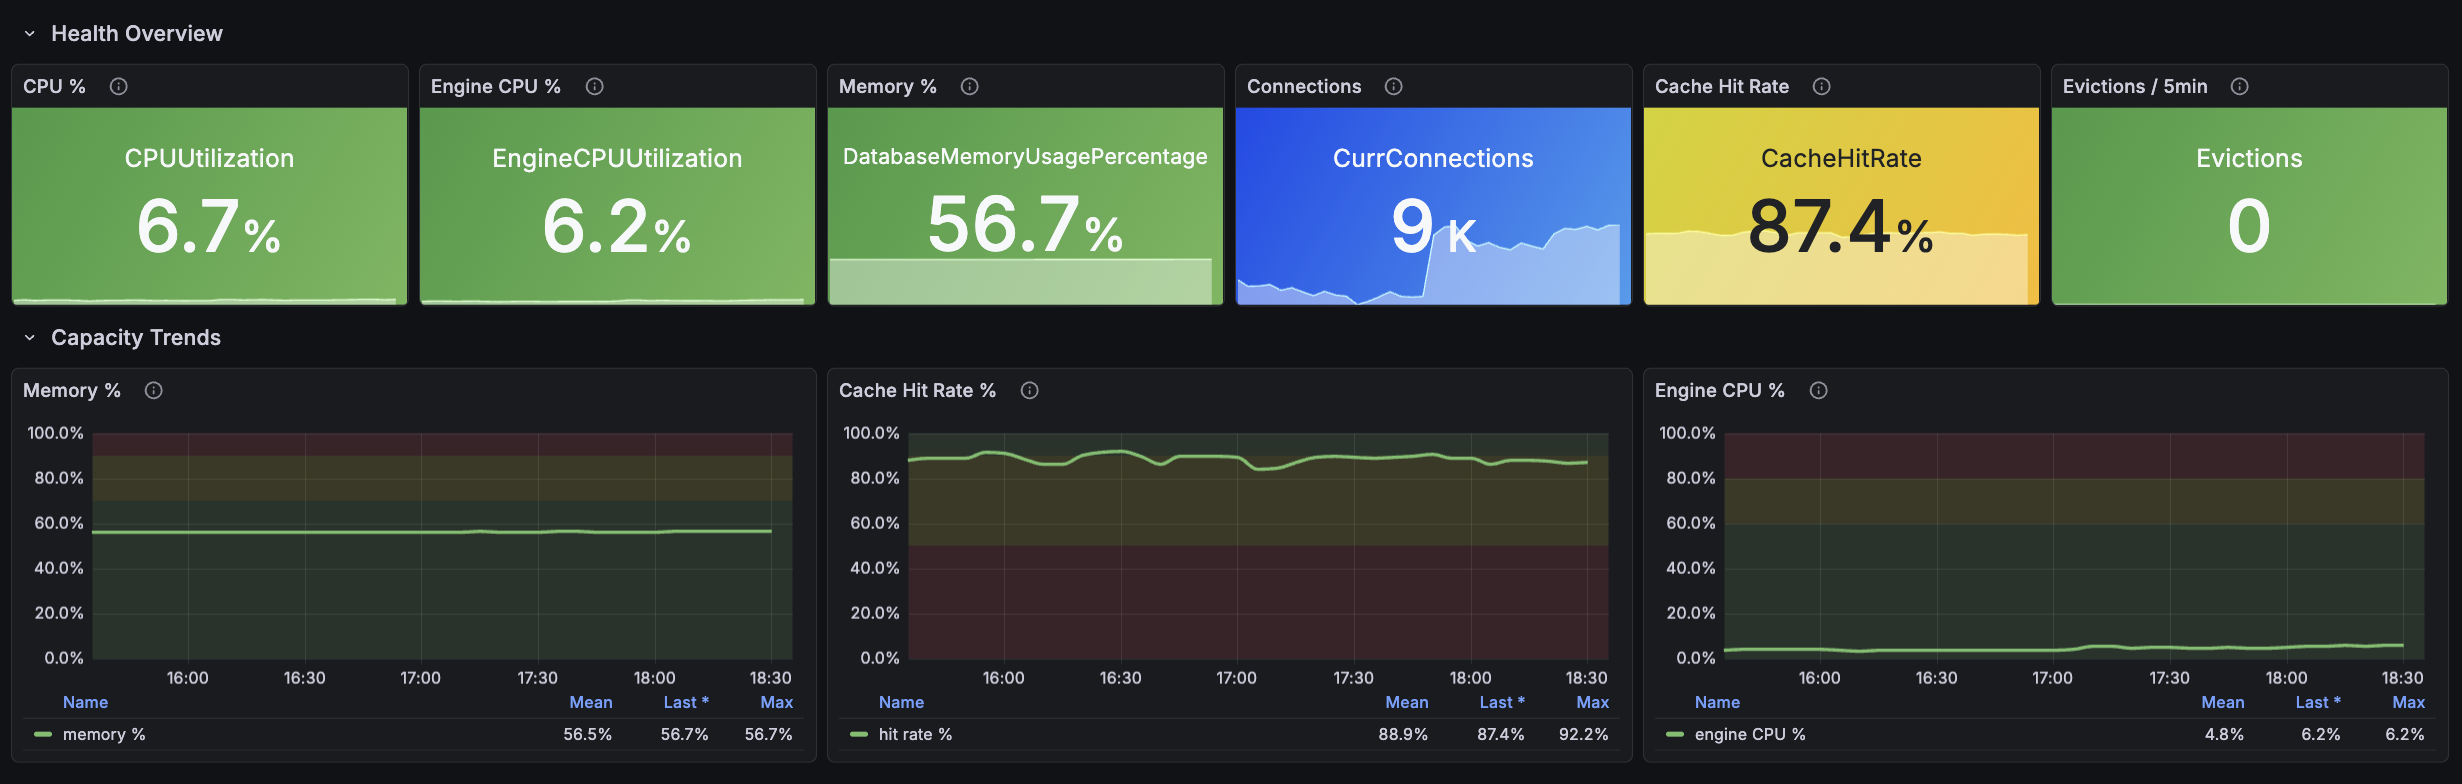
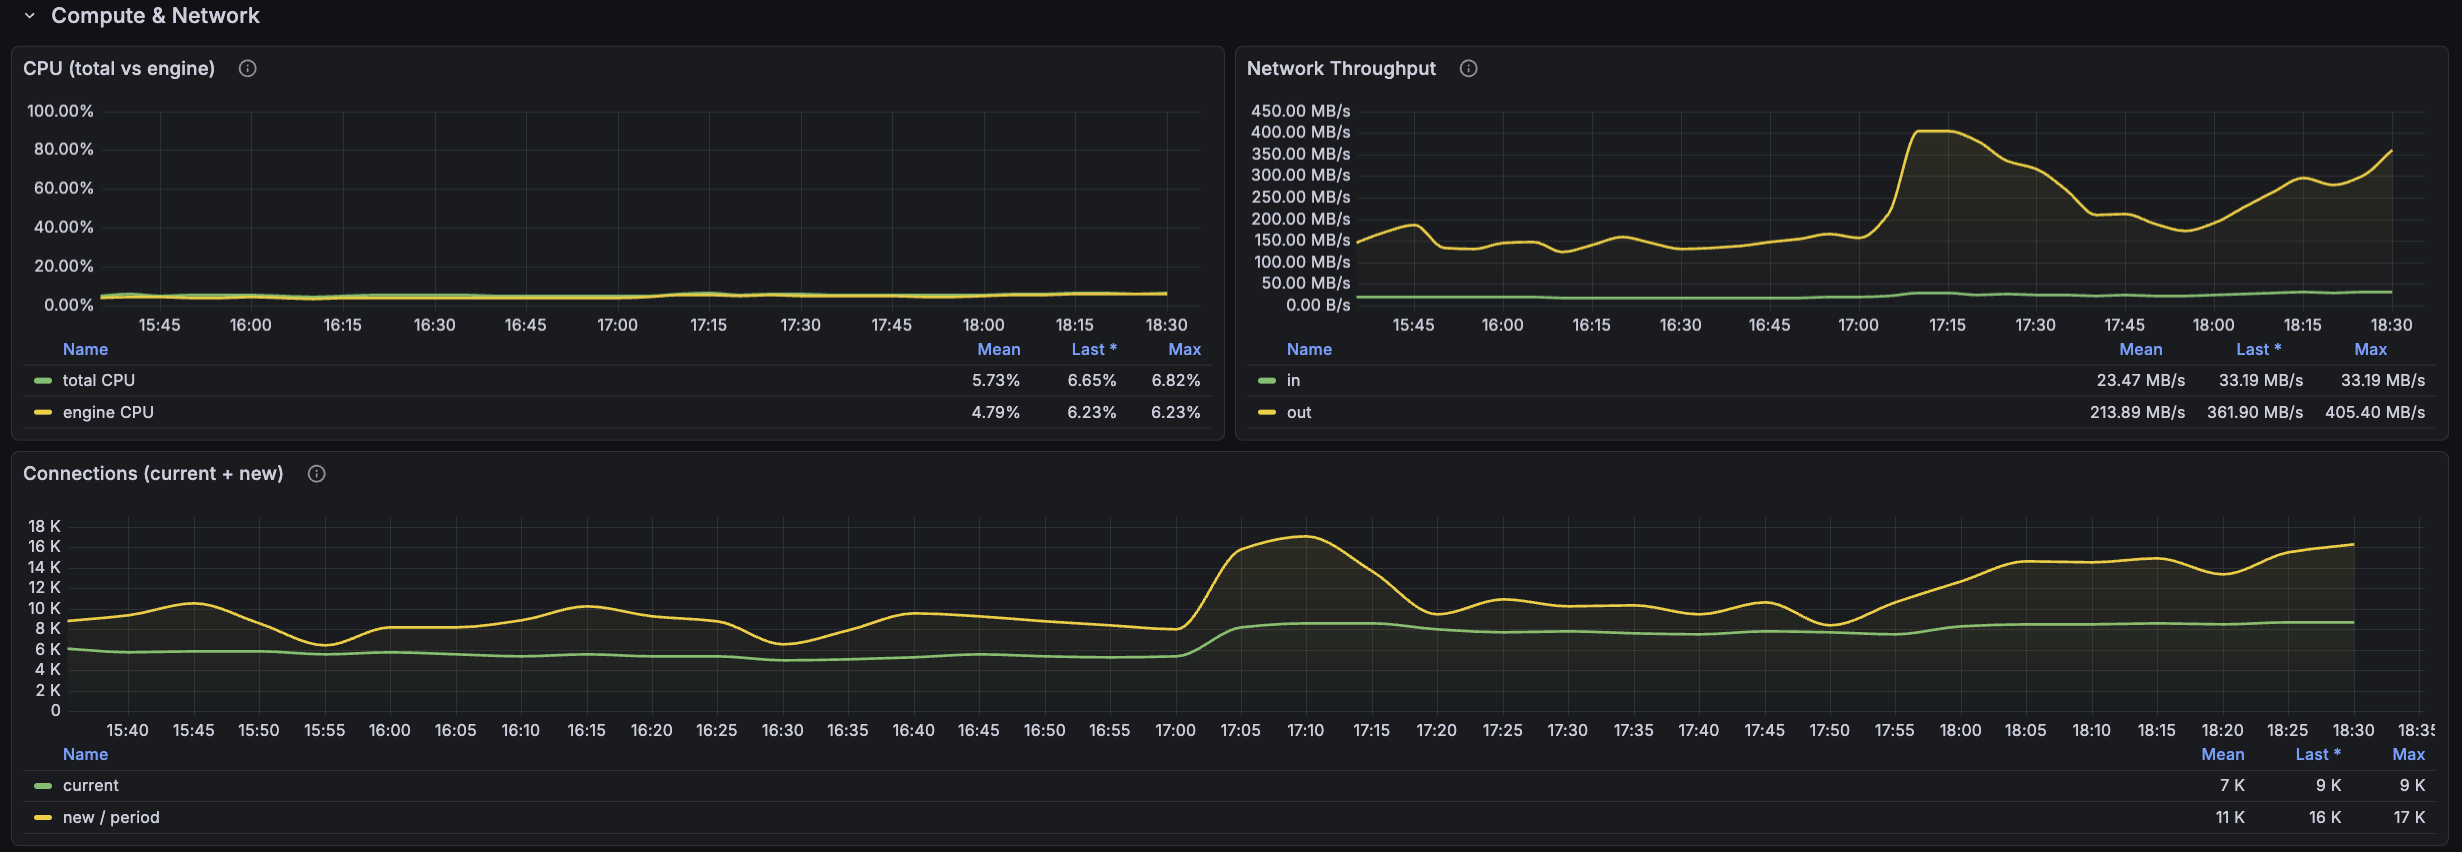
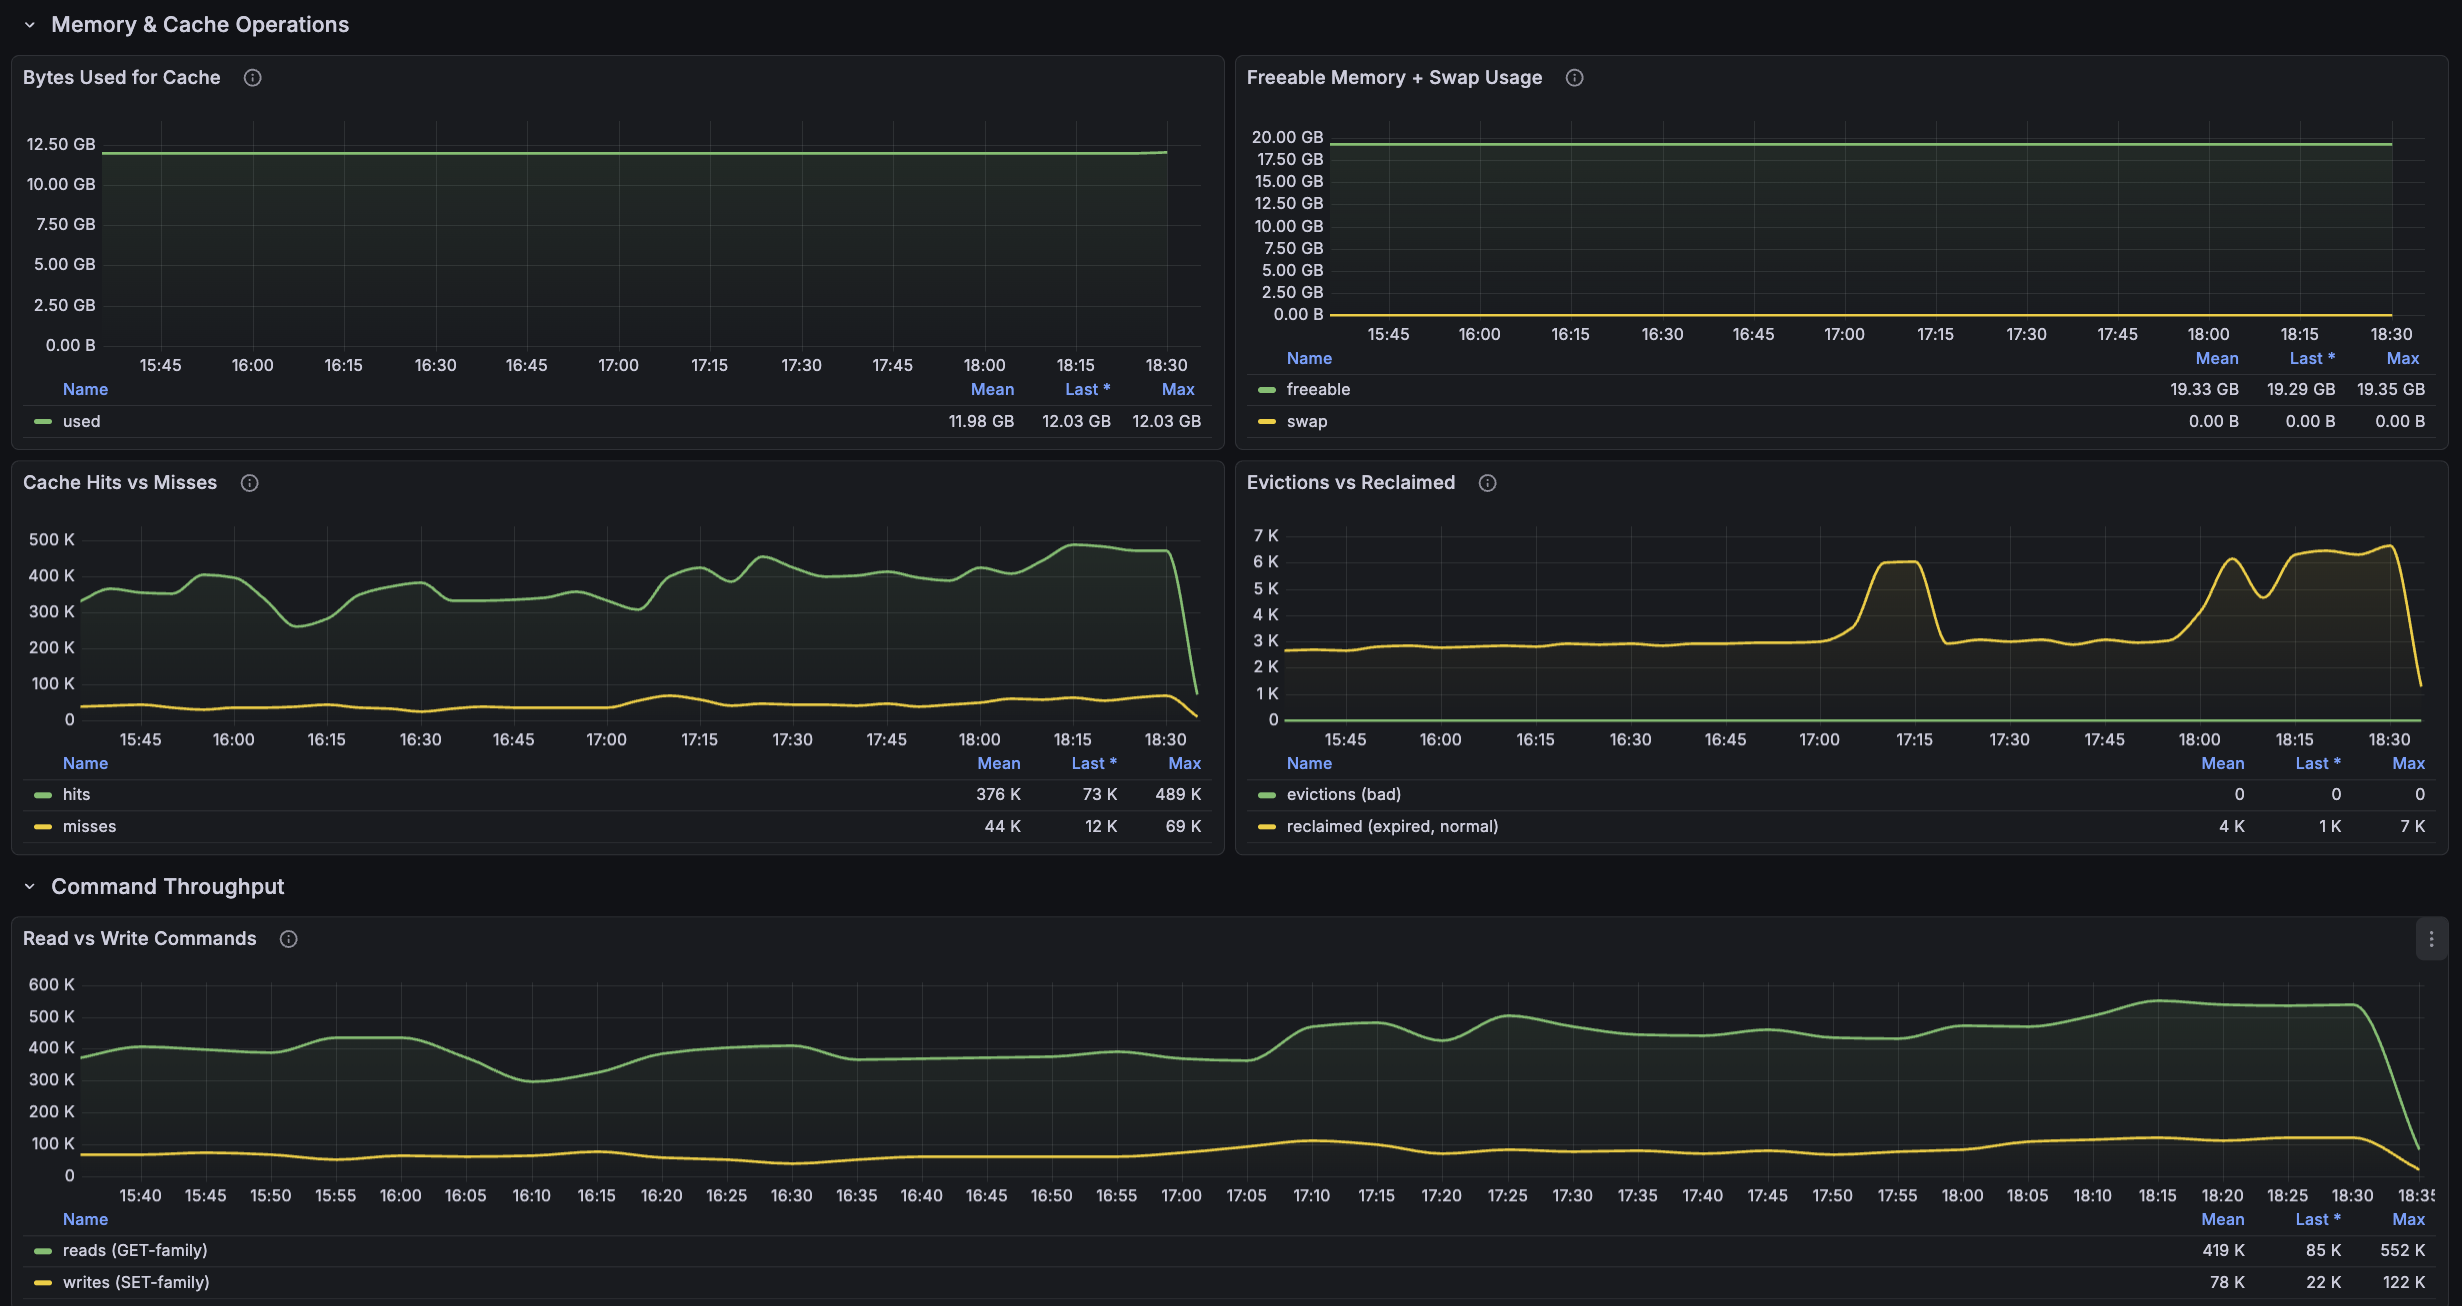
A Grafana dashboard for monitoring AWS ElastiCache for Valkey and Redis OSS using native CloudWatch metrics. Per-node drill-down for CPU, engine CPU, memory utilization, cache hit rate, evictions, network throughput, command throughput, and replication lag - works for both Valkey and Redis engines without any agent installation.
Why monitor AWS ElastiCache?
ElastiCache problems are almost always one of three things: the engine CPU saturates (because Valkey/Redis is effectively single-threaded for command processing), memory fills and starts evicting hot keys, or a replica lag spike masks an underlying network issue. Total instance CPU is misleading on its own - the engine thread saturates one vCPU long before total CPU shows distress. This dashboard separates engine CPU from total CPU so the real bottleneck is visible immediately.
The same dashboard works for both Valkey (the open-source Redis fork now offered by ElastiCache) and Redis OSS, because both engines publish identical CloudWatch metrics.
Features
- Health overview - CPU %, Engine CPU %, Memory %, current connections, cache hit rate, evictions per 5 minutes
- Capacity trends - Memory %, Cache Hit Rate %, and Engine CPU % with threshold zones (green / yellow / red)
- Compute and network - total vs engine CPU on the same axis, network bytes in/out, current and new connection rates
- Memory and cache operations - bytes used for cache, freeable memory + swap (Valkey/Redis should never swap), cache hits vs misses, evictions vs reclaimed (TTL expirations)
- Command throughput - read commands (GET family) vs write commands (SET family) per 5 minutes
- Replication - replica lag in seconds and replication bytes shipped (drops to 0 while writes continue = replication broken)
Key CloudWatch Metrics Used
All metrics are from the AWS/ElastiCache namespace, dimensioned by CacheClusterId.
CPUUtilization vs EngineCPUUtilization
The most important distinction in ElastiCache monitoring. CPUUtilization is total node CPU across all vCPUs; EngineCPUUtilization is just the Valkey/Redis engine thread. Engine CPU saturates near 100% on a single vCPU long before total CPU looks busy. Alarm on engine CPU, not total.
DatabaseMemoryUsagePercentage
Direct percentage of maxmemory in use, published by ElastiCache. Above 90% means eviction (allkeys-lru) or write rejection (noeviction). No math required.
CacheHitRate
Percent of GET commands that returned data. Above 90% is healthy. Below 50% indicates a cold cache, a working set larger than memory, or TTLs that are too aggressive.
Evictions vs Reclaimed
Evictions = keys removed because memory was full (bad - undersized cache). Reclaimed = keys removed because their TTL expired (normal). Sustained Evictions > 0 means scale up or reduce working set.
CurrConnections, NewConnections
Current peak connections and the rate of new connection establishments. High NewConnections with flat CurrConnections indicates connection churn - clients should be using a pool.
NetworkBytesIn, NetworkBytesOut
Network throughput. On t-class instances watch the related NetworkBandwidthAllowanceExceeded and NetworkConntrackAllowanceExceeded metrics - these instances have lower baseline bandwidth and can be throttled under sustained load.
GetTypeCmds, SetTypeCmds
GET-family and SET-family command counts per 5 minutes. The read/write ratio is a useful workload shape indicator and helps with right-sizing decisions.
ReplicationLag, ReplicationBytes
Seconds the slowest replica is behind the primary, and bytes shipped per 5-minute window. No data on primary-only setups (that's expected). Replication bytes dropping to 0 while writes continue = replication broken.
FreeableMemory, SwapUsage
OS-level free memory and swap. Any non-zero swap usage indicates memory pressure - Valkey/Redis should never swap.
Prerequisites
- Grafana 10.0 or later
- AWS CloudWatch datasource plugin configured in Grafana
- IAM permissions on the role/user backing the datasource:
cloudwatch:GetMetricDatacloudwatch:ListMetricscloudwatch:GetMetricStatistics
No ElastiCache-specific permissions are required since metrics flow through CloudWatch.
Installation
- Download the dashboard JSON.
- In Grafana, go to Dashboards → New → Import.
- Paste the JSON or upload the file.
- When prompted, select your AWS CloudWatch datasource.
- Click Import.
Variables
- Region - AWS region of your ElastiCache cluster
- Cache Node - auto-populated from CloudWatch with every
CacheClusterIdin the region (each entry is one node in a replication group)
Troubleshooting
Q: Engine CPU is at 95% but total CPU is only 30% - is something wrong? A: Yes, and this is exactly why the dashboard separates them. The engine thread is single-threaded for command processing, so it saturates one vCPU long before total CPU notices. Scale up the instance class or split into more shards.
Q: Replication Lag panel is empty. A: The selected cluster is a primary-only deployment (no read replicas). Add a replica or pick a clustered deployment to see lag.
Q: Does this work for Redis OSS too, or only Valkey? A: Both - ElastiCache for Valkey and Redis OSS publish identical CloudWatch metrics with the same names.
Q: Cache Hit Rate is below 50%. What now? A: Three common causes: (1) cache is too small for the working set (check evictions), (2) TTLs are too aggressive, (3) a cold cache after a failover or restart. The Evictions vs Reclaimed panel will narrow it down.
Related AWS Documentation
- Monitoring ElastiCache with CloudWatch metrics
- ElastiCache Valkey best practices
- Choosing ElastiCache node types
Tags
aws elasticache valkey redis cache cloudwatch monitoring aws-monitoring aws-elasticache redis-monitoring valkey-monitoring cache-monitoring grafana-dashboard
Data source config
Collector config:
Upload an updated version of an exported dashboard.json file from Grafana
| Revision | Description | Created | |
|---|---|---|---|
| Download |

AWS

Easily visualize and alert on more than 60 Amazon Web Services (AWS) resources using the fully managed Grafana Cloud platform.
Learn more