AWS / CloudWatch / Lambda
AWS Lambda monitoring via native CloudWatch. Account-wide fleet view (sections 1–5) with per-function breakdowns and top-N panels, plus a 'Selected Function Detail' section at the bottom for drilling into one function. Pick region, period, and function from the dropdowns.
AWS Lambda Monitoring Dashboard for Grafana - CloudWatch Metrics
A Grafana dashboard for monitoring AWS Lambda functions using native CloudWatch metrics. Account-wide fleet overview plus per-function drill-down for invocations, errors, throttles, duration percentiles, and concurrency - built to surface the slow, broken, and capacity-constrained functions across an entire AWS account on one screen.
Why monitor AWS Lambda?
Lambda failures hide easily. A single function out of fifty can throw 5% errors for weeks before anyone notices, because no human is tailing CloudWatch Logs for every function. Throttling is even quieter - the function just runs less, the queue backs up, and downstream services see latency that traces back to Lambda hours later. This dashboard makes those failures visible by surfacing the worst-offender functions at the top of every section, so issues find you instead of the other way around.
It uses only the standard Lambda metrics CloudWatch publishes for free, with no Lambda Insights or X-Ray required.
Features
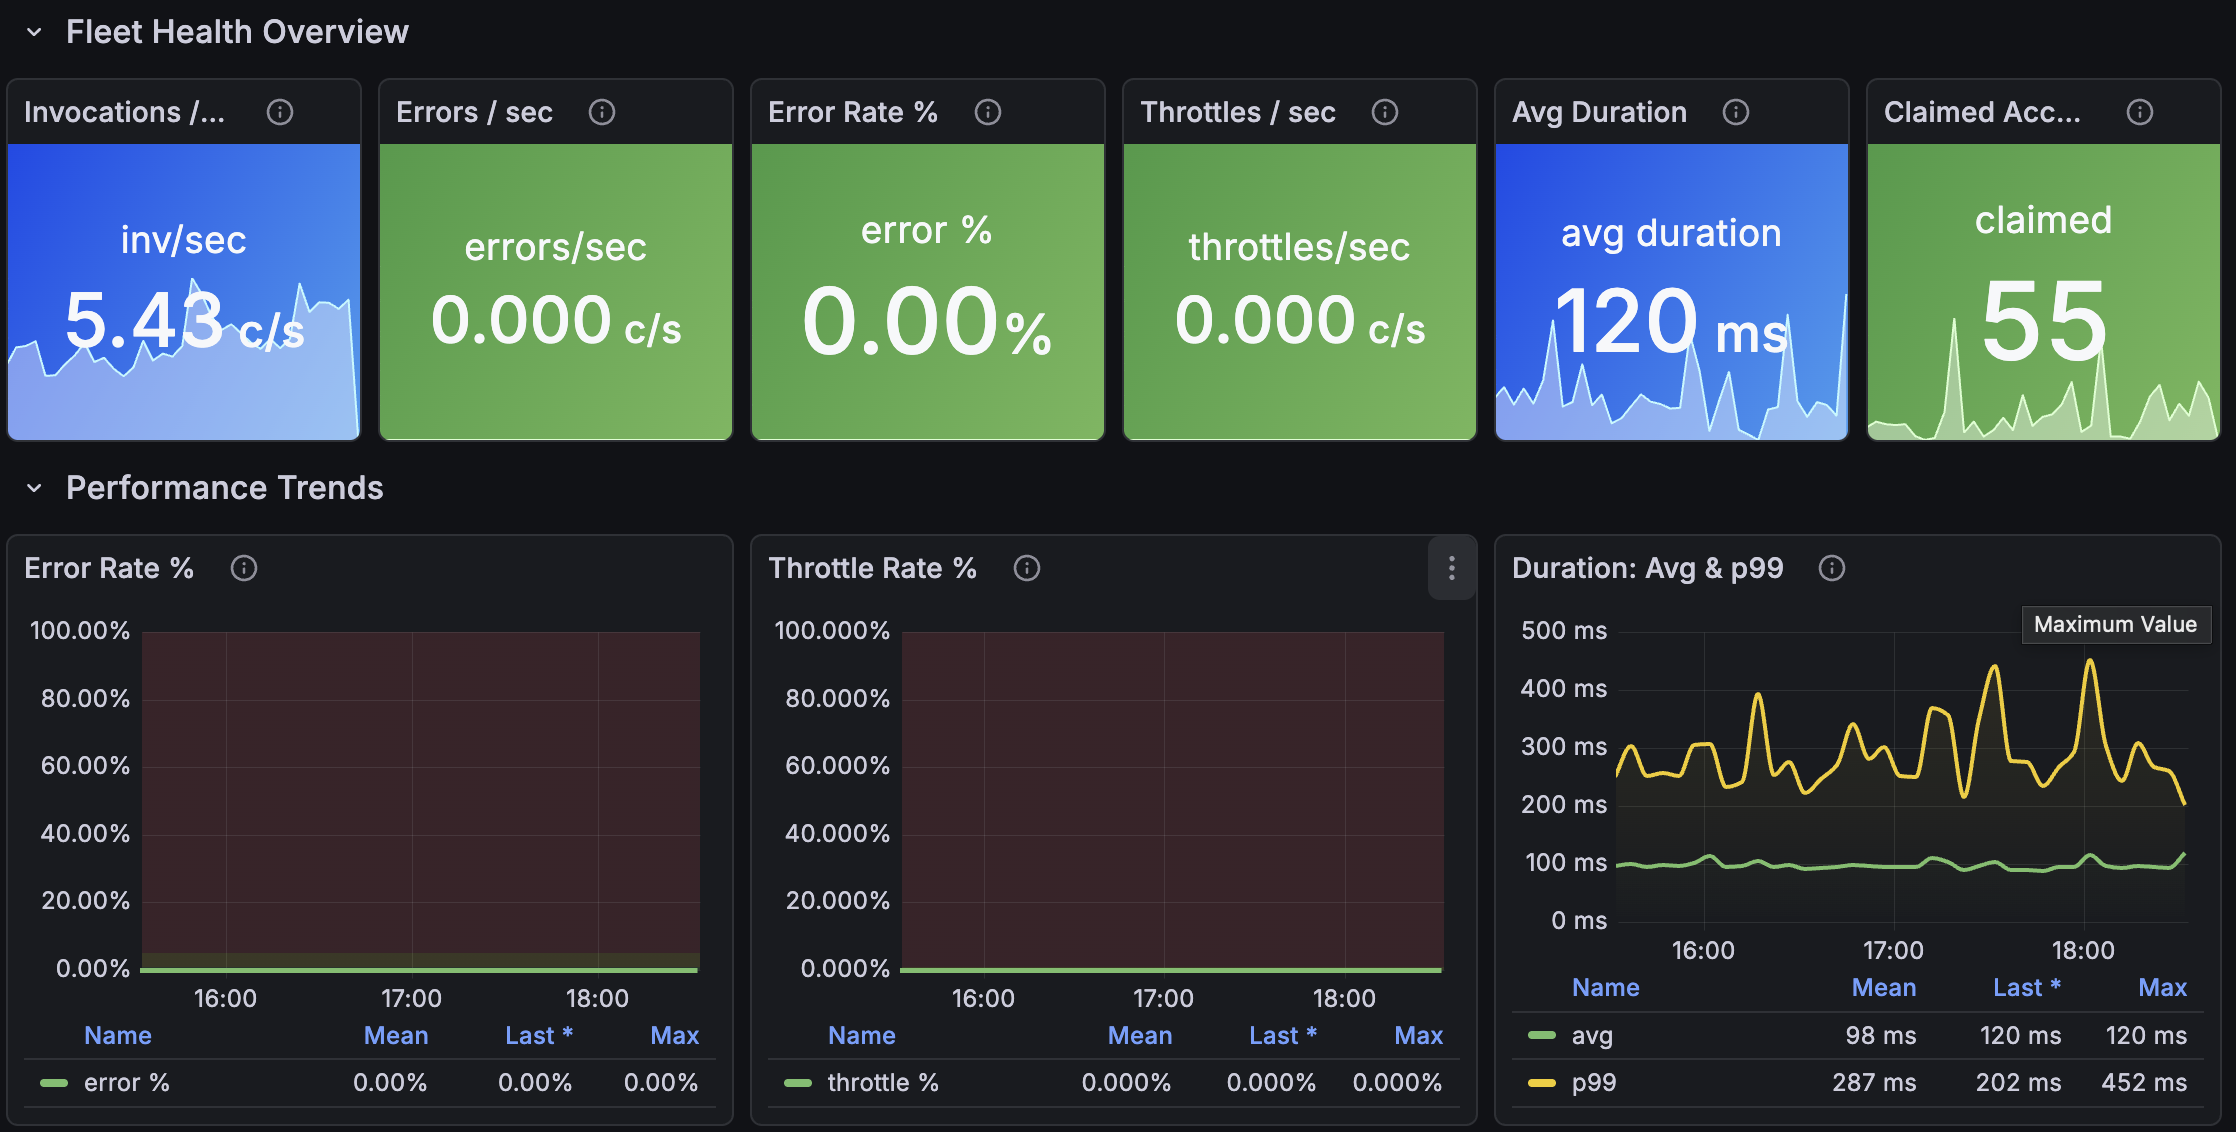
- Fleet health - invocations per second, errors per second, error rate %, throttles per second, average duration, claimed account concurrency
- Performance trends - error rate %, throttle rate %, and duration (avg + p99) over time
- Per-function breakdown - invocations, duration, errors, and throttles per function on log-scale axes (so chatty functions don't drown out the quiet ones)
- Top offenders - top 10 functions by total errors, by average duration, and by invocation volume in the selected time range
- Concurrency - account-level claimed concurrency vs the default 1000 quota, plus peak concurrent executions per function
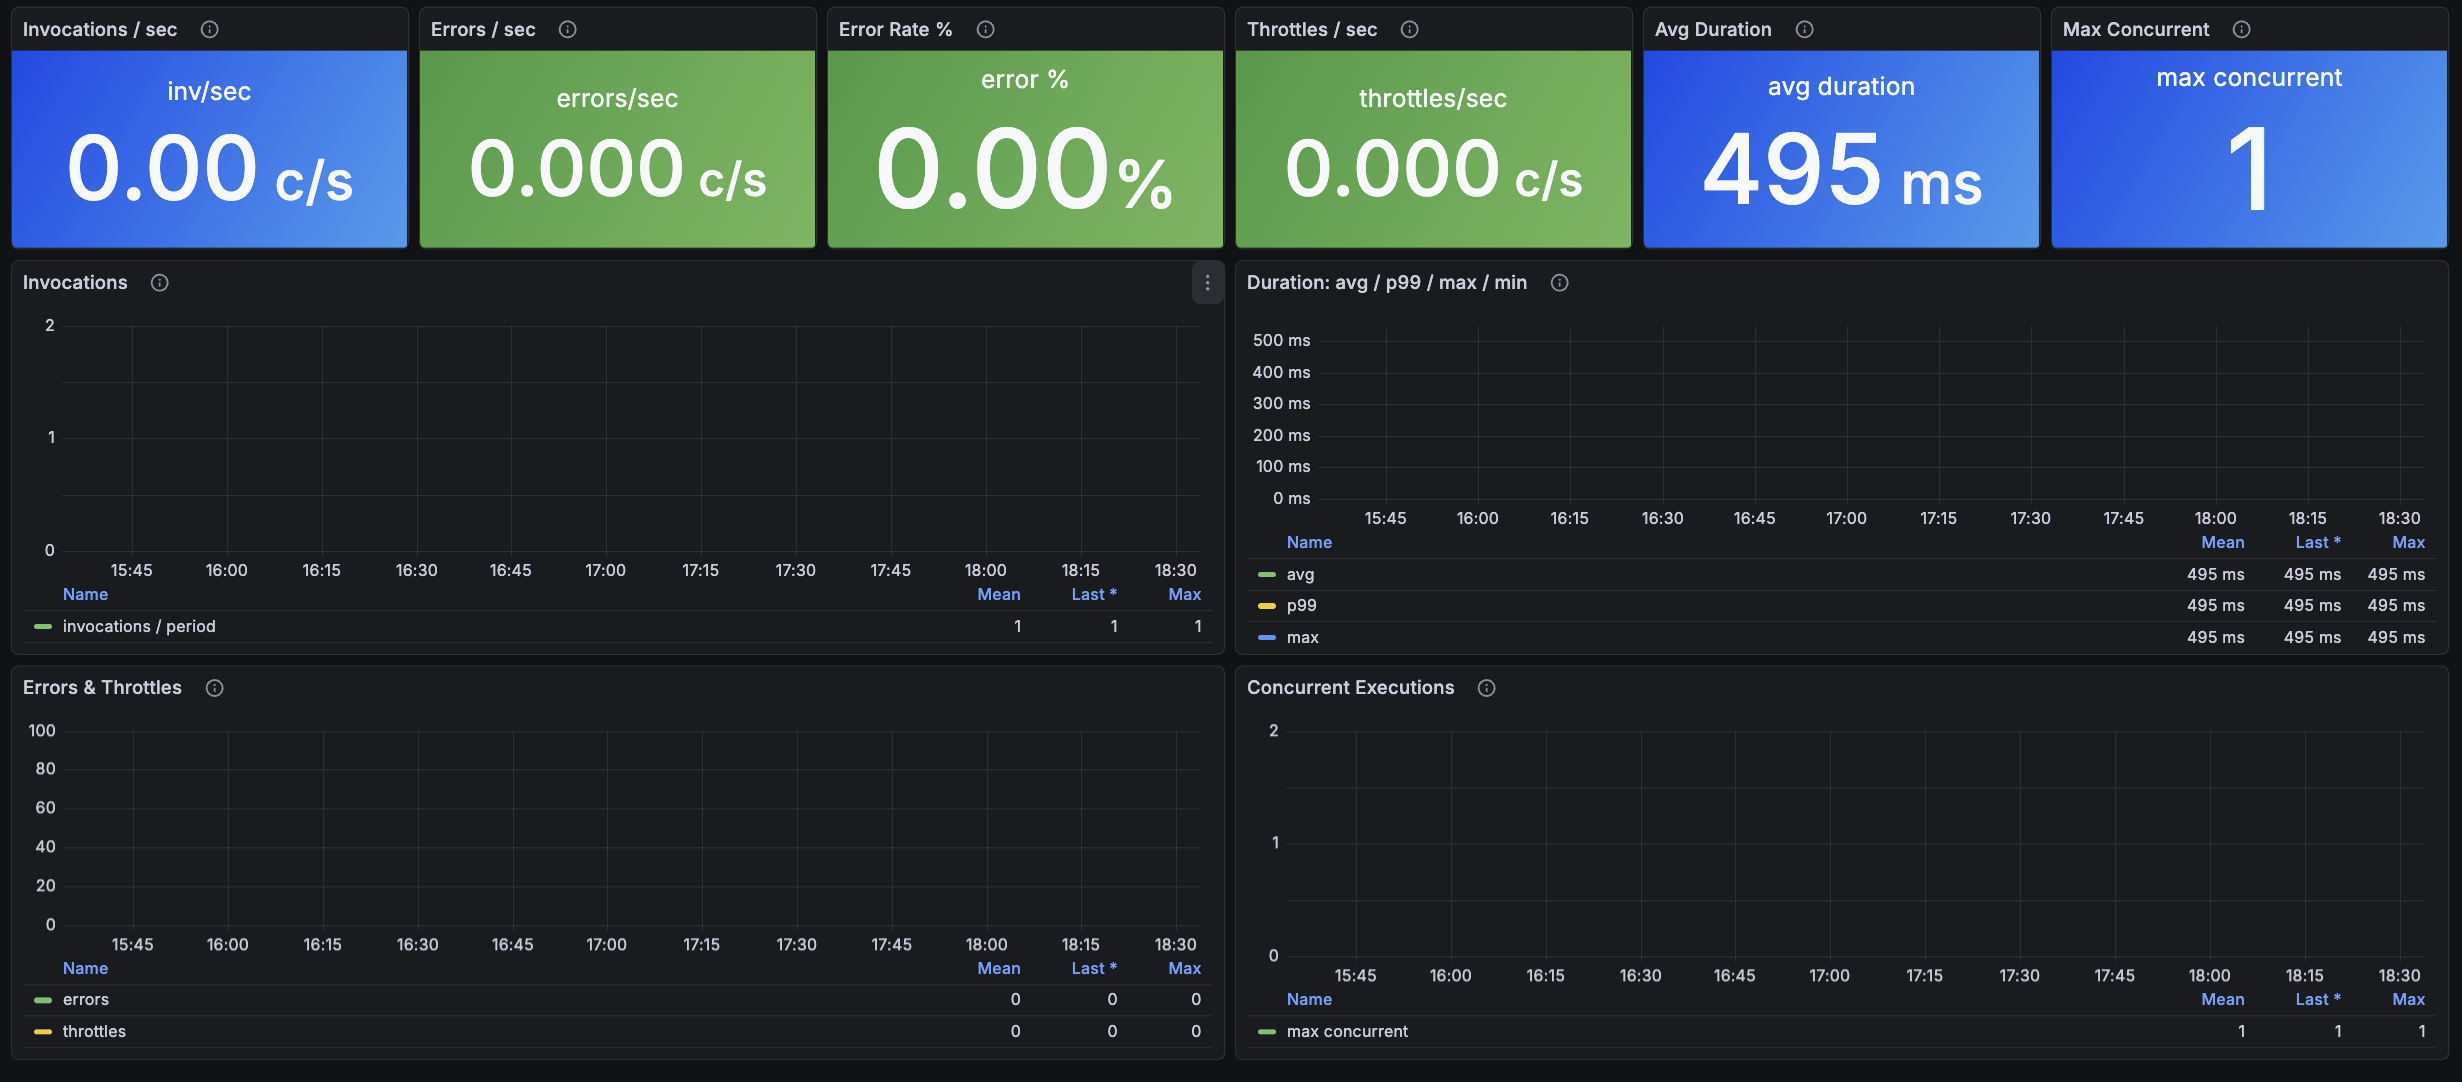
- Selected function detail - per-function invocations, duration percentiles (avg / p99 / max / min), errors, throttles, and concurrent executions
Key CloudWatch Metrics Used
All metrics are from the AWS/Lambda namespace.
Invocations
Total successful + failed invocations. Throttled requests are NOT counted as invocations (they're separate), so error rate calculated as Errors / Invocations is technically "errors per successful attempt" - close enough for monitoring.
Errors
Failed invocations: function-thrown exceptions, timeouts, out-of-memory crashes. Doesn't include throttles.
Throttles
Invocations rejected because the function's concurrency limit (reserved or account-wide) was hit. Any sustained throttling means reserved concurrency or an account quota increase is needed.
Duration
Execution time in milliseconds. CloudWatch supports p99 natively - the dashboard uses both average (typical case) and p99 (slow 1%, often cold starts). A wide gap between avg and p99 indicates bimodal performance.
ConcurrentExecutions
Peak concurrent invocations per function. Useful for identifying which functions are eating into the account concurrency budget.
ClaimedAccountConcurrency
Account-level concurrency unavailable for on-demand invocations (= UnreservedConcurrentExecutions + allocated reserved + provisioned). This is the official AWS metric for tracking proximity to the account quota. Default quota is 1000 - thresholds assume that; adjust if you've raised yours.
Prerequisites
- Grafana 10.0 or later
- AWS CloudWatch datasource plugin configured in Grafana
- IAM permissions on the role/user backing the datasource:
cloudwatch:GetMetricDatacloudwatch:ListMetricscloudwatch:GetMetricStatistics
No Lambda-specific permissions are required since metrics flow through CloudWatch.
Installation
- Download the dashboard JSON.
- In Grafana, go to Dashboards → New → Import.
- Paste the JSON or upload the file.
- When prompted, select your AWS CloudWatch datasource.
- Click Import.
Variables
- Region - AWS region of your Lambda functions
- Period - CloudWatch aggregation period (60s, 300s, 3600s)
- Function - auto-populated from CloudWatch with every
FunctionNamethat hasInvocationsdata in the region; drives the "Selected Function" detail section
Troubleshooting
Q: A function exists but doesn't show up in the dropdown.
A: The function hasn't been invoked recently. CloudWatch only lists FunctionName dimension values that have published metrics. Trigger one invocation and it'll appear.
Q: Why are per-function panels on a log scale? A: Lambda invocation counts span many orders of magnitude across a typical account (one chatty function at 100k/min, another at 1/hour). Linear scale would visually erase the quieter functions.
Q: The Claimed Account Concurrency thresholds are red at 900 but my quota is 5000. A: Edit the panel and adjust the threshold steps to match your raised quota. The defaults assume the standard 1000 quota.
Q: Throttle Rate % calculation - is it accurate?
A: It's Throttles / Invocations * 100. Since throttled requests aren't counted as invocations, this is technically "throttles per successful attempt" rather than "throttles per total attempt". For monitoring purposes the difference is negligible.
Related AWS Documentation
Tags
aws lambda serverless cloudwatch monitoring aws-monitoring aws-lambda serverless-monitoring function-monitoring concurrency grafana-dashboard
Data source config
Collector config:
Upload an updated version of an exported dashboard.json file from Grafana
| Revision | Description | Created | |
|---|---|---|---|
| Download |
AWS
Easily visualize and alert on more than 60 Amazon Web Services (AWS) resources using the fully managed Grafana Cloud platform.
Learn more