Power HMC — Per System
Single managed-system deep-dive for IBM Power servers, driven by the **[power-hmc-exporter](https://aixwatch.com/product/power-hmc-exporter/)** — an agentless Prometheus exporter that polls the HMC REST API and PCM. Pick one managed system and see its capacity, every LPAR, both VIOS, and the full I/O path — CPU, memory, network (SEA), Fibre Channel (NPIV) and Virtual SCSI — on a single screen. **▶ The panels need live data.** Point **power-hmc-exporter** at your HMC and they fill in — agentless, ~5 min to first scrape. **→ [Download the free trial](https://aixwatch.com/trial/)**
Single managed-system deep-dive for IBM Power servers, driven by the power-hmc-exporter — an agentless Prometheus exporter that polls the HMC REST API and PCM. Pick one managed system and see its capacity, every LPAR, both VIOS, and the full I/O path — CPU, memory, network (SEA), Fibre Channel (NPIV) and Virtual SCSI — on a single screen.
It is the drill-down companion to Power HMC — Overview (estate-wide) and Power HMC — Per LPAR (single partition): every name in the LPAR table links straight through to the per-LPAR dashboard.
Requirements
- power-hmc-exporter v0.9.0+ scraped by Prometheus (the
power_hmc_*metrics) — grab the free-trial binary → - A Prometheus data source — selected at the top via the
Datasourcevariable. - Optional: aix-exporter on your VIOS for the Fibre Channel link/resource
error panels (
aix_fcstat_*). Where absent, those panels show No data.
What you get
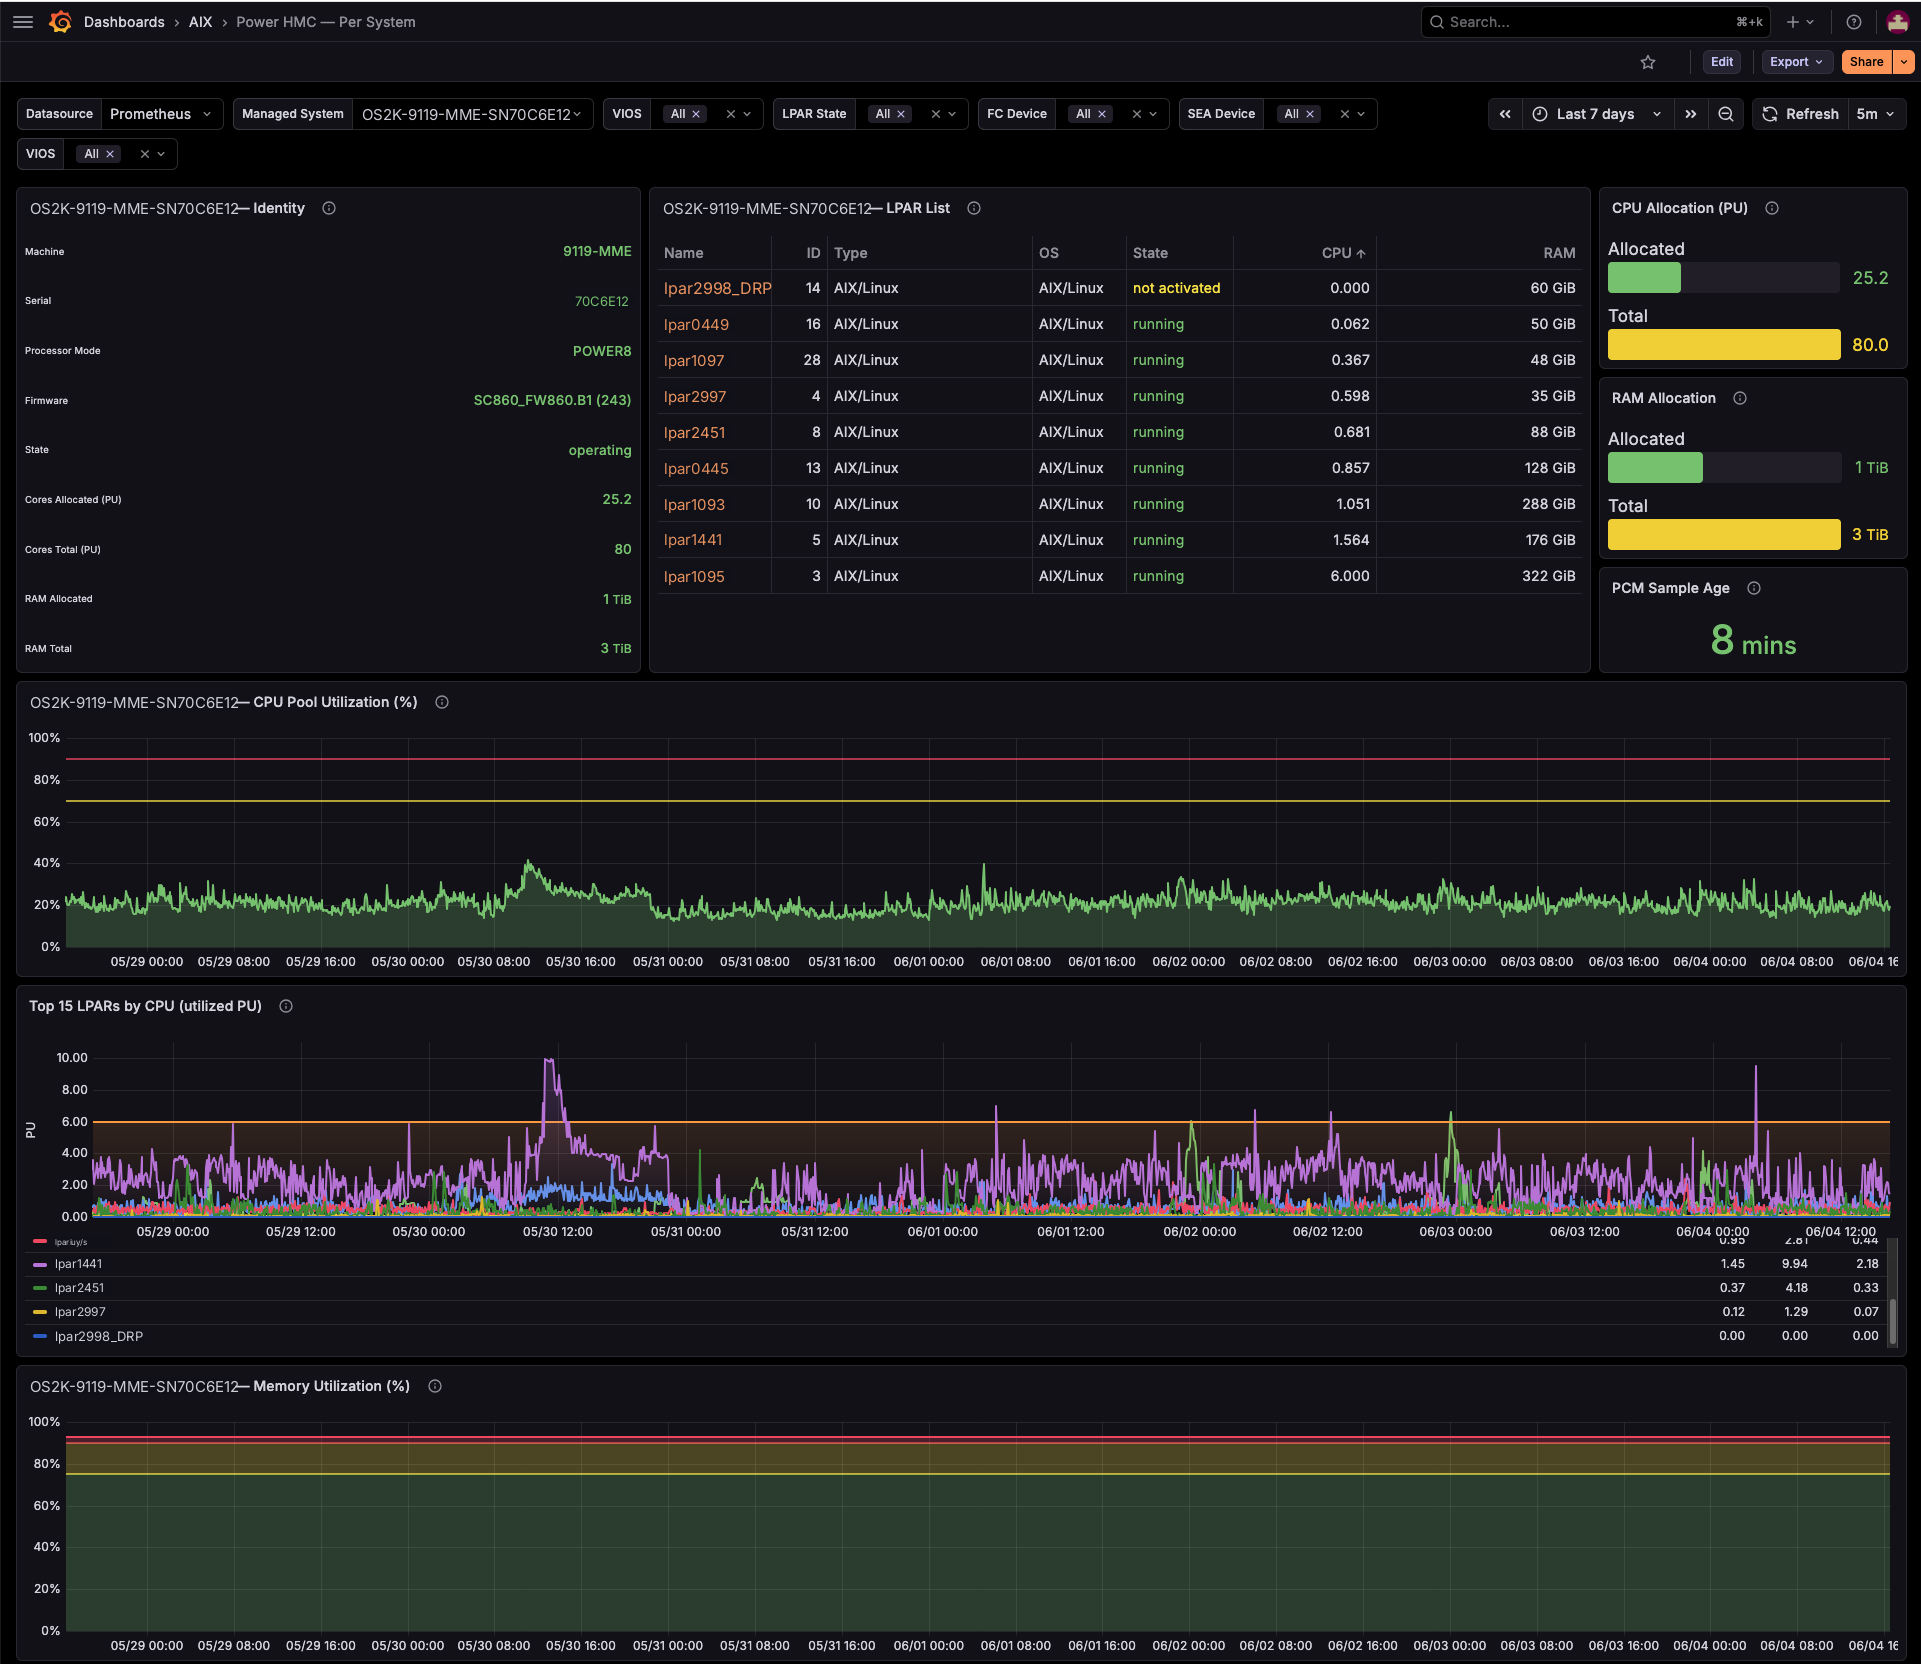
- Identity & capacity — type-model, serial, processor mode, firmware, state, cores & RAM allocated vs total, and a PCM Sample Age stat (HMC V10 PCM is ~6–7 min latent; thresholds flag staleness at 10 / 15 min).
- LPAR inventory — every partition (ID, type, OS, state, CPU, RAM), each name linking to the per-LPAR dashboard.
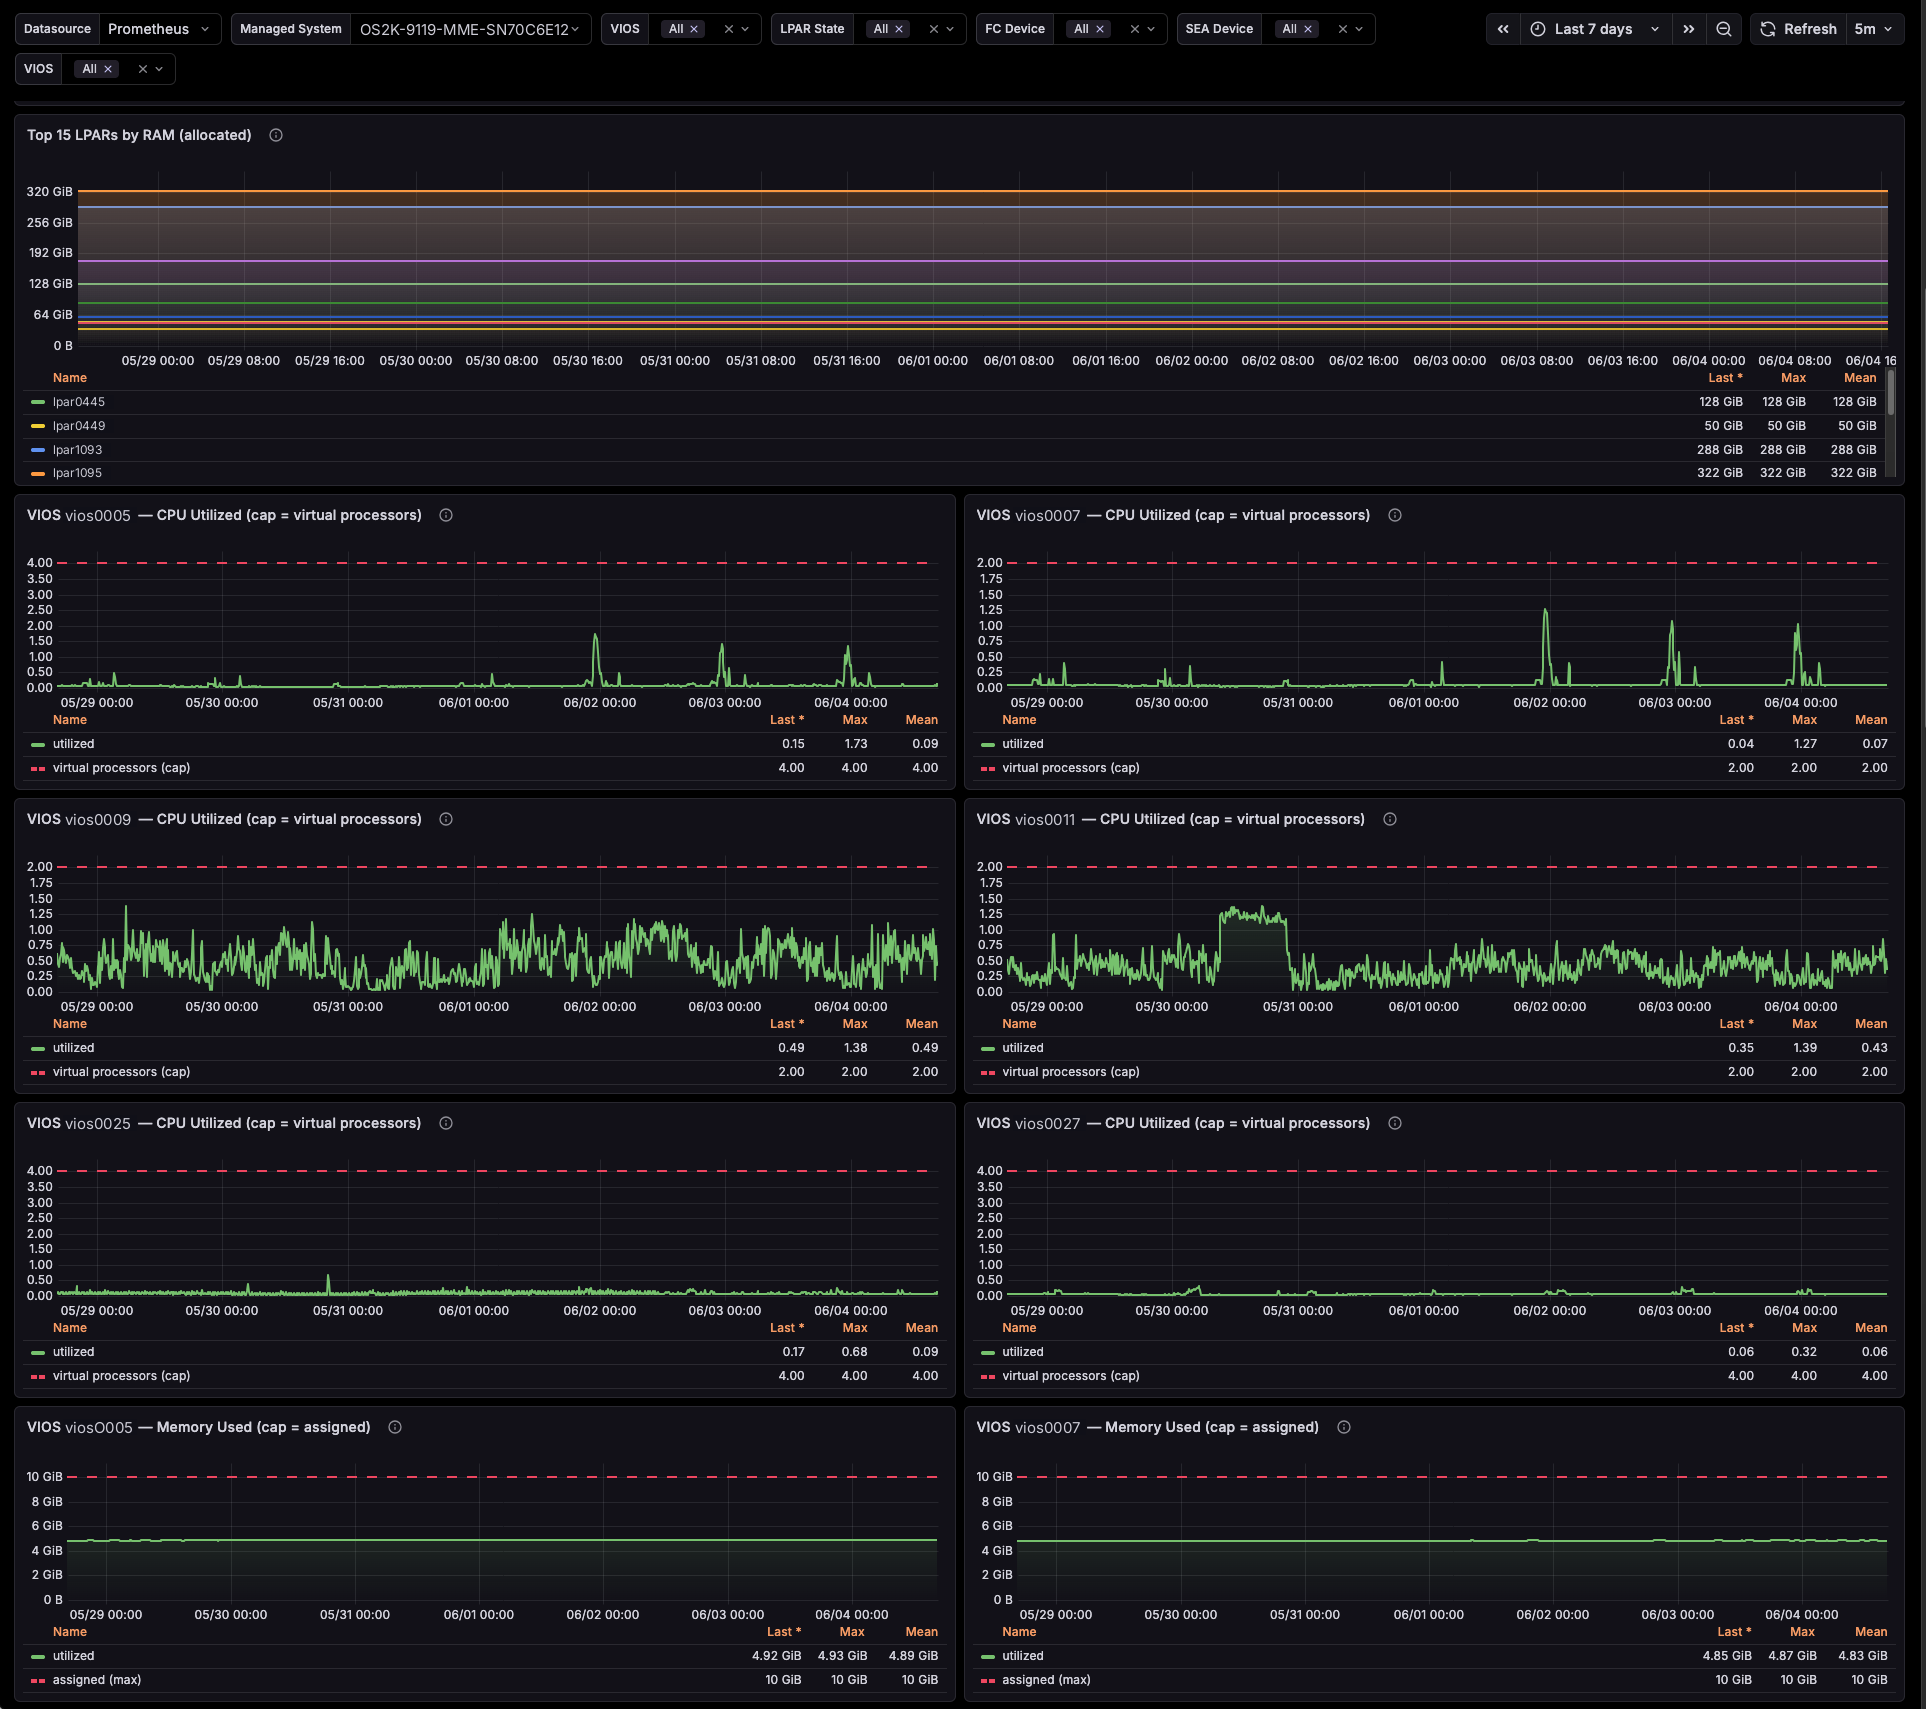
- Compute — CPU pool %, memory %, Top 15 LPARs by CPU and by RAM.
- Per-VIOS — CPU utilised vs virtual-processor cap, memory used vs assigned.
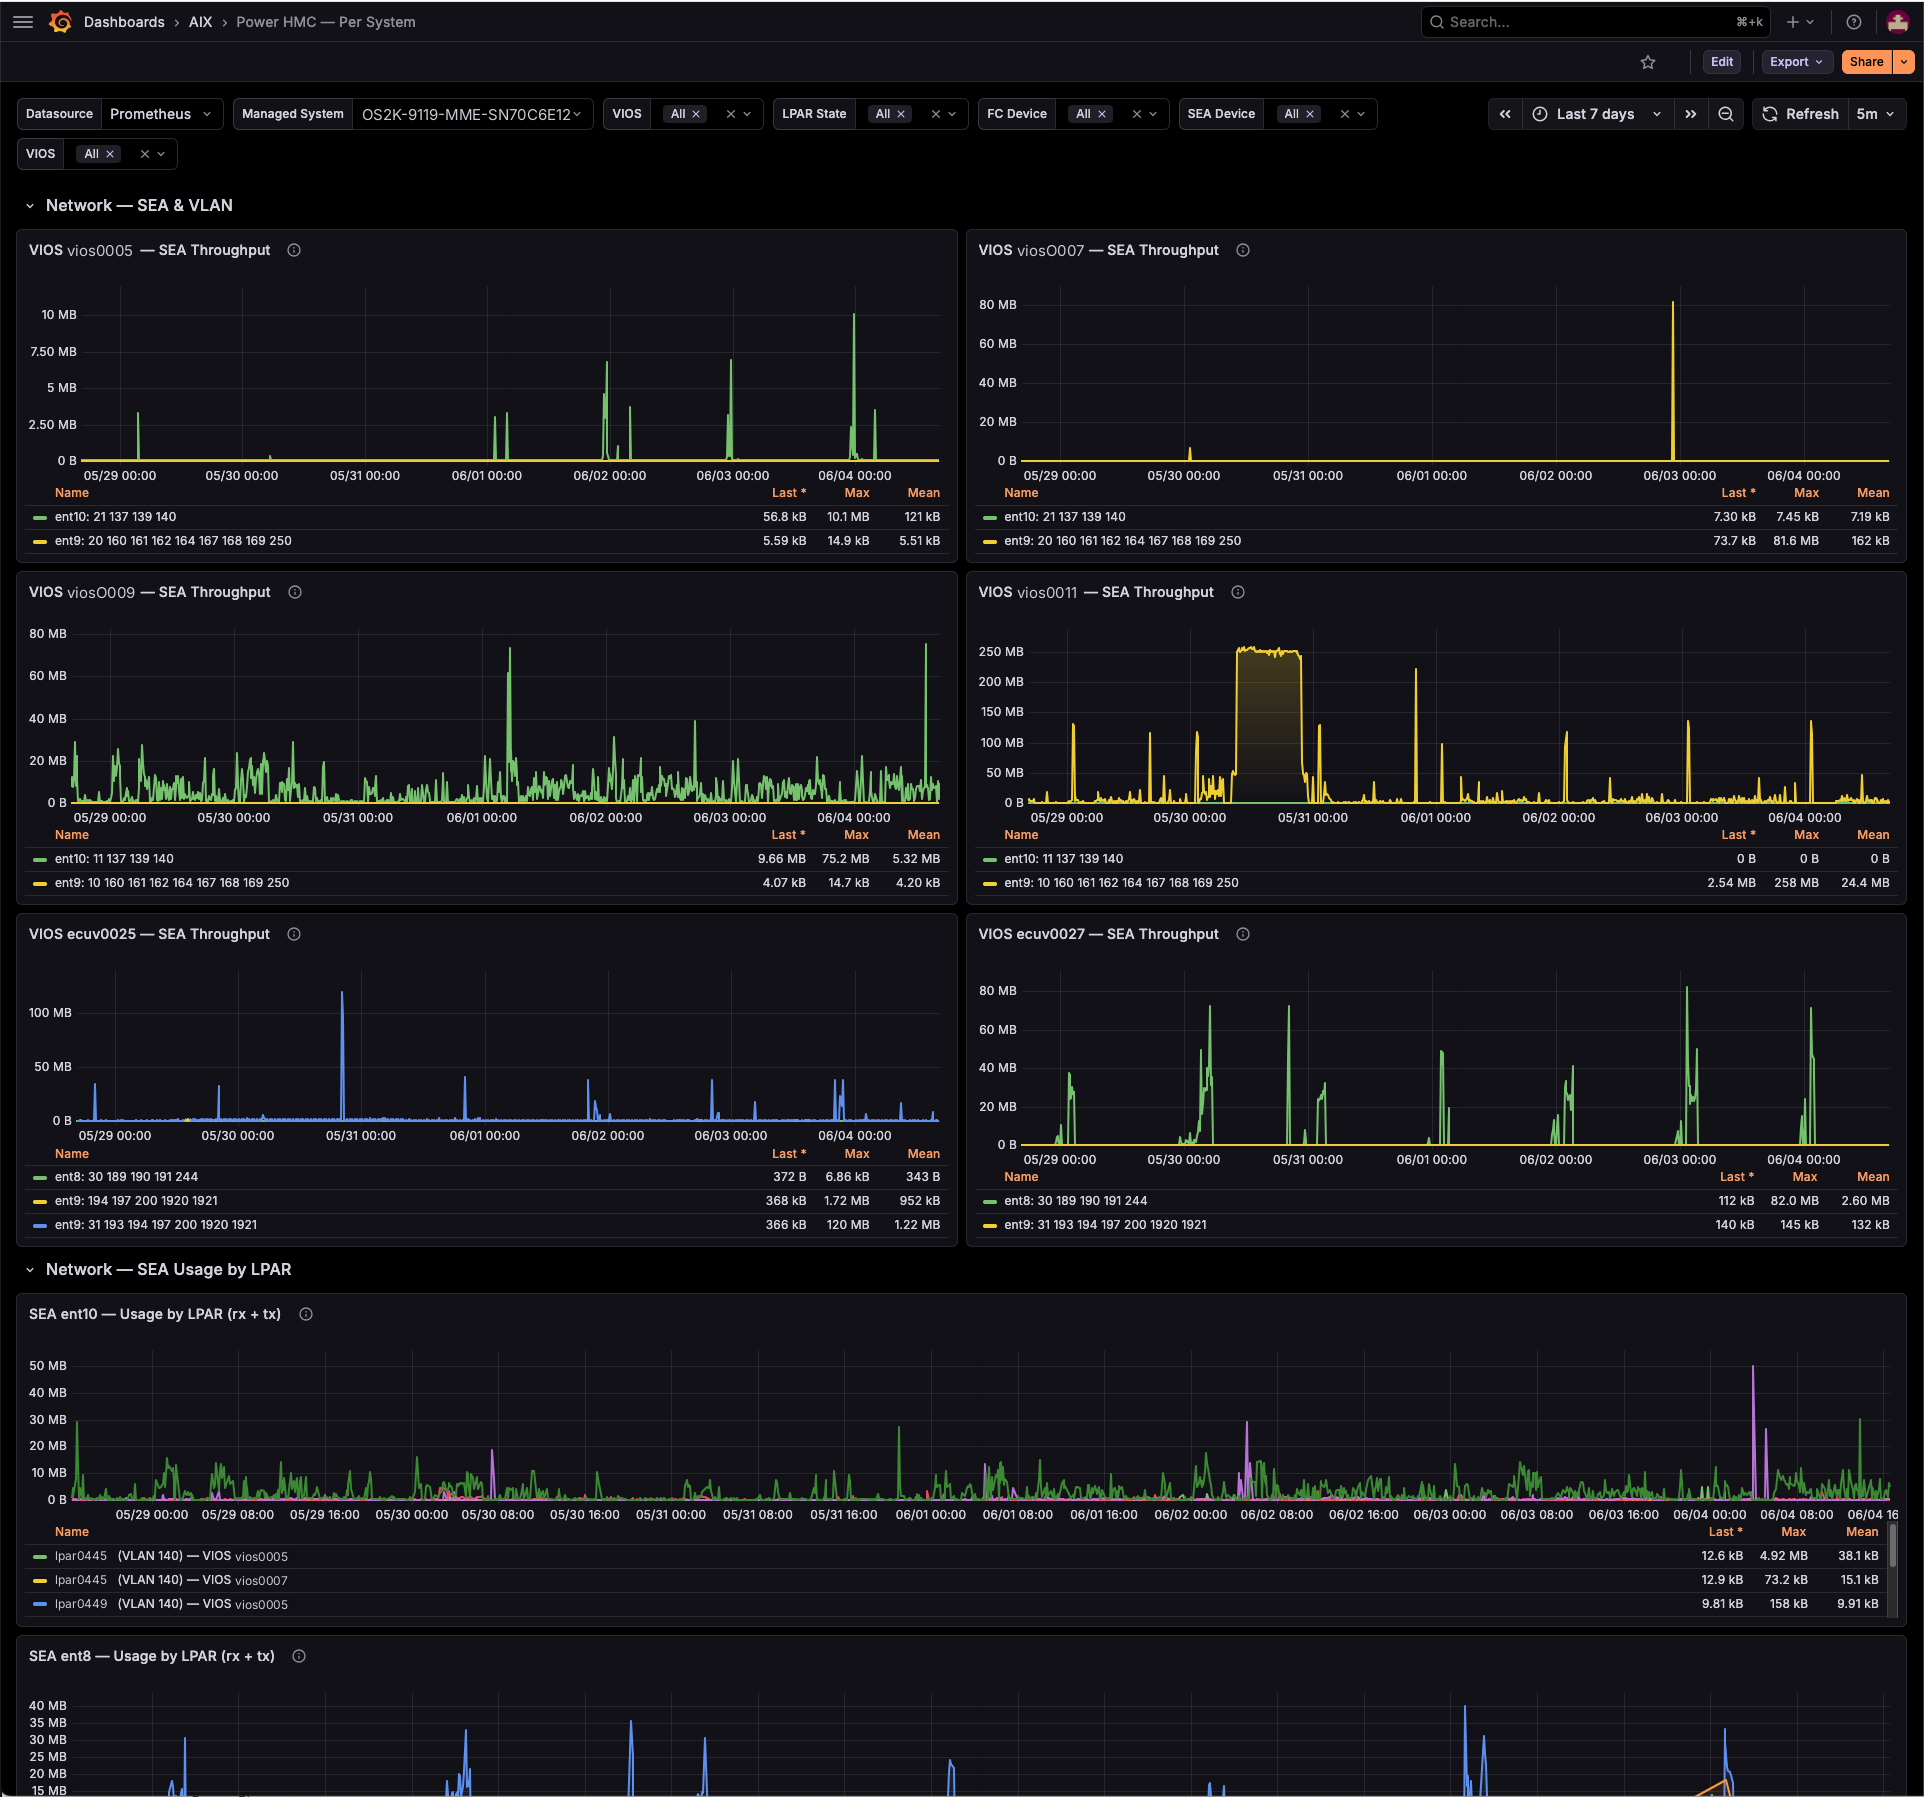
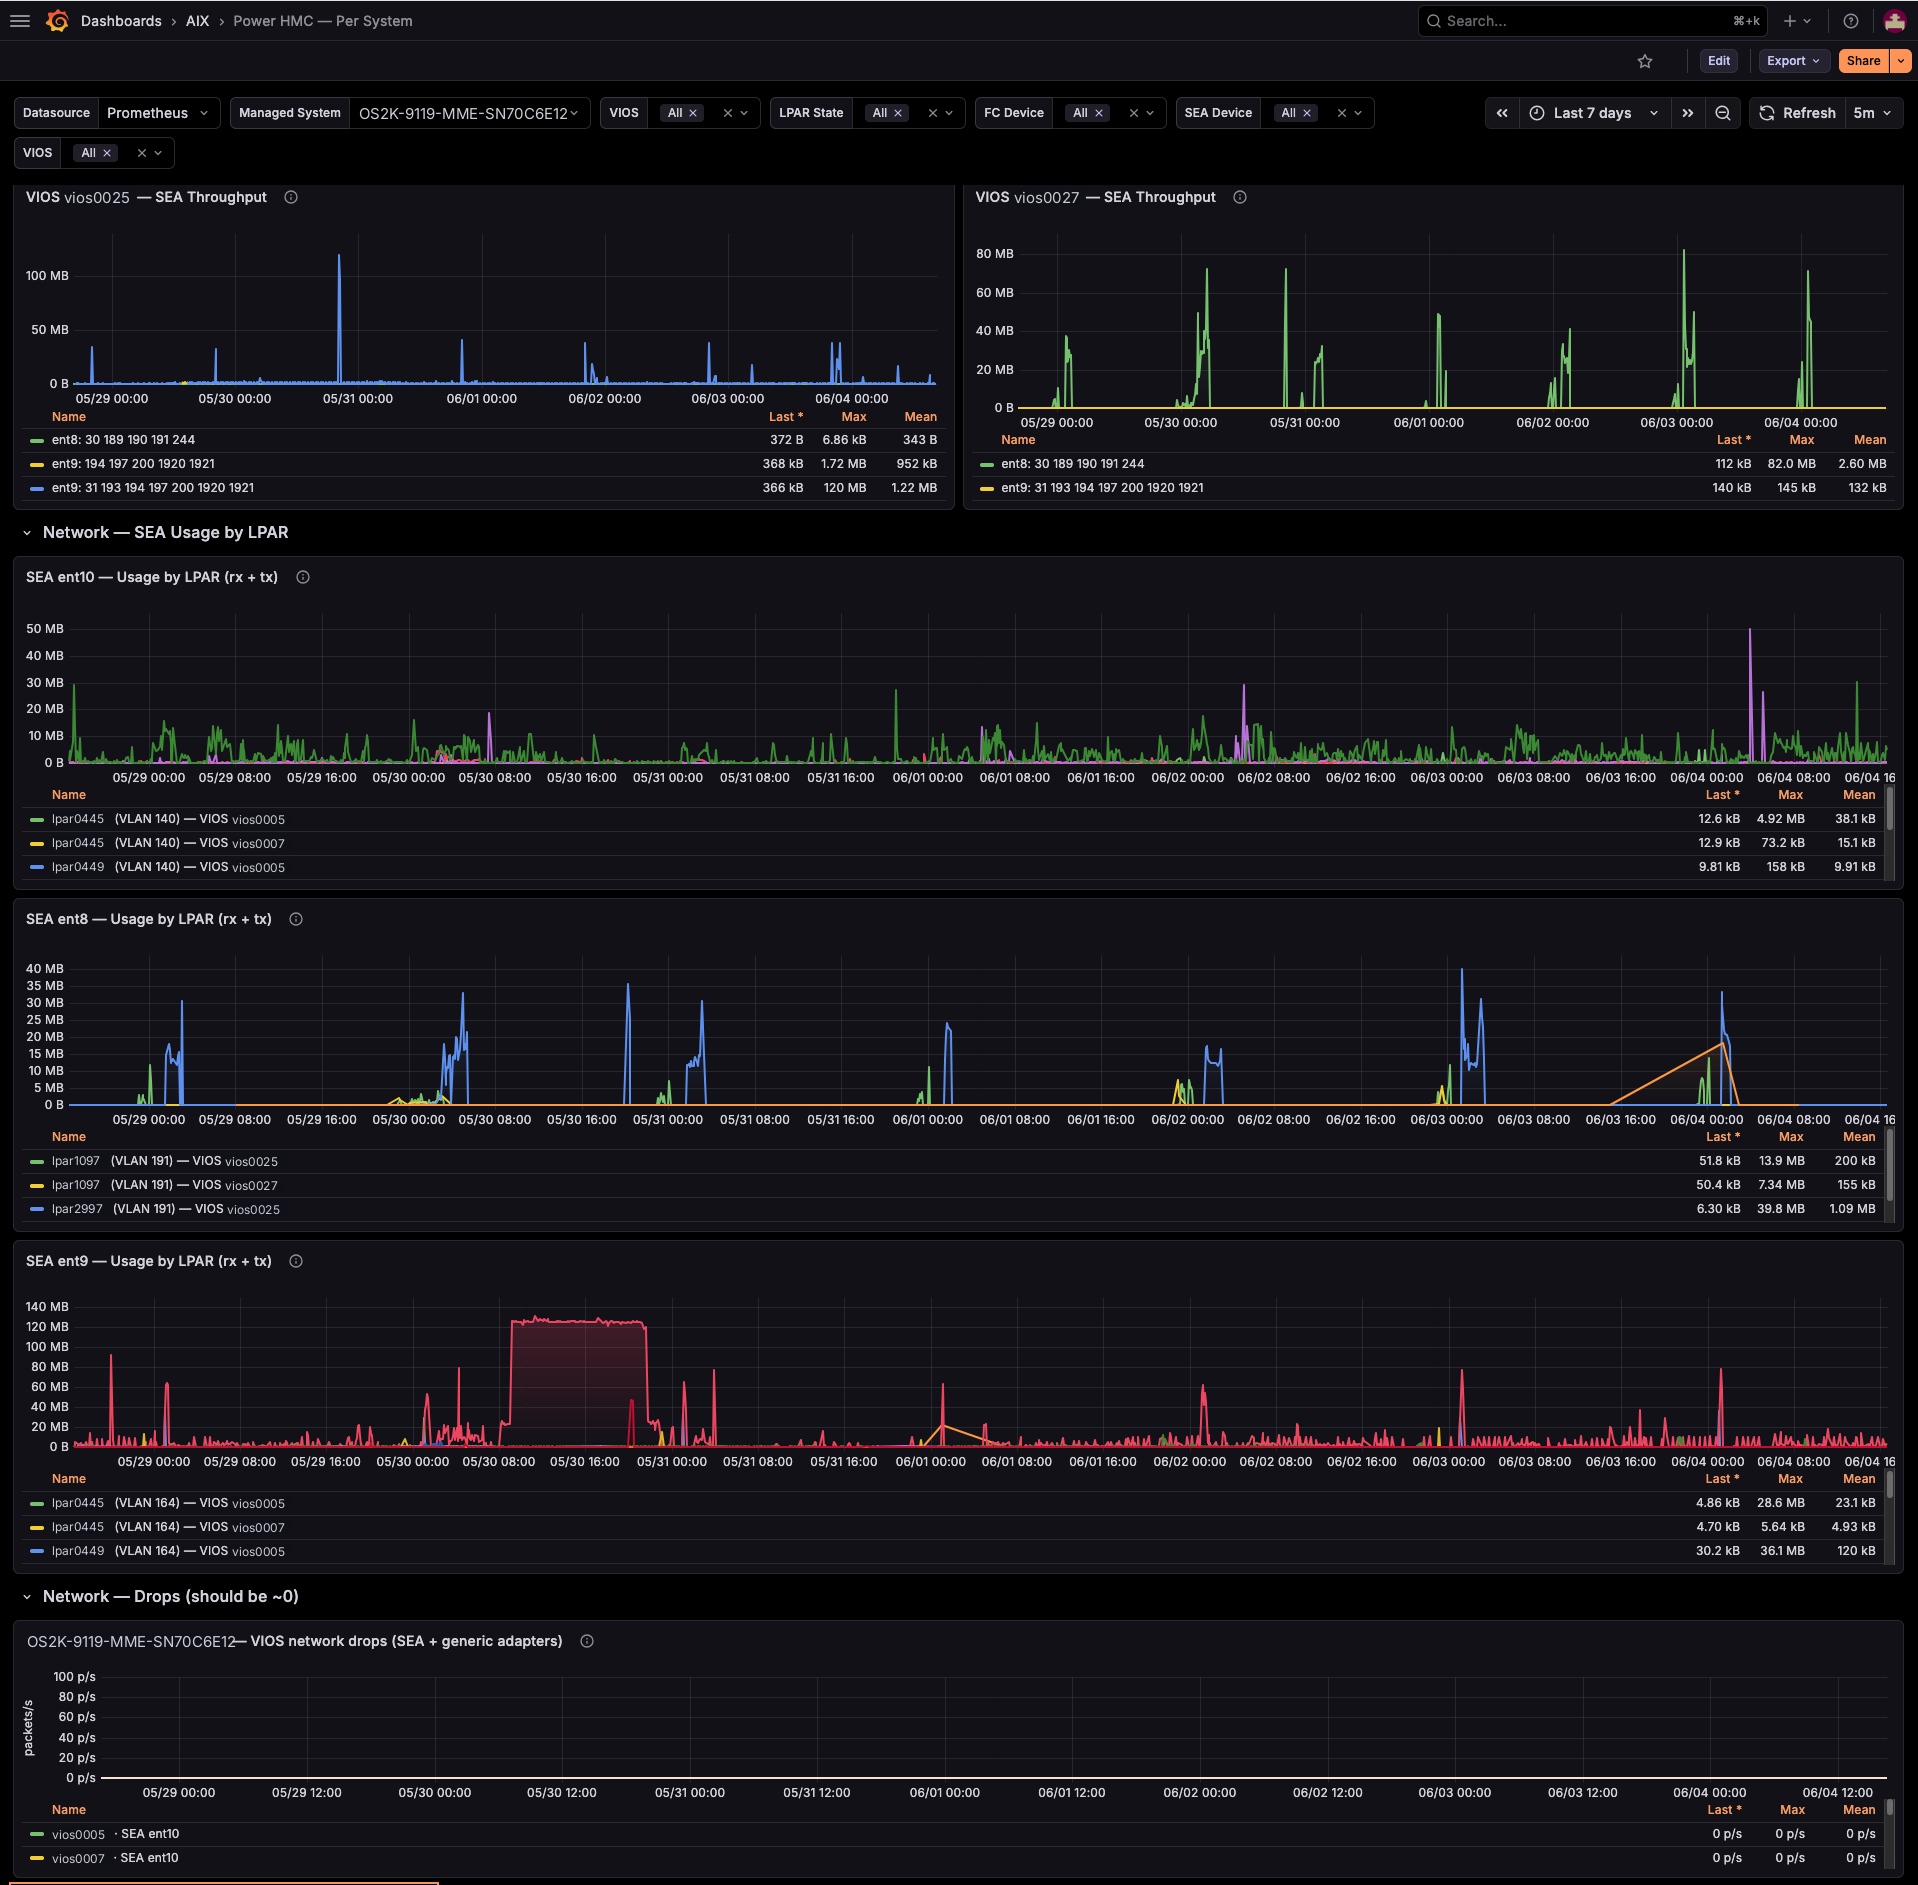
- Network (SEA) — throughput per SEA, usage by LPAR with the serving VIOS in the legend (self-correcting on failover), and a drops panel (should stay ~0).
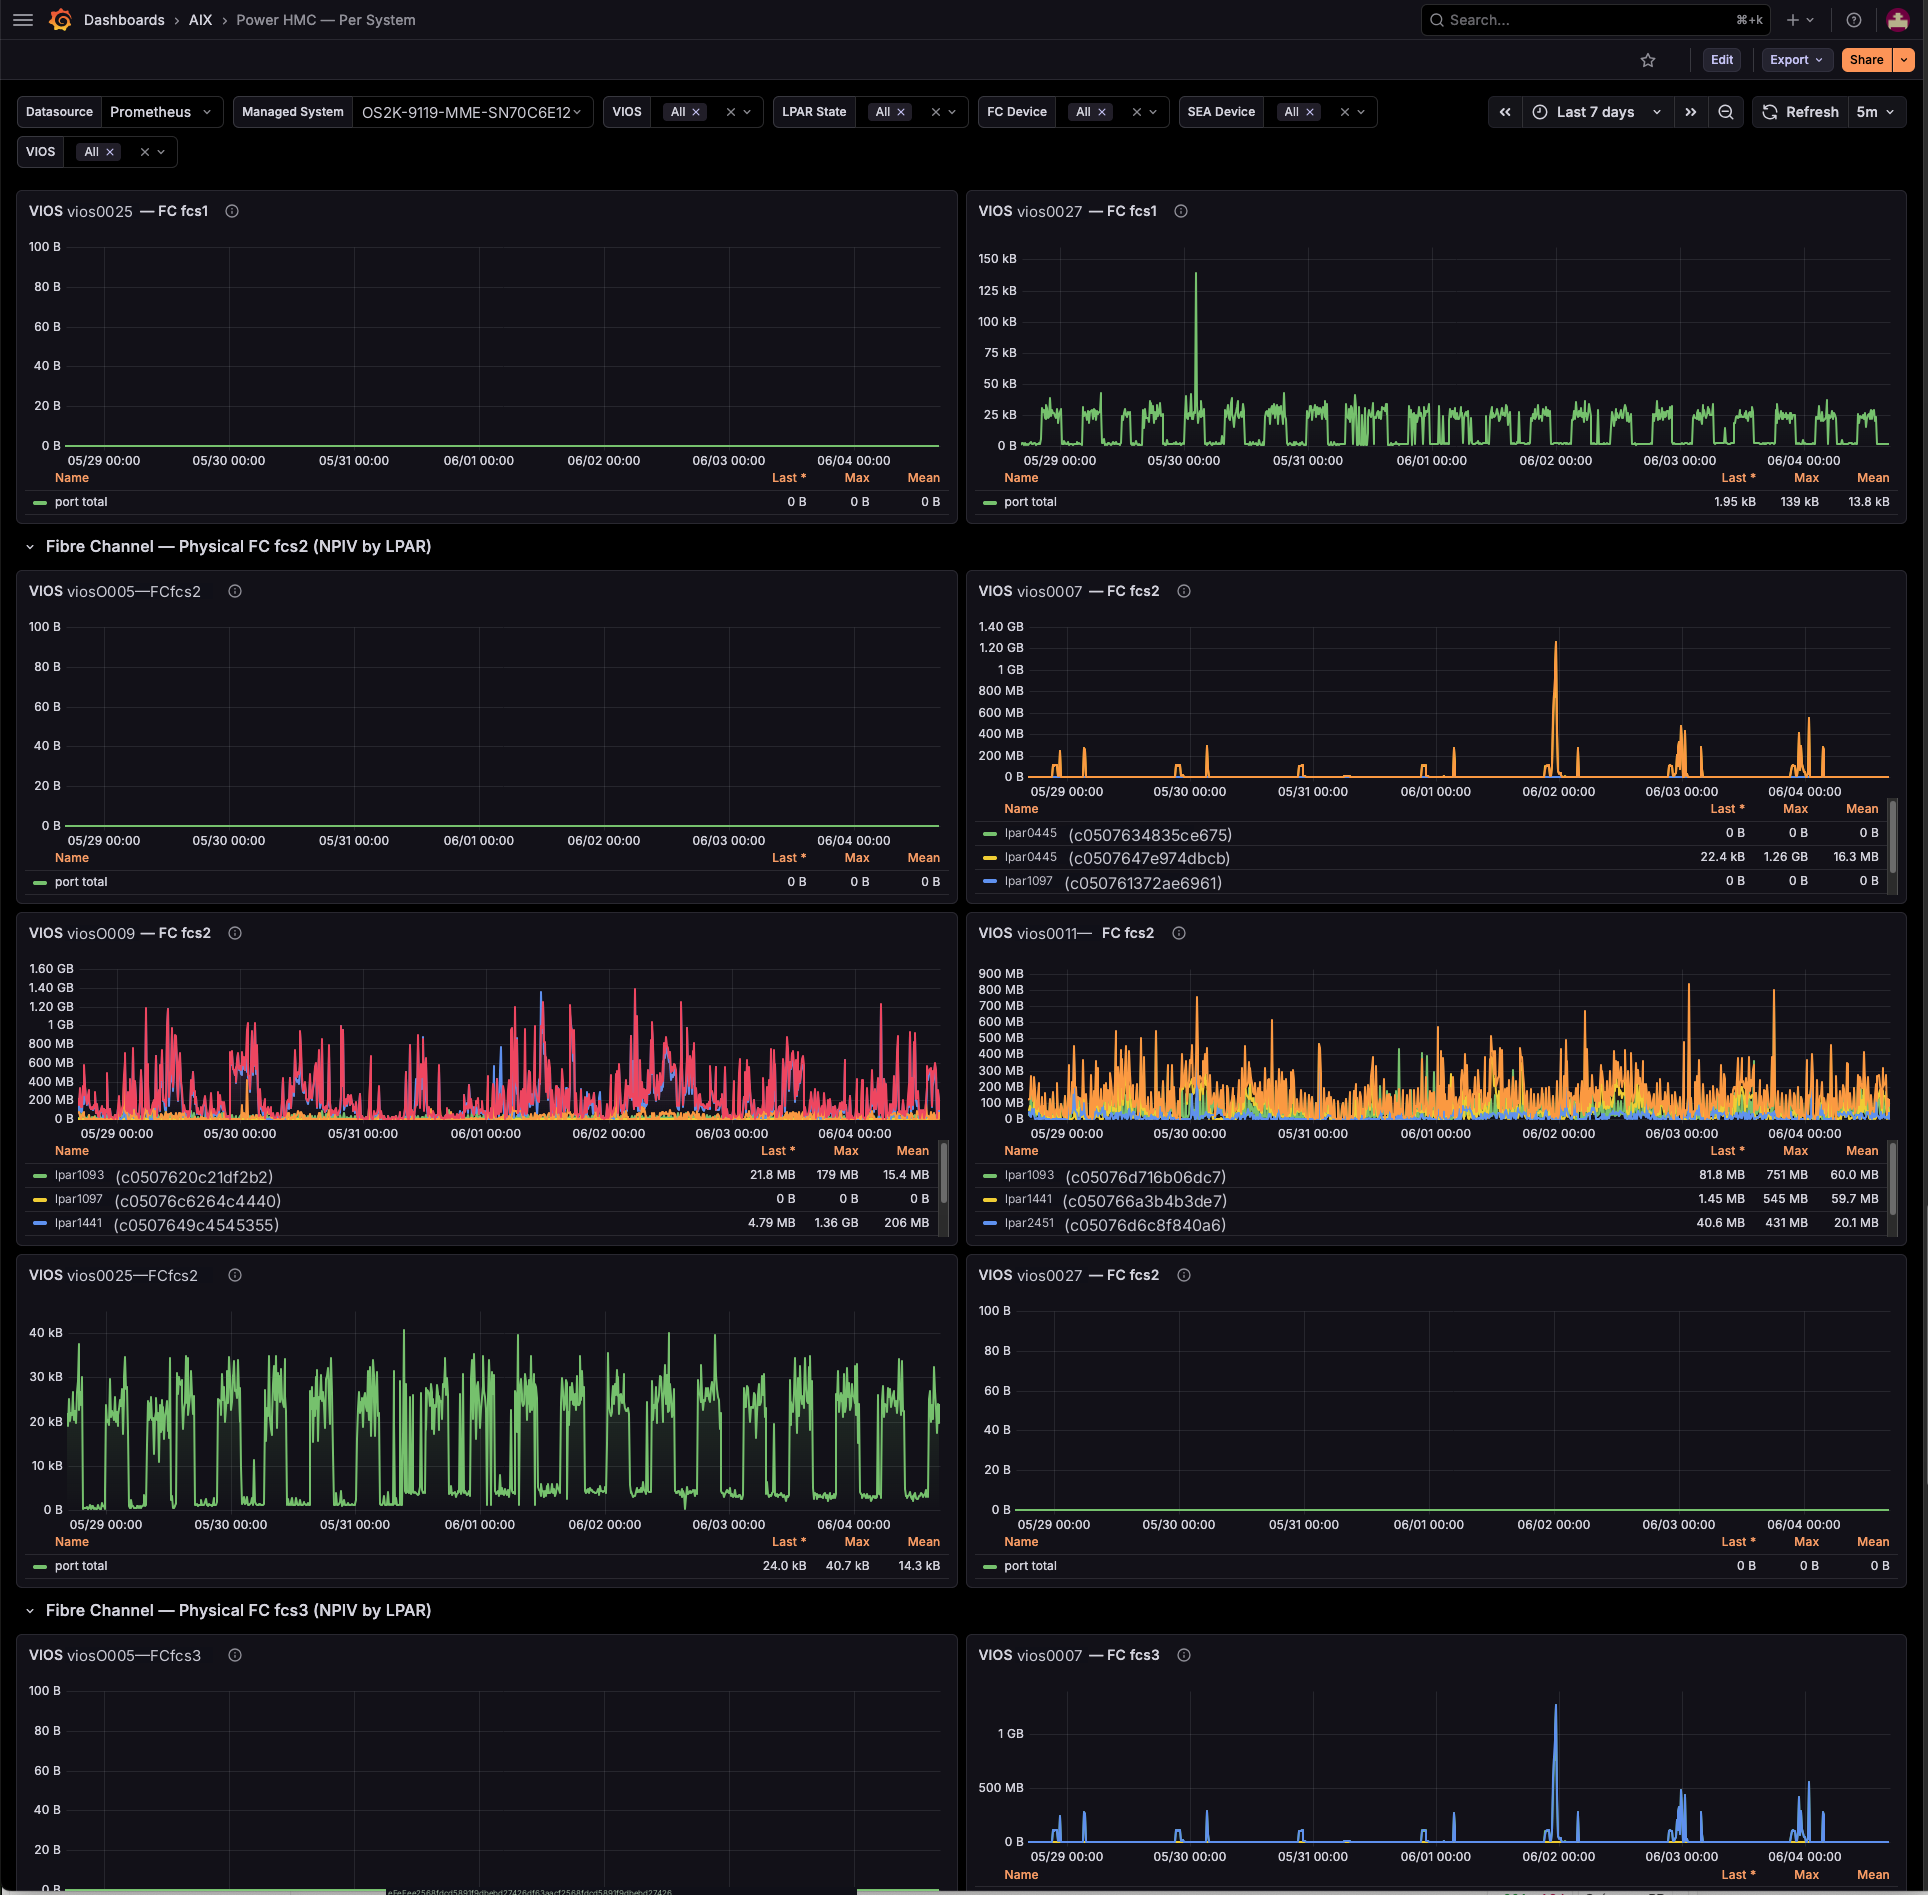
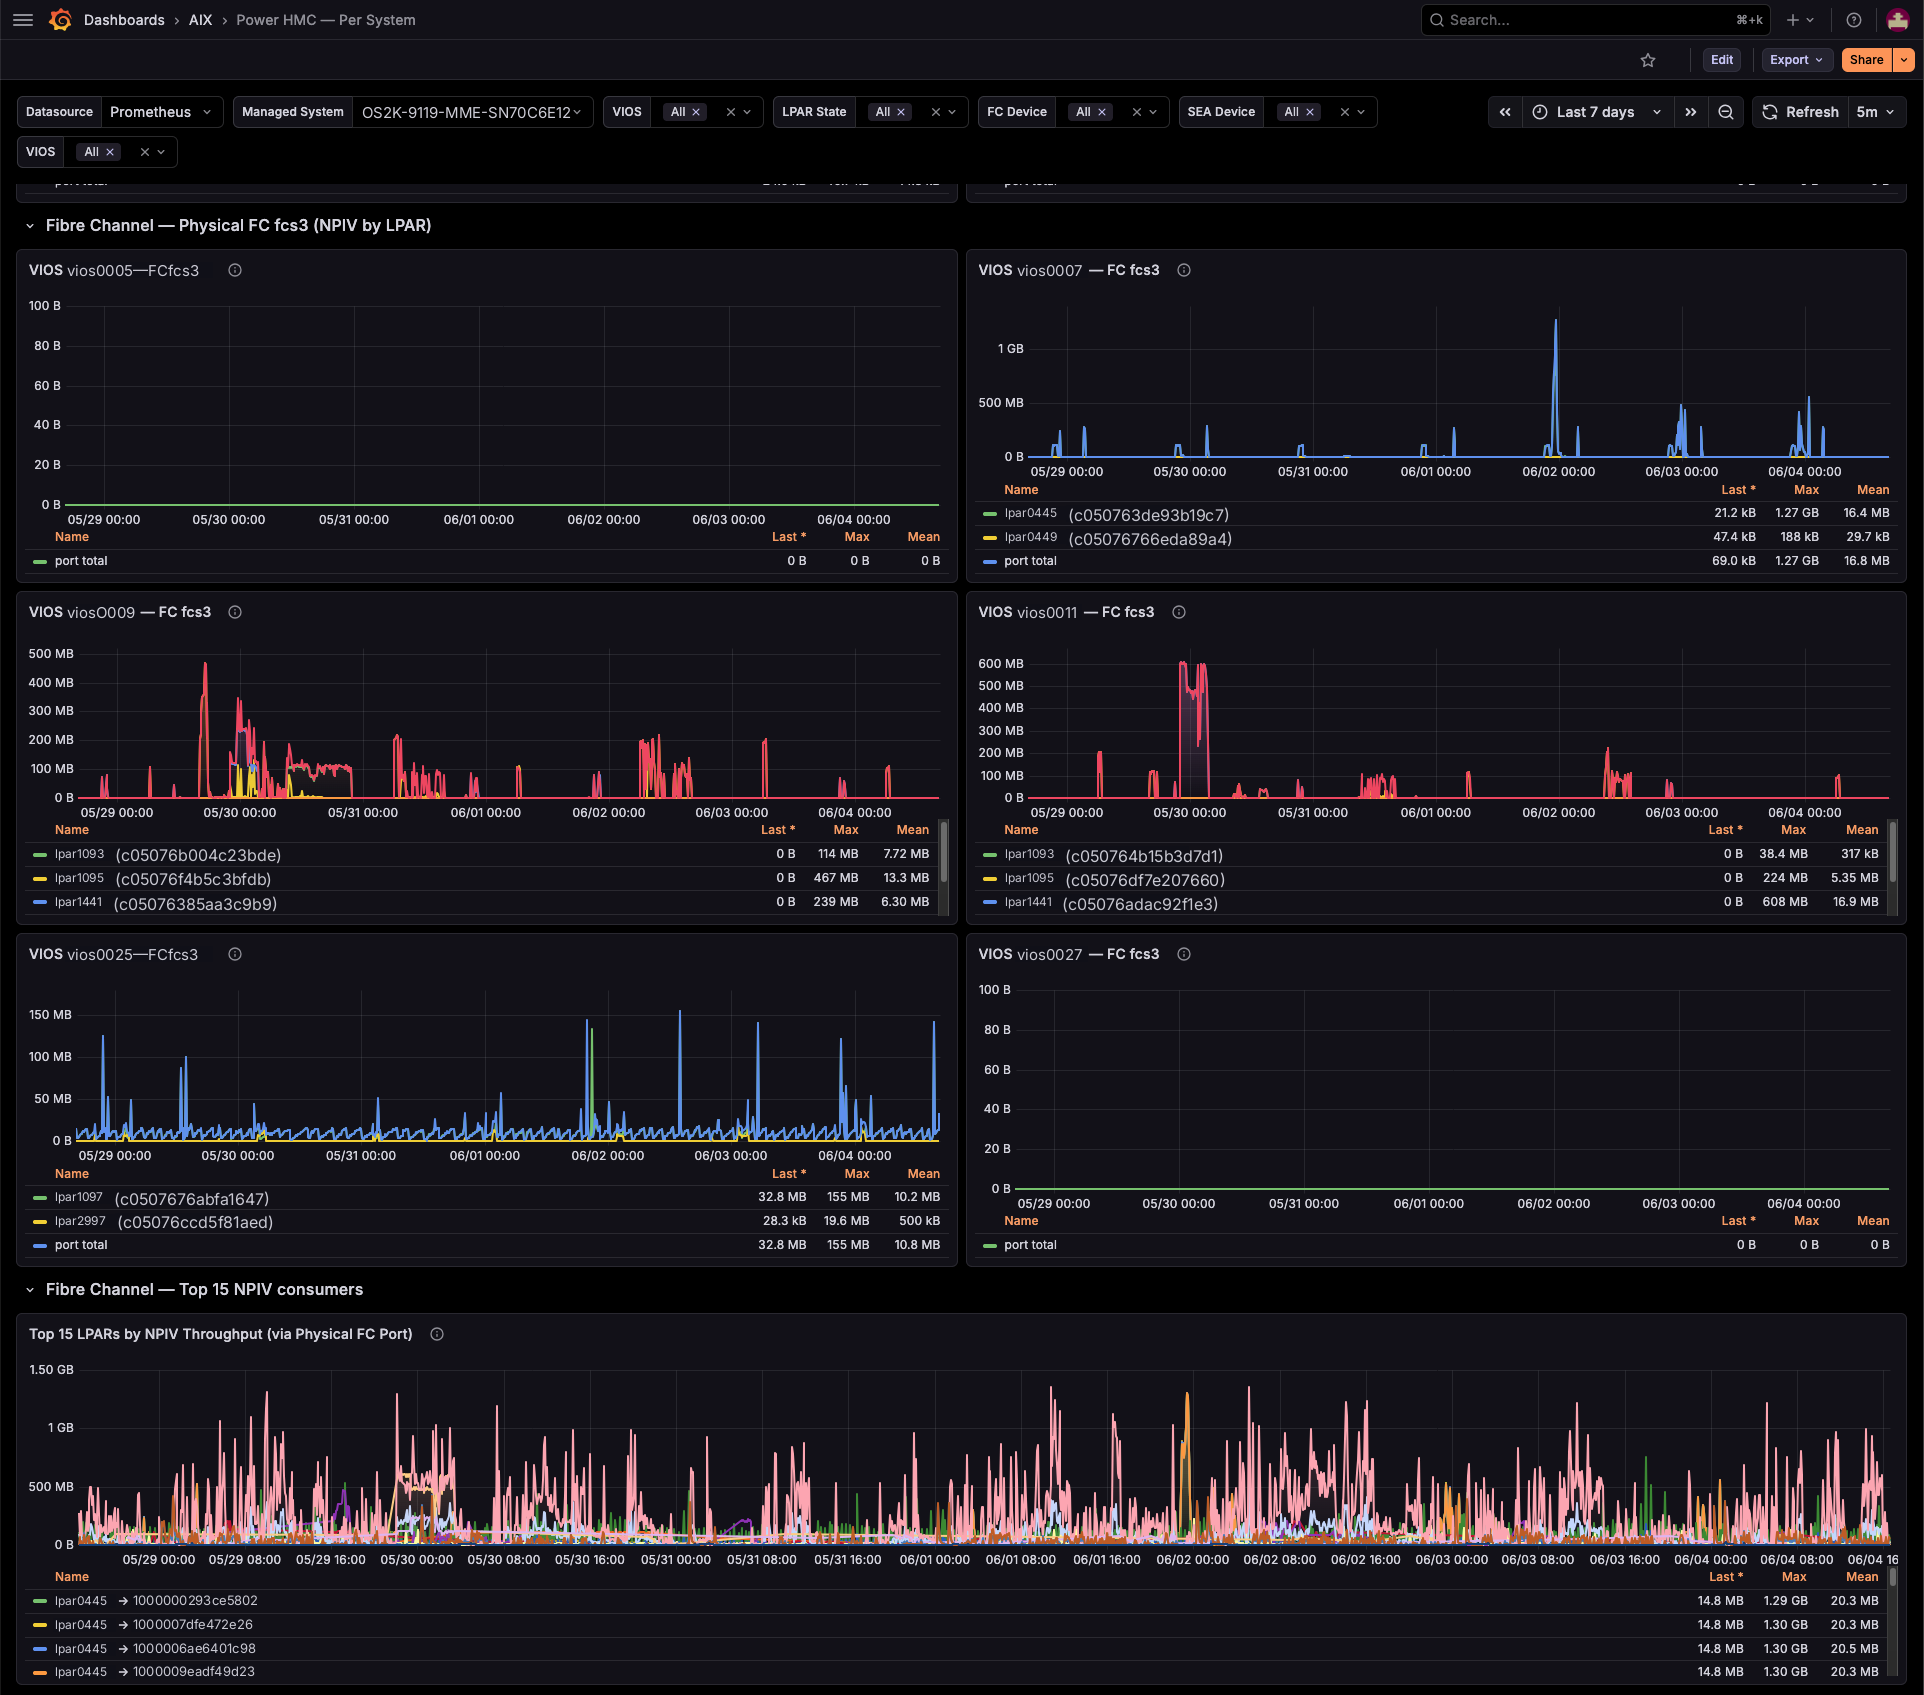
- Fibre Channel (NPIV) — per-LPAR NPIV per physical FC port with WWPN cross-reference, Top 15 consumers, and optional per-VIOS FC error panels.
- Virtual SCSI — per-vhost throughput per VIOS and total VSCSI per LPAR.
Variables
Datasource, Managed System, VIOS, LPAR State, FC Device, SEA Device.
Repeating rows fan out per VIOS / SEA / FC port.
Notes
- Throughput uses
read_bytes + write_bytes(HMC reports NPIVtransmittedBytesas 0). - Powered-off systems return no PCM sample — surfaced via Sample Age, not as an error.
Get the exporter
This dashboard is free. To feed it, run power-hmc-exporter against your HMC — agentless, polls the HMC REST API and PCM, nothing installed on the partitions. → Start the free trial · Product details
Data source config
Collector config:
Upload an updated version of an exported dashboard.json file from Grafana
| Revision | Description | Created | |
|---|---|---|---|
| Download |