
AWS / CloudWatch / S3
AWS S3 monitoring focused on a selected bucket. Compact fleet overview at the top helps you pick a bucket of interest; everything below shows storage, request activity, and latency for the selected bucket. Request and latency panels require per-bucket opt-in (Properties → Metrics → 'Bucket and request metrics').
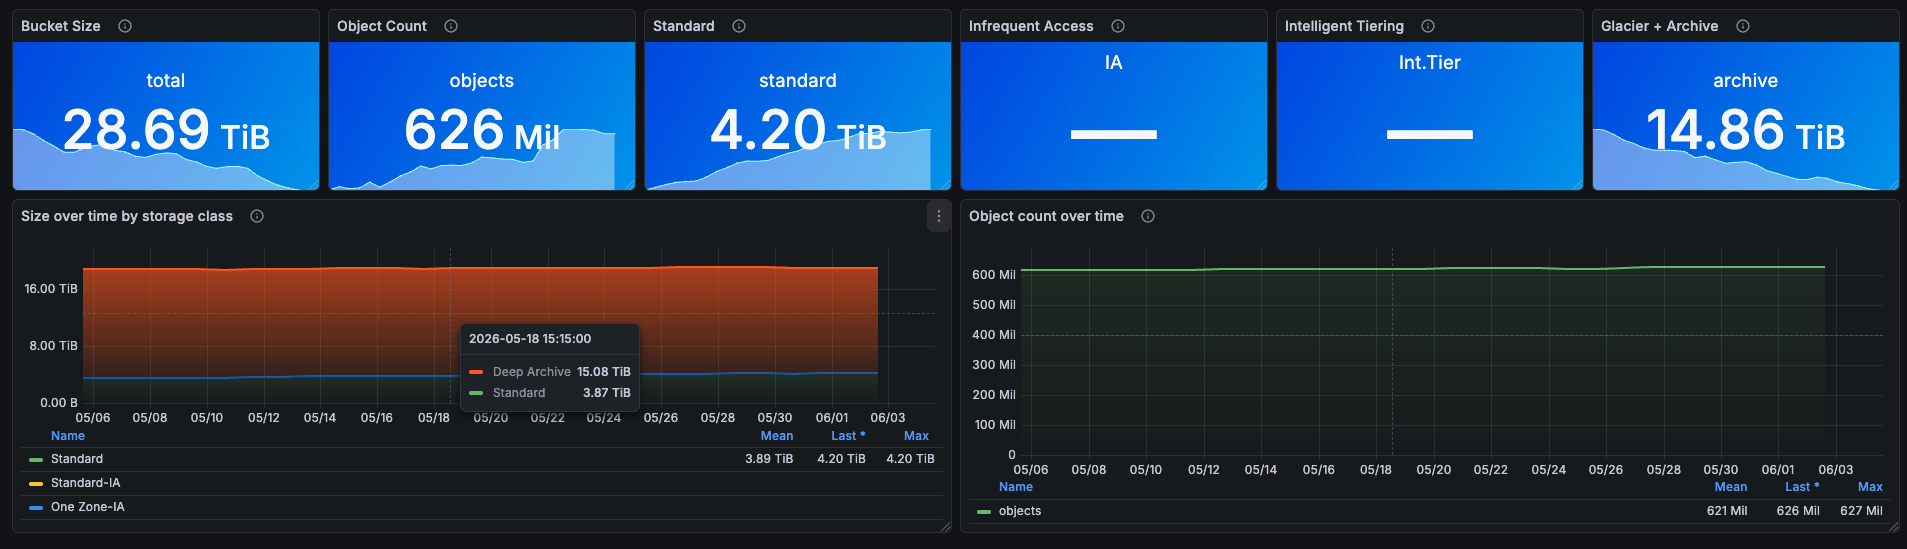
AWS S3 Monitoring Dashboard for Grafana - CloudWatch Metrics
A Grafana dashboard for monitoring AWS S3 buckets using native CloudWatch metrics. Track storage size, object count, and storage class distribution across every bucket in a region, with per-bucket drill-down for lifecycle verification and cost analysis.
Why monitor AWS S3?
S3 is usually the cheapest piece of an AWS bill - until it isn't. Without monitoring, three things creep up: buckets that should have lifecycled to Glacier never do, hot-tier Standard storage grows linearly with retention, and a single misbehaving service can write millions of small objects that explode request costs. This dashboard surfaces all three patterns visually so you can act on them before the bill arrives.
It uses the daily BucketSizeBytes and NumberOfObjects metrics that S3 publishes to CloudWatch at no extra cost. No request metrics, no server access logging, no S3 Inventory required.
Features
- Fleet overview - total storage across all buckets, total object count, and bucket count per region
- Top 10 buckets by size - quickly identify the largest buckets that are driving cost
- Account-wide storage by class - stacked timeseries of Standard, Standard-IA, One Zone-IA, Intelligent Tiering (Frequent/Infrequent/Archive/Deep Archive Access), Glacier Instant Retrieval, Glacier Flexible Retrieval, and Deep Archive
- Per-bucket drill-down - total size, object count, and breakdown by storage class for a single bucket
- Storage class trends over time - verify that lifecycle policies are actually moving data to cheaper tiers
- Object count trend - spot runaway small-object growth before it hits request quotas
Key CloudWatch Metrics Used
All metrics are from the AWS/S3 namespace and the AWS/Usage namespace for the bucket count.
BucketSizeBytes
Reported daily per BucketName and StorageType combination. The dashboard sums across types for total bucket size and splits by type for the storage-class breakdown. Reporting lag is up to 24 hours.
NumberOfObjects
Reported daily per bucket, with StorageType=AllStorageTypes. Useful for spotting buckets accumulating millions of tiny objects, which drives request cost and complicates lifecycle.
ResourceCount (AWS/Usage)
Used to count general-purpose buckets in the region. Doesn't include directory buckets (S3 Express One Zone).
Storage Classes Supported
Standard, Standard-IA, One Zone-IA, Intelligent Tiering (all four access tiers), Glacier Instant Retrieval, Glacier Flexible Retrieval, and Glacier Deep Archive. If you add new storage classes in the future, they appear as separate StorageType dimension values in CloudWatch and need a new panel - but the existing eight cover ~99% of real-world usage.
Prerequisites
- Grafana 10.0 or later (tested on 12.x)
- AWS CloudWatch datasource plugin configured in Grafana
- IAM permissions on the role/user backing the datasource:
cloudwatch:GetMetricDatacloudwatch:ListMetricscloudwatch:GetMetricStatistics
No S3-specific permissions are required since all data comes through CloudWatch.
Installation
- Download the dashboard JSON.
- In Grafana, go to Dashboards → New → Import.
- Paste the JSON or upload the file.
- When prompted, select your AWS CloudWatch datasource.
- Click Import.
Variables
- Region - AWS region to query (defaults to
us-east-1; change to where your buckets live) - Bucket - auto-populated from CloudWatch with every bucket that has
BucketSizeBytesdata in the selected region
Tips
- Set the dashboard time range to at least 24 hours - S3 storage metrics are daily, so shorter ranges show no data
- Use the "Top 10 buckets by size" panel to pick a bucket to drill into via the variable
- The stacked storage class panel is the fastest way to verify a new lifecycle policy is actually moving objects between tiers
Troubleshooting
Q: All panels show "No data". What's wrong? A: The time range is probably too short. S3 storage metrics report once per day. Set the range to at least 24h, ideally 30 days.
Q: A bucket doesn't appear in the dropdown.
A: The bucket has never published BucketSizeBytes - usually because it's brand new (wait 24h) or empty.
Q: The "Buckets" count seems wrong.
A: It uses AWS/Usage::ResourceCount for general-purpose buckets, which excludes S3 Express One Zone directory buckets. If you use both, the count is lower than your console total.
Q: Can I add request metrics (GET, PUT counts) and latency? A: Yes, but those require per-bucket opt-in (Properties → Metrics → "Bucket and request metrics") and incur additional CloudWatch costs. They aren't in this dashboard by default.
Related AWS Documentation
Tags
aws s3 storage cloudwatch monitoring bucket aws-monitoring aws-s3 s3-bucket cloud-storage cost-optimization lifecycle grafana-dashboard
Data source config
Collector config:
Upload an updated version of an exported dashboard.json file from Grafana
| Revision | Description | Created | |
|---|---|---|---|
| Download |

AWS

Easily visualize and alert on more than 60 Amazon Web Services (AWS) resources using the fully managed Grafana Cloud platform.
Learn more