Klag - Kafka Lag Monitoring
Comprehensive Kafka consumer lag and health monitoring for Klag (https://github.com/themoah/klag). Lag, velocity, hot partitions, time-based lag, data-loss-prevention and JVM runtime metrics. Requires a Prometheus-compatible data source.
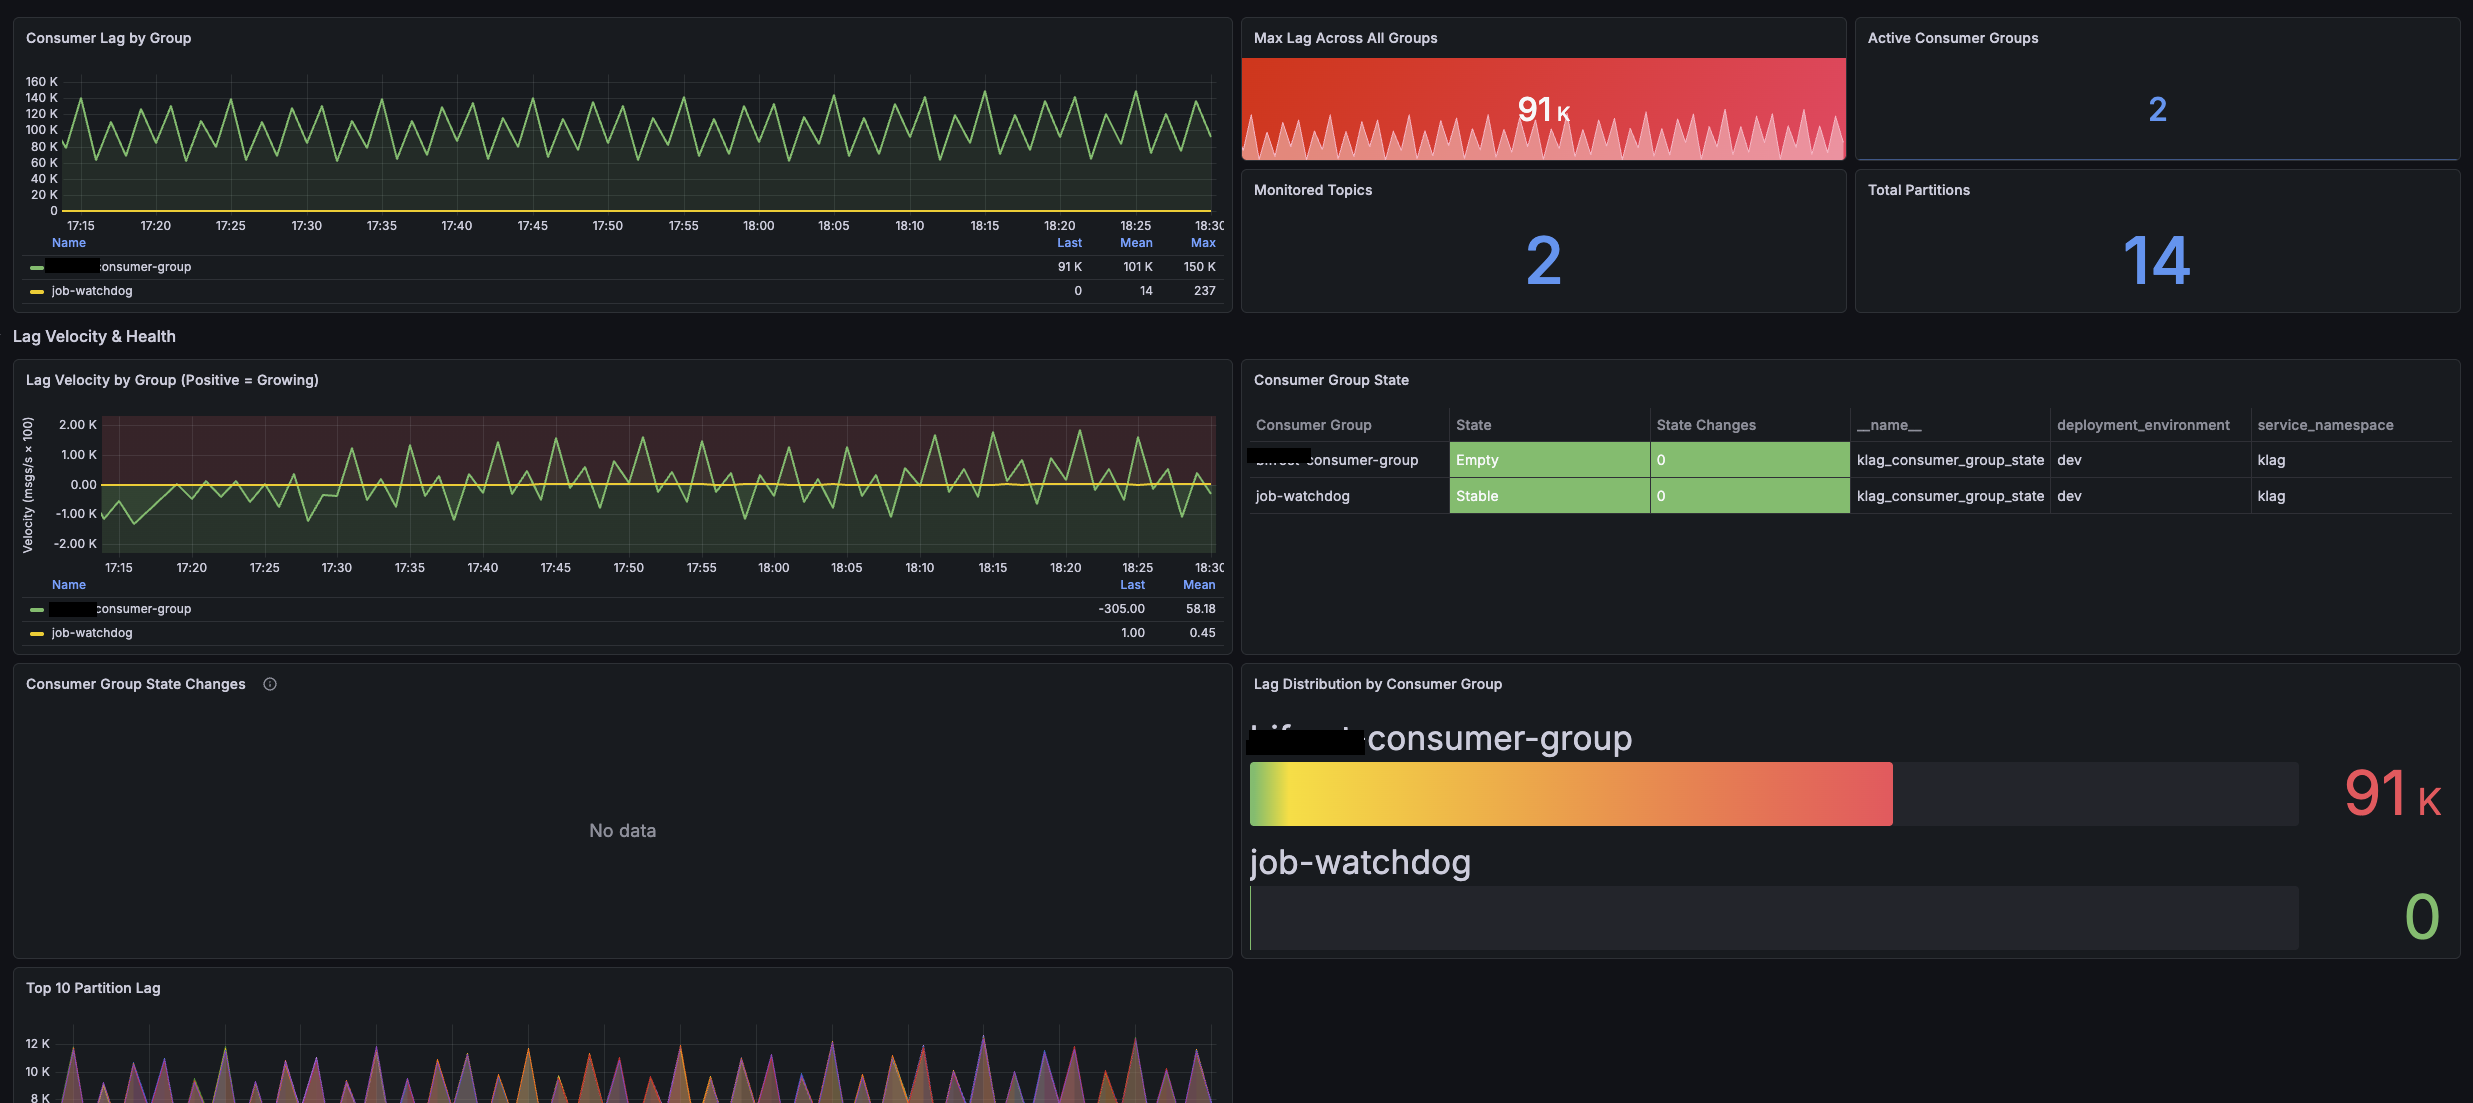
The Klag - Kafka Lag Monitoring dashboard uses the prometheus data source to create a Grafana dashboard with the barchart, bargauge, stat, table and timeseries panels.
Data source config
Collector type:
Collector plugins:
Collector config:
Revisions
Upload an updated version of an exported dashboard.json file from Grafana
| Revision | Description | Created | |
|---|---|---|---|
| Download |
Kafka
Easily monitor your Kafka deployment with Grafana Cloud's out-of-the-box monitoring solution.
Learn more