Spring Boot Observability
Unified observability dashboard for Spring Boot services — Logs (Loki), RED metrics + JVM/HikariCP stats (Prometheus/Micrometer), distributed traces and service mesh (Tempo). Requires Prometheus, Loki and Tempo datasources.
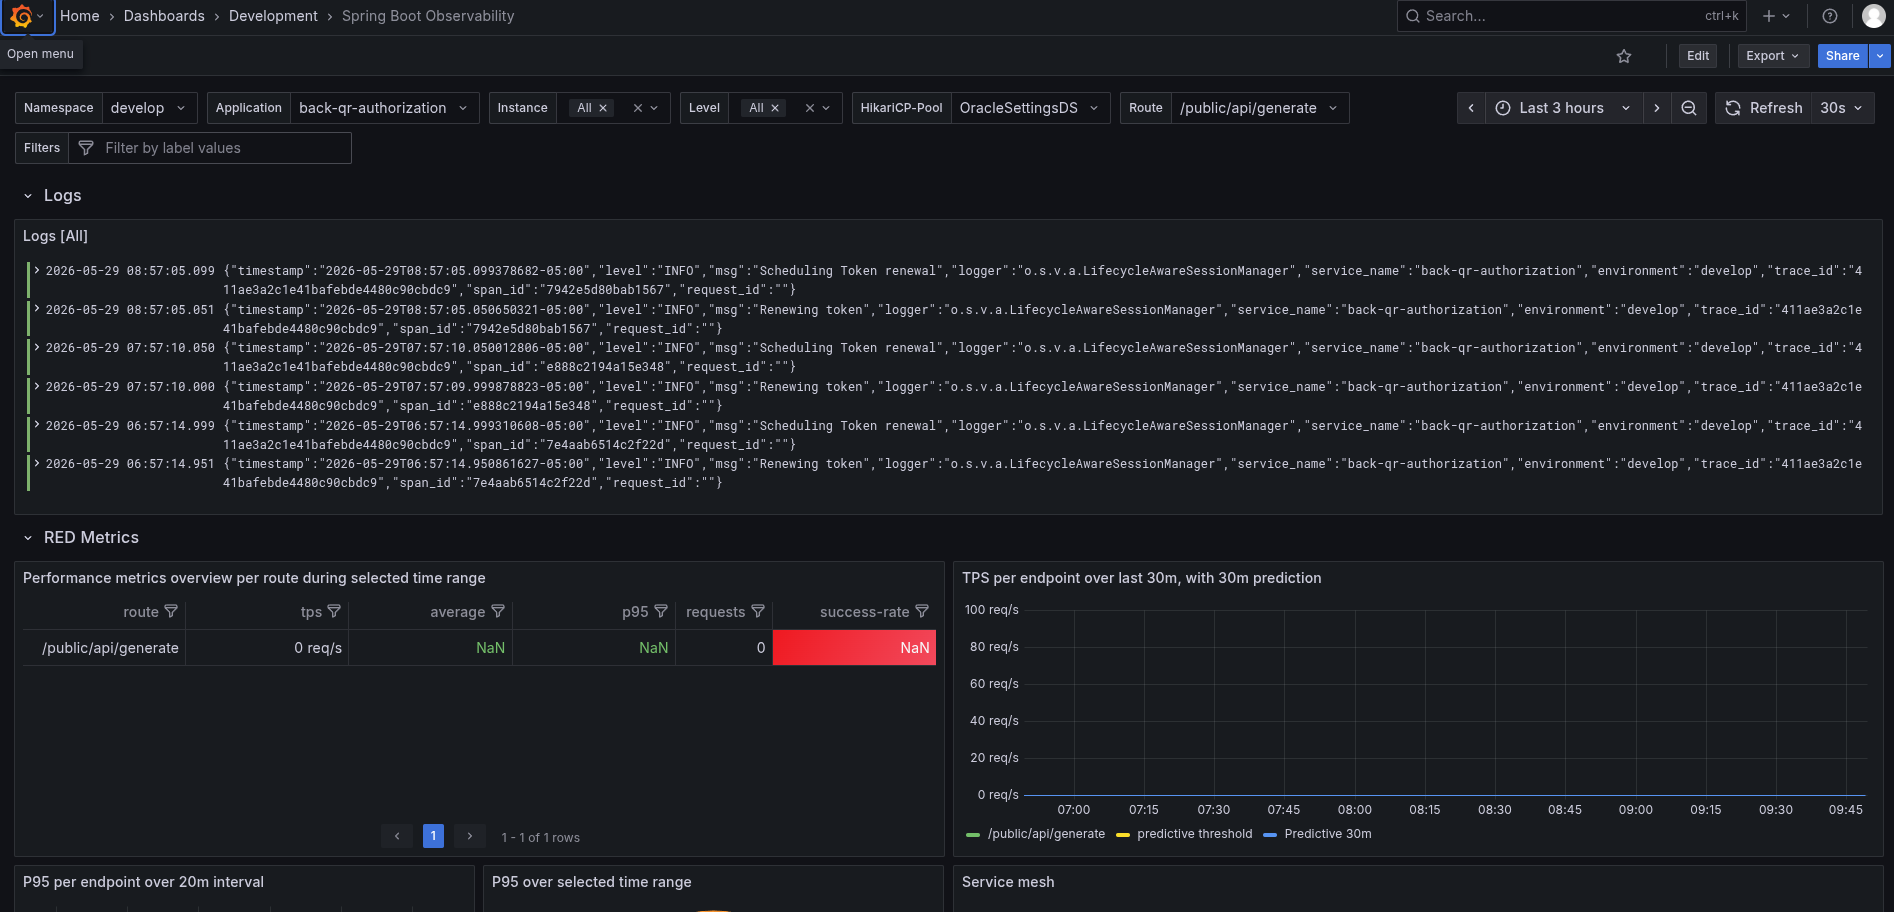
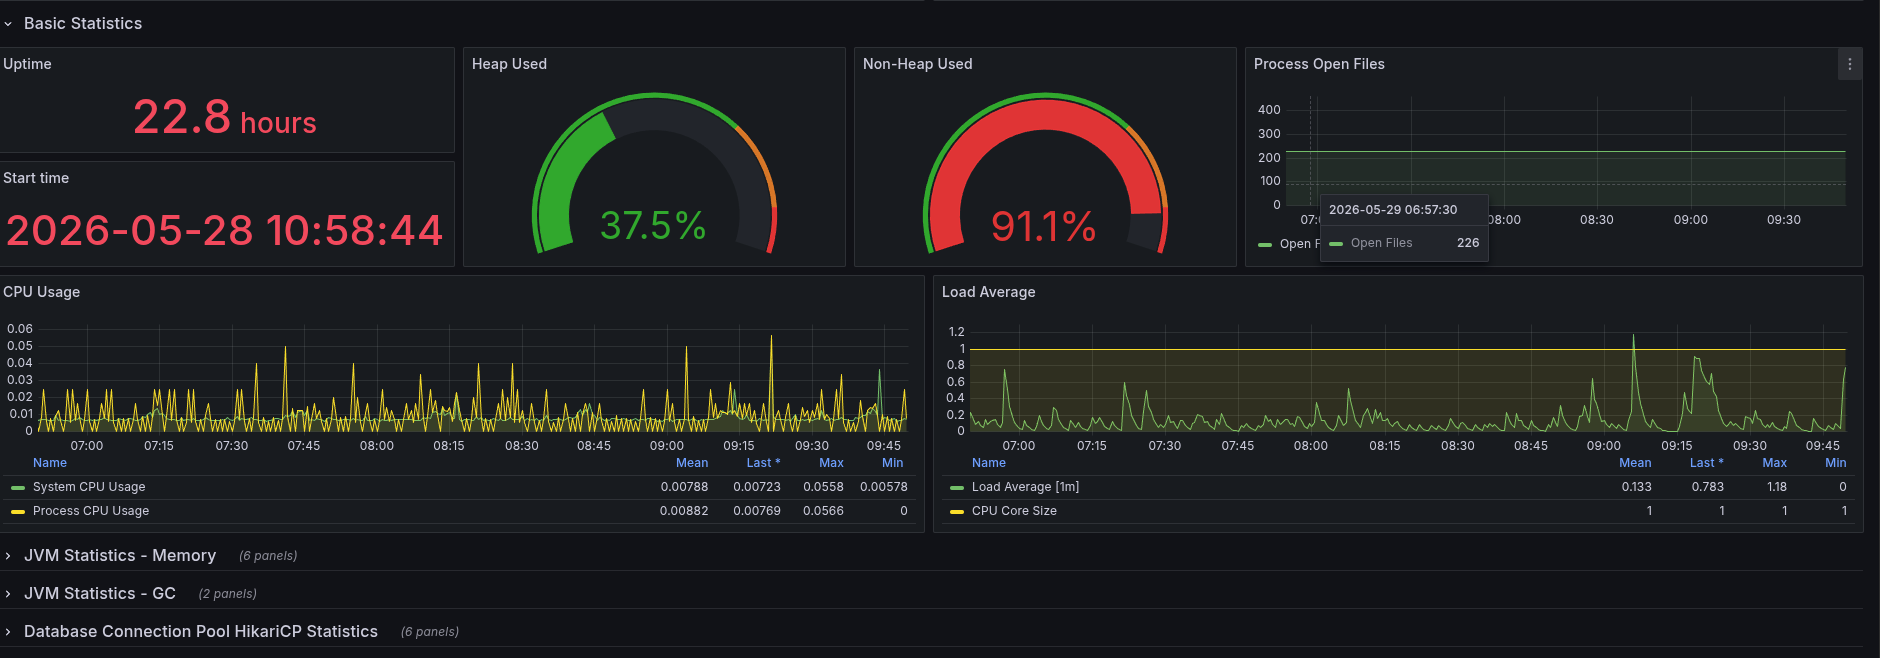
The Spring Boot Observability dashboard uses the loki, prometheus and tempo data sources to create a Grafana dashboard with the bargauge, gauge, logs, nodeGraph, stat, table and timeseries panels.
Data source config
Collector type:
Collector plugins:
Collector config:
Revisions
Upload an updated version of an exported dashboard.json file from Grafana
| Revision | Description | Created | |
|---|---|---|---|
| Download |
Spring Boot
Easily monitor Spring Boot with Grafana Cloud's out-of-the-box monitoring solution.
Learn more