Eero Mesh Network
Comprehensive monitoring for Eero mesh networks via Prometheus exporter
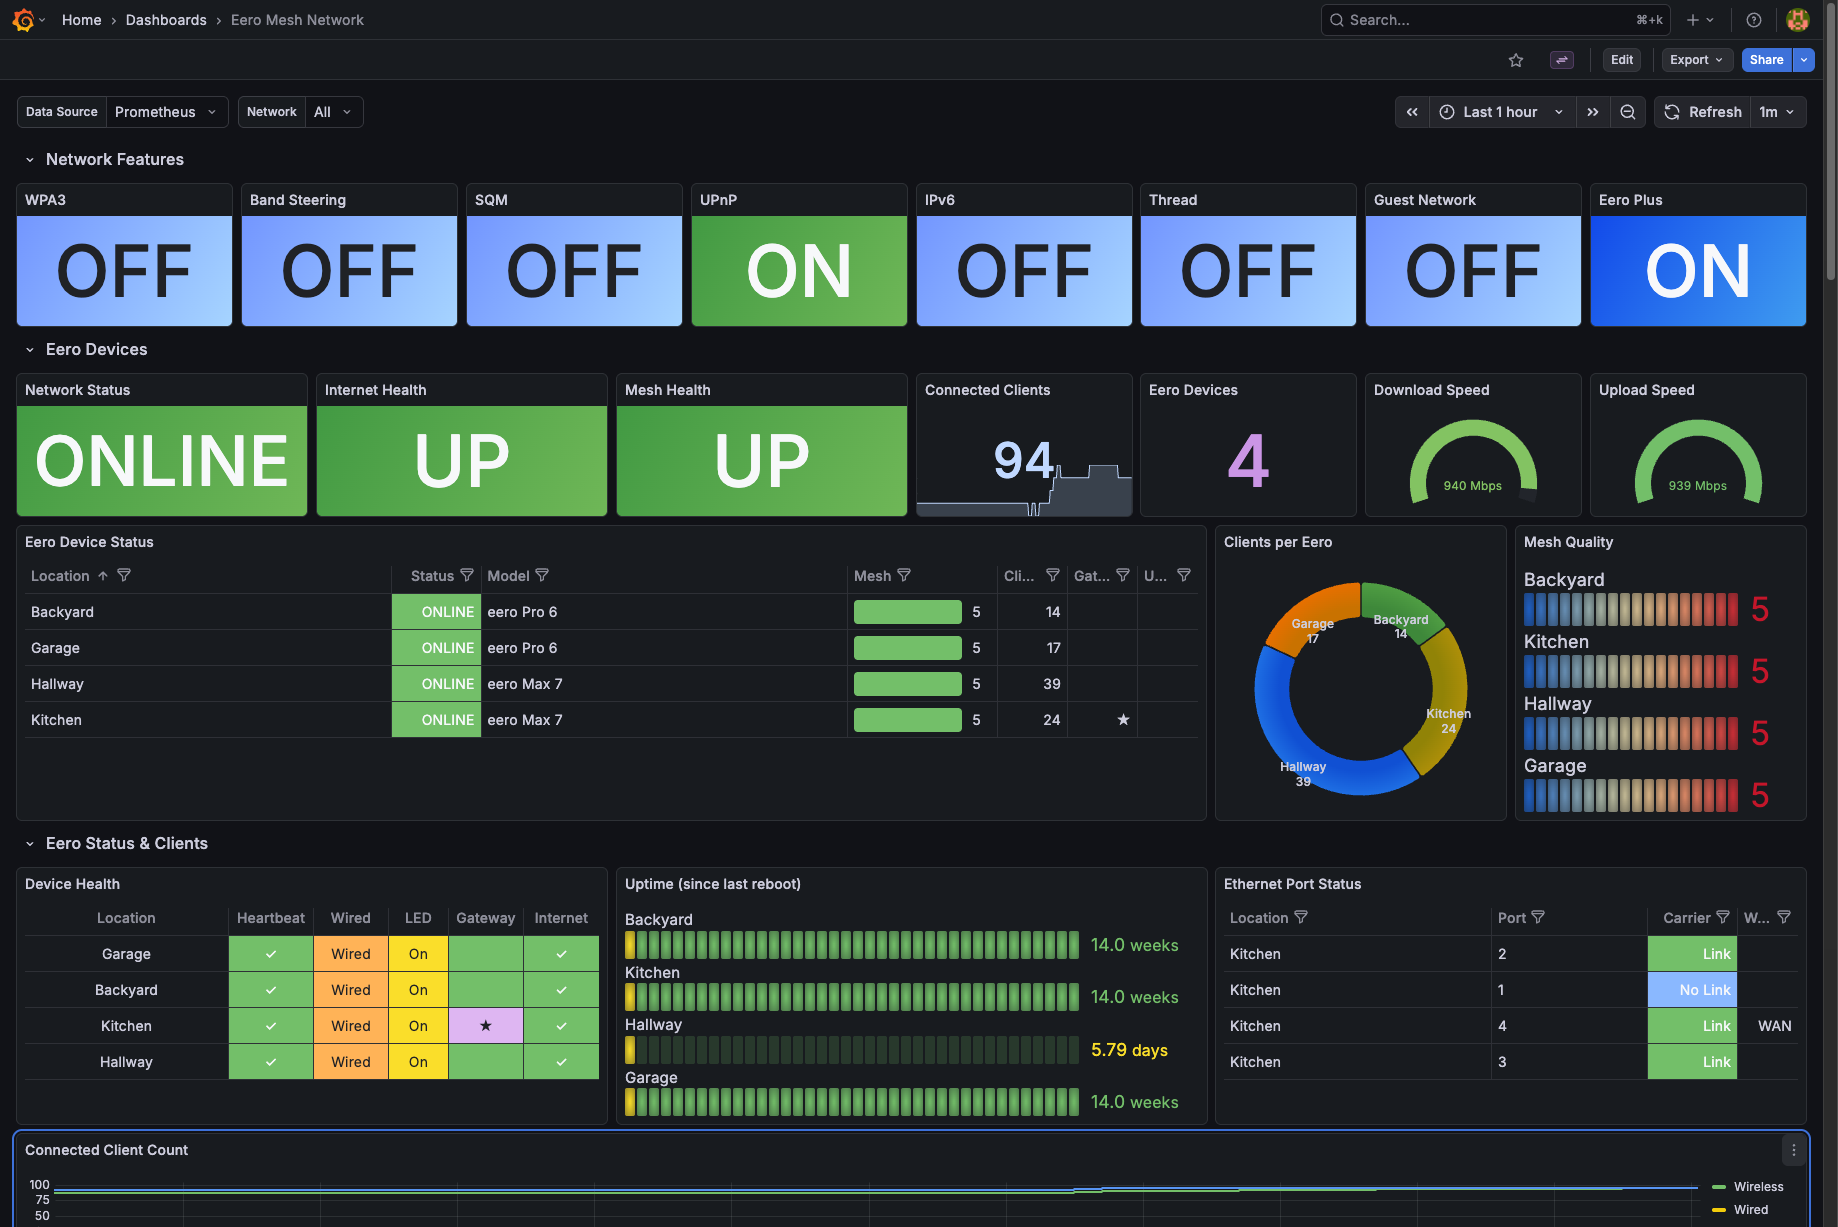
Eero Mesh Network Dashboard
Comprehensive Grafana dashboard for monitoring your eero mesh WiFi network, powered by the eero-prometheus-exporter.
Visualizes 115+ metrics across 15 categories: network status, eero hardware health, connected devices, Ethernet ports, Thread, Eero Plus features, speed tests, data usage, and more.

Variables
| Variable | Description |
|---|---|
datasource | Prometheus data source (select on import) |
network_id | Filter by eero network (multi-select, defaults to all) |
period | Usage period for data-transfer panels: day / week / month |
Requirements
- Grafana 11.5 or newer (schemaVersion 42)
- Prometheus datasource scraping the eero exporter
- eero-prometheus-exporter running and authenticated against your eero account
Setup
1. Install and authenticate the exporter:
pip install eero-prometheus-exporter
eero-exporter login your-email@example.com
eero-exporter serve
Metrics are then exposed at http://localhost:10052/metrics.
Docker users: see the Docker guide.
2. Add a Prometheus scrape job (see Collector Config above), then reload Prometheus.
3. Import this dashboard in Grafana and select your Prometheus datasource when prompted.
Panels
Organized into rows for quick navigation:
- Network Features — guest network, IPv6, thread, band steering, SQM, captive portal status
- Network Overview — uptime, gateway health, ISP info, public IP
- Eero Hardware — per-node status, model, firmware, uptime, LED state
- Connected Devices — online/offline counts, top talkers, signal strength, connection type
- Ethernet Ports — link status, speed, duplex per port
- Speed Tests — download/upload throughput history
- Data Usage — per-device and per-network transfer by day/week/month
- Eero Plus — activity tracking, backup network, ad blocking, threat scans
- Thread Network — device count, network status
- Exporter Health — scrape success, collection duration, last-update age
Links
License
Apache 2.0
Data source config
Collector config:
Upload an updated version of an exported dashboard.json file from Grafana
| Revision | Description | Created | |
|---|---|---|---|
| Download |