Traces Azure AppInsights Explorer Dashboard
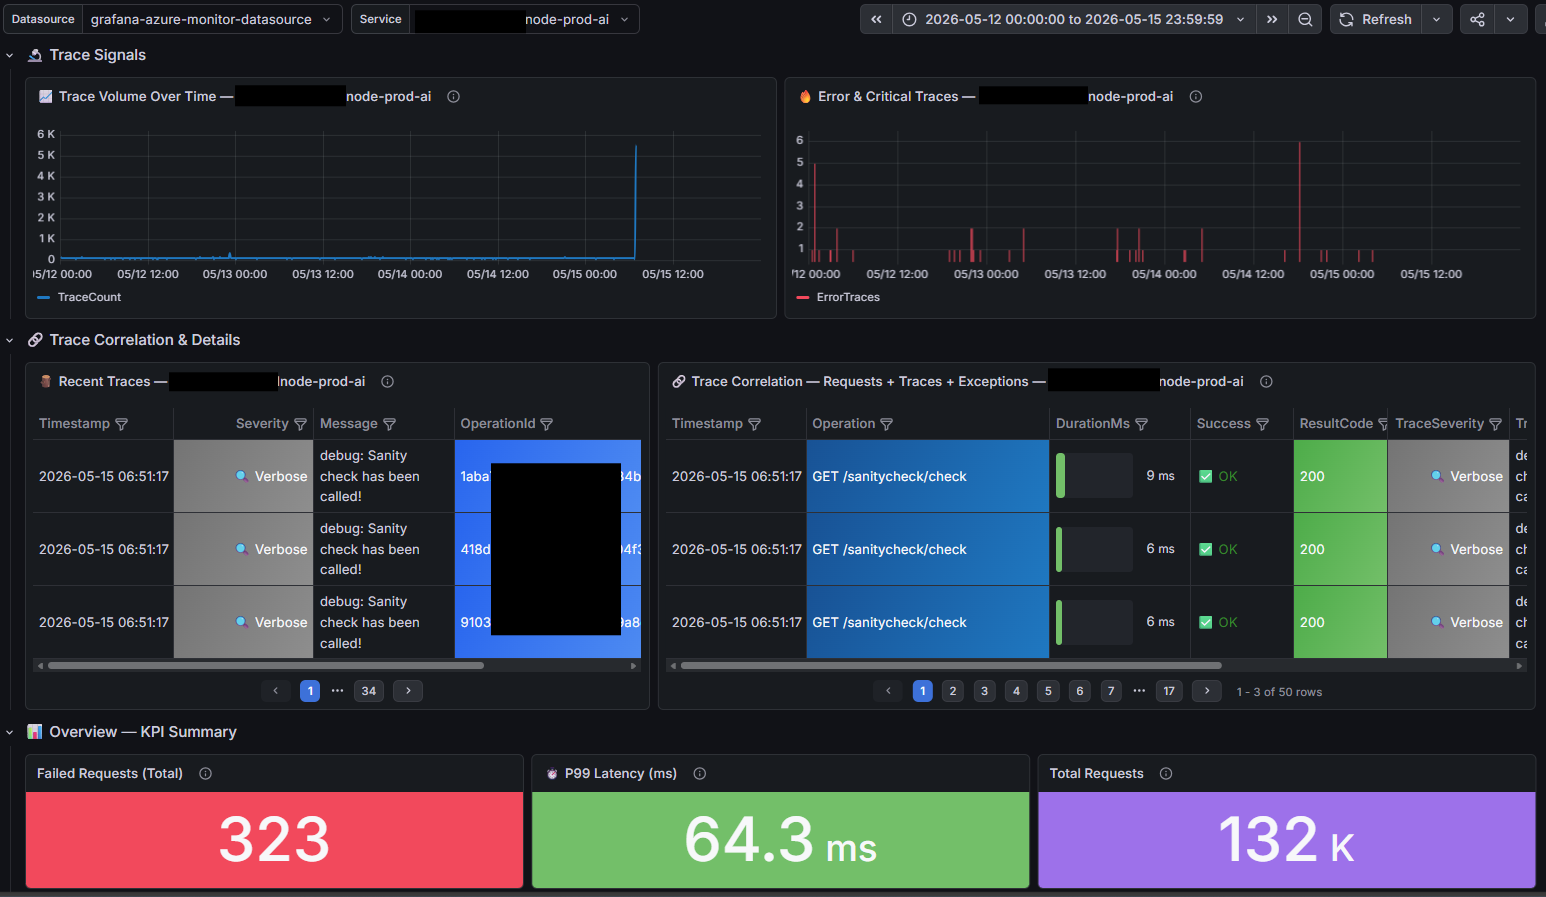
Executive-friendly traces dashboard for service health, latency, errors, and request-level investigation.
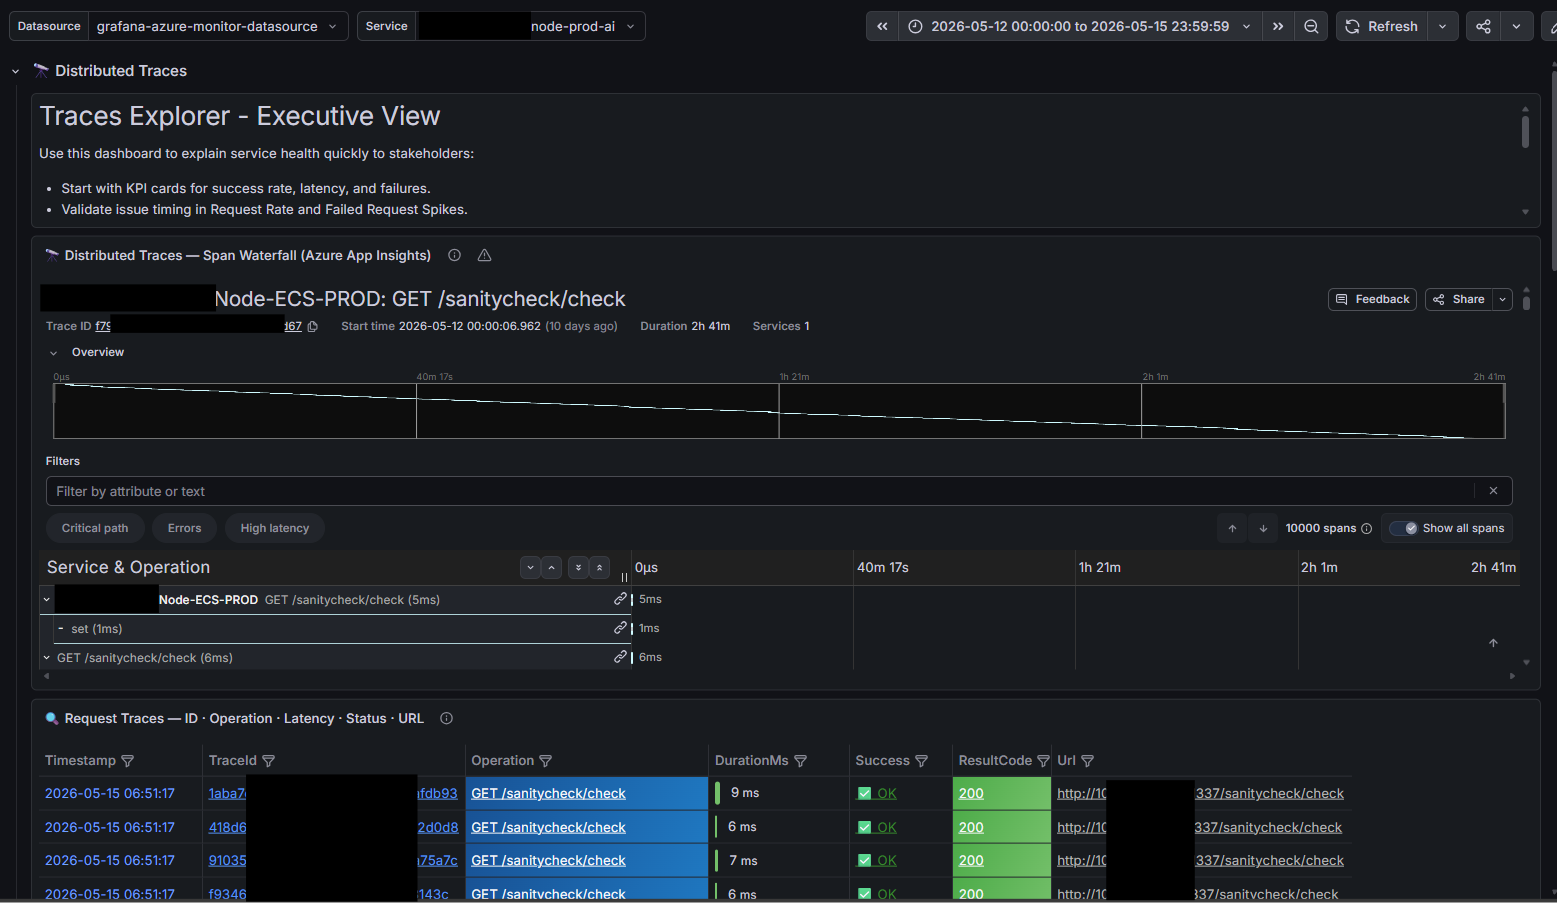
This dashboard to explain service health quickly to stakeholders:
Start with KPI cards for success rate, latency, and failures. Validate issue timing in Request Rate and Failed Request Spikes. Use Request Traces and Correlation tables for root-cause evidence. Open any Trace ID to inspect full distributed span waterfall.
Data source config
Collector type:
Collector plugins:
Collector config:
Revisions
Upload an updated version of an exported dashboard.json file from Grafana
| Revision | Description | Created | |
|---|---|---|---|
| Download |
Azure Cosmos DB
With the Grafana plugin for Azure Cosmos DB, you can quickly visualize and query your Azure Cosmos DB data from within Grafana.
Learn more