z/VM Link Aggregation
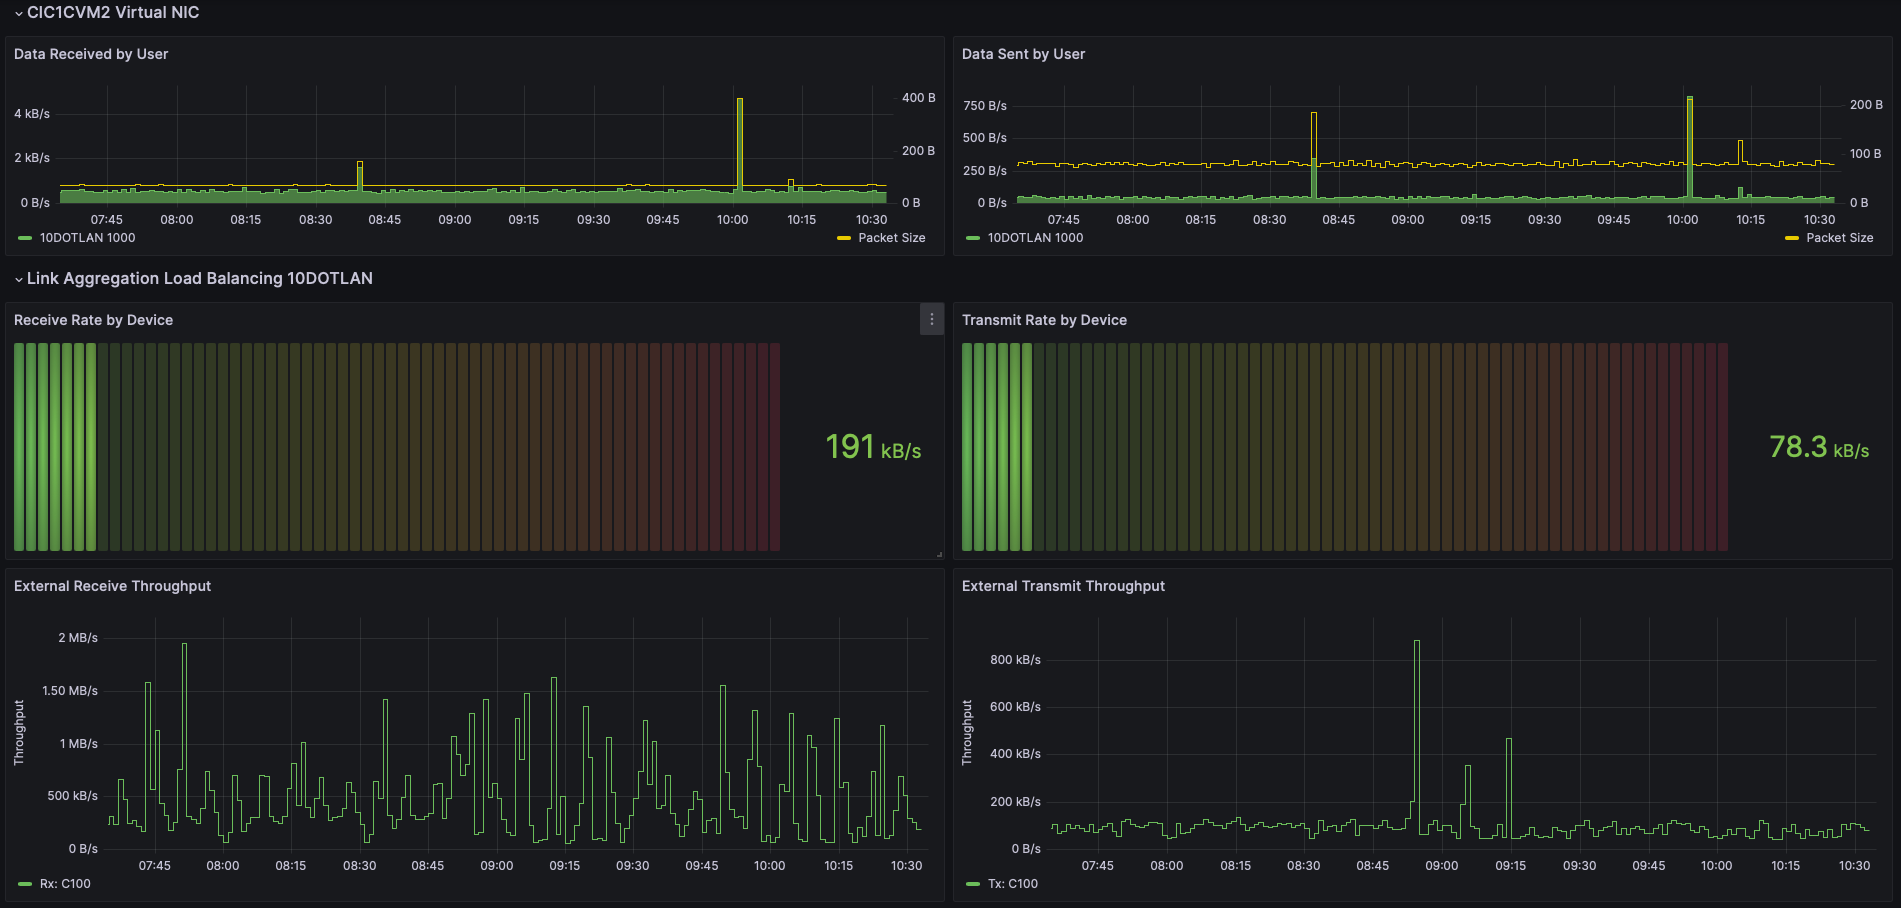
This Grafana dashboard provides detailed visibility into z/VM virtual network (VSWITCH) link aggregation, focusing on throughput across external and internal paths for each LAN.
This Grafana dashboard provides detailed visibility into z/VM virtual network (VSWITCH) link aggregation, focusing on throughput across external and internal paths for each LAN.
It enables analysis at multiple levels by breaking down traffic into receive/transmit metrics per LAN, per user (guest), and per virtual NIC, helping identify workload distribution and network usage patterns.
The dashboard also highlights load balancing effectiveness by showing per-device traffic rates within aggregated links, allowing operators to detect imbalances and optimize network performance.
Data source config
Collector config:
Upload an updated version of an exported dashboard.json file from Grafana
| Revision | Description | Created | |
|---|---|---|---|
| Download |