z/VM SSI Cluster
This Grafana dashboard provides a cluster-wide and per-member view of a z/VM SSI environment, highlighting system health, availability, and configuration details such as member uptime, CPU counts, and IPL/shutdown information.
This Grafana dashboard provides a cluster-wide and per-member view of a z/VM SSI environment, highlighting system health, availability, and configuration details such as member uptime, CPU counts, and IPL/shutdown information.
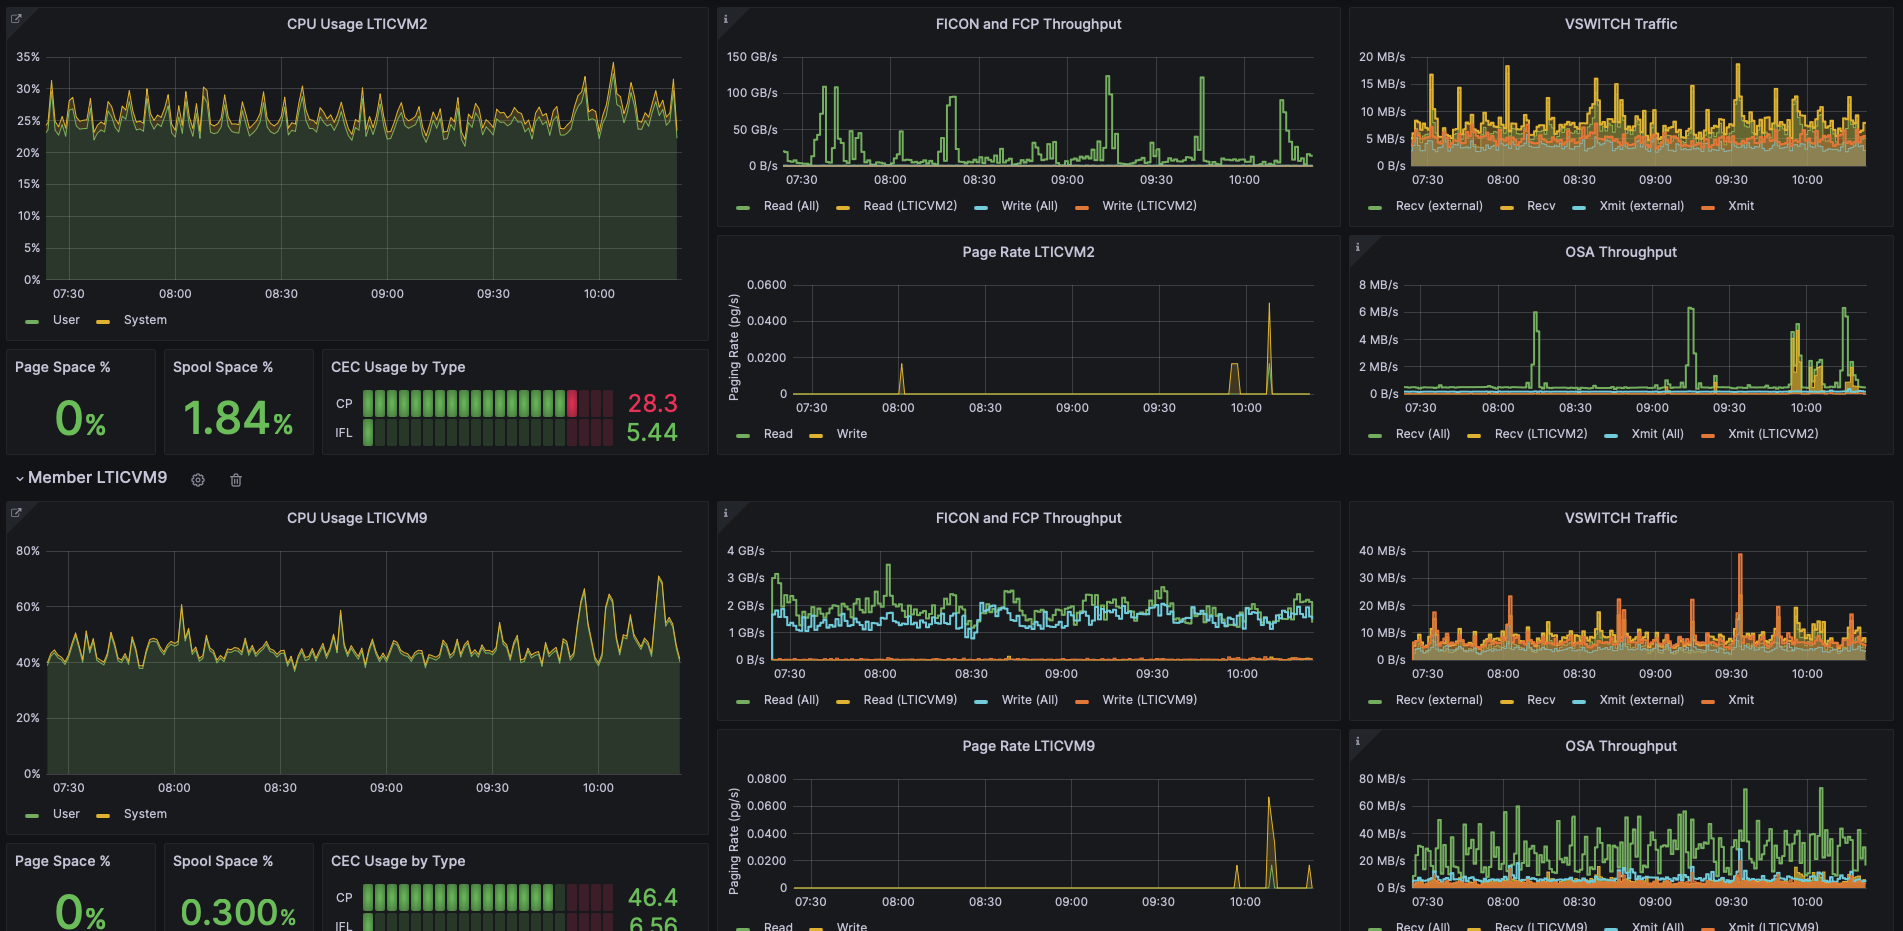
It focuses on performance monitoring through time-series panels that track CPU usage (including Linux guest activity), paging rates, and resource utilization across individual members and the cluster.
The dashboard also includes I/O and network throughput metrics—such as FICON/FCP, OSA, and VSWITCH traffic—enabling comprehensive visibility into workload behavior and system-level performance.
Data source config
Collector config:
Upload an updated version of an exported dashboard.json file from Grafana
| Revision | Description | Created | |
|---|---|---|---|
| Download |