AIX Server Overview — Native Prometheus monitoring for IBM Power
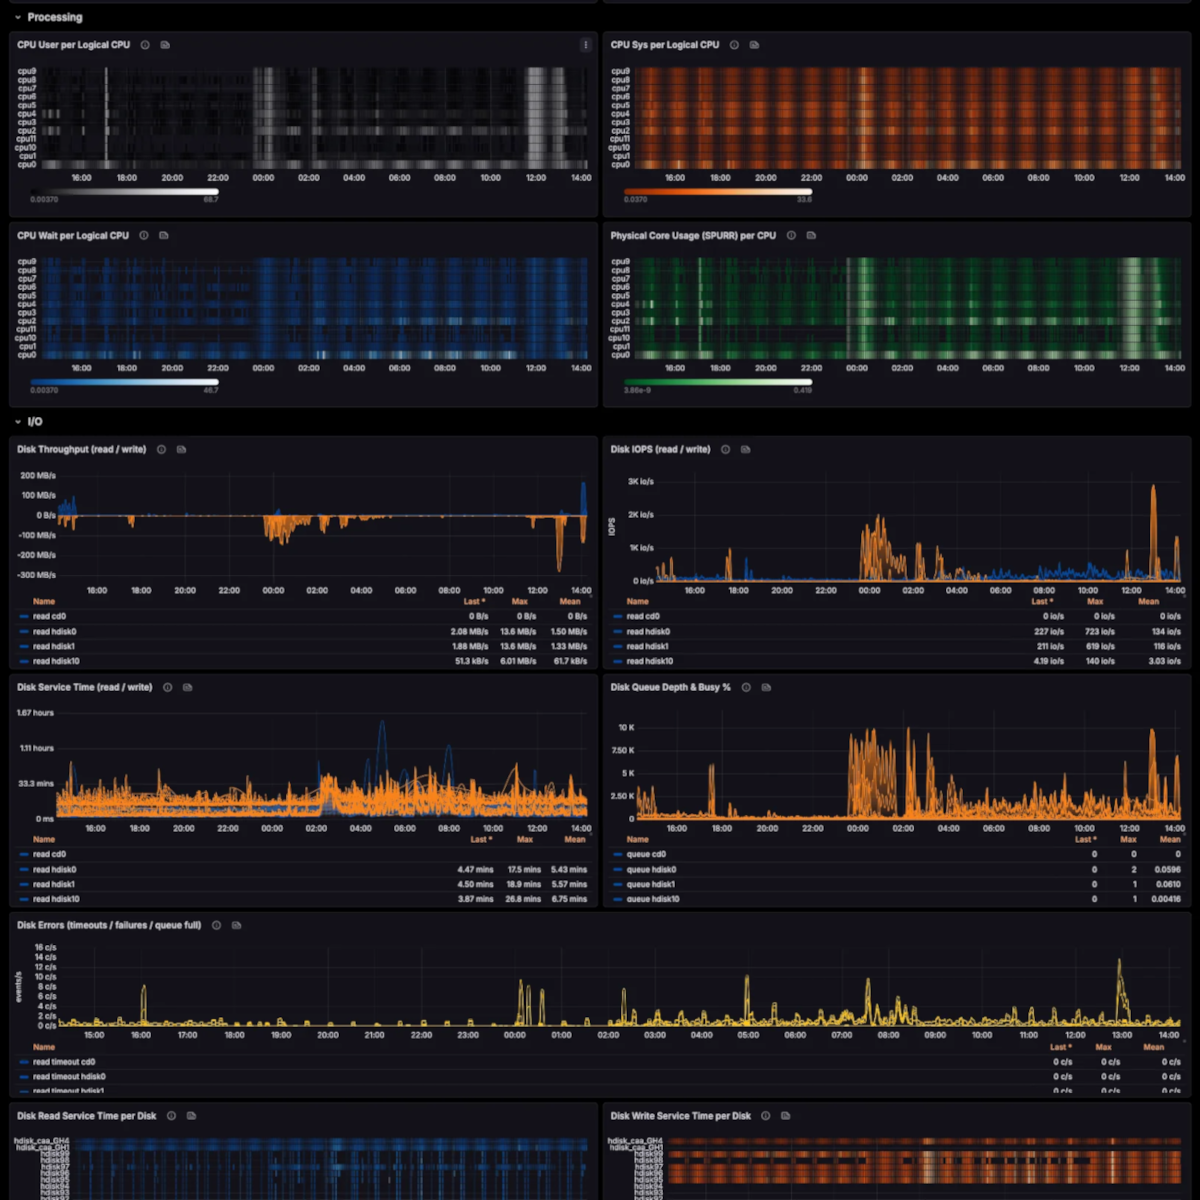
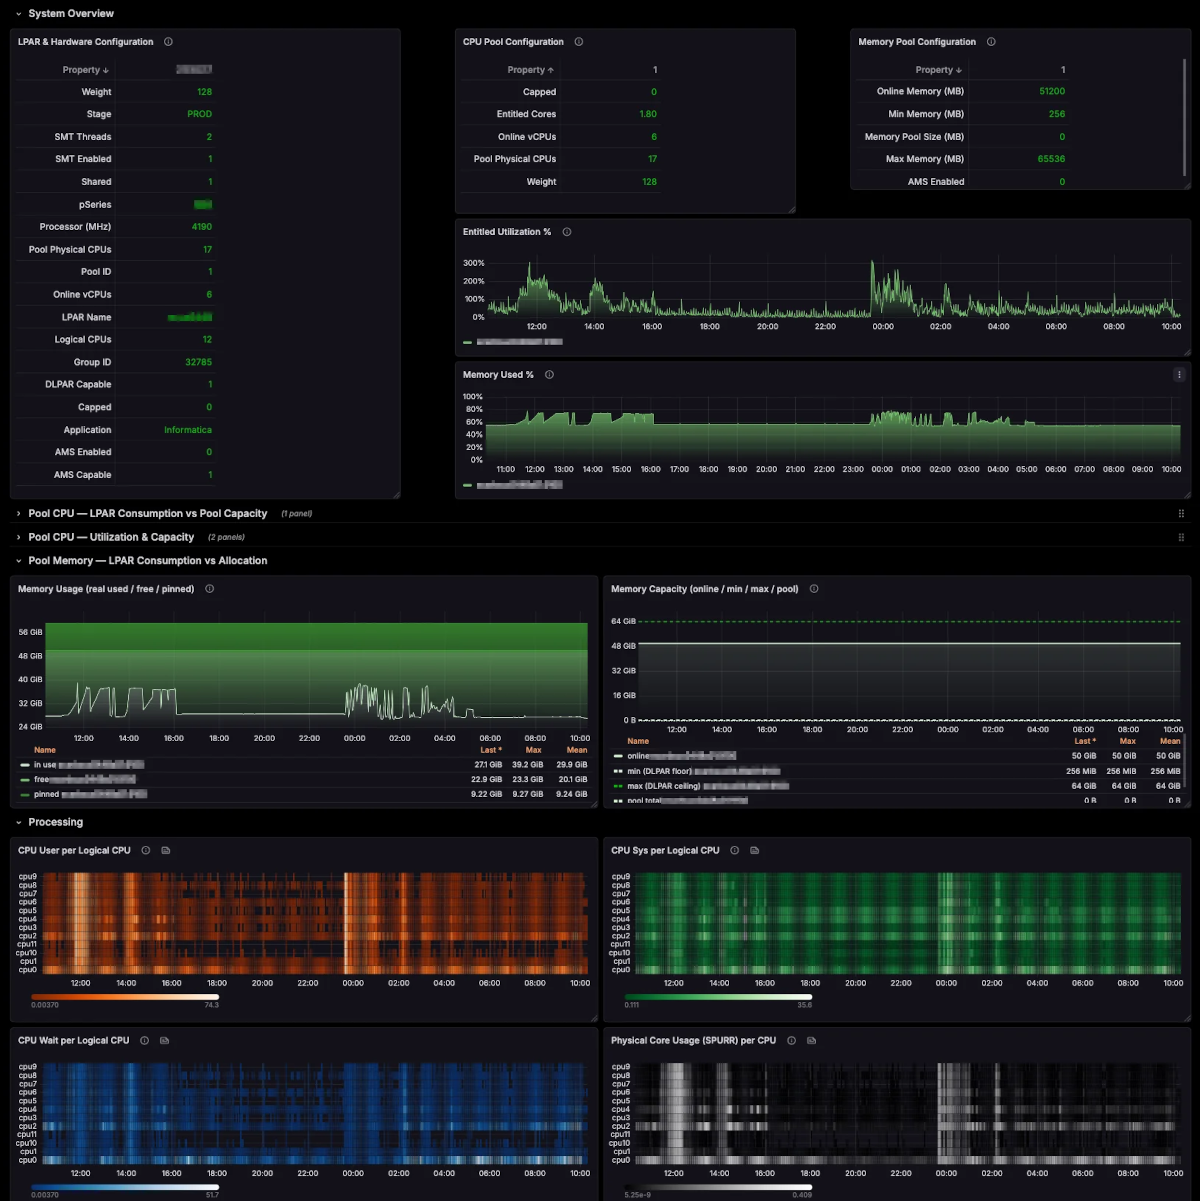
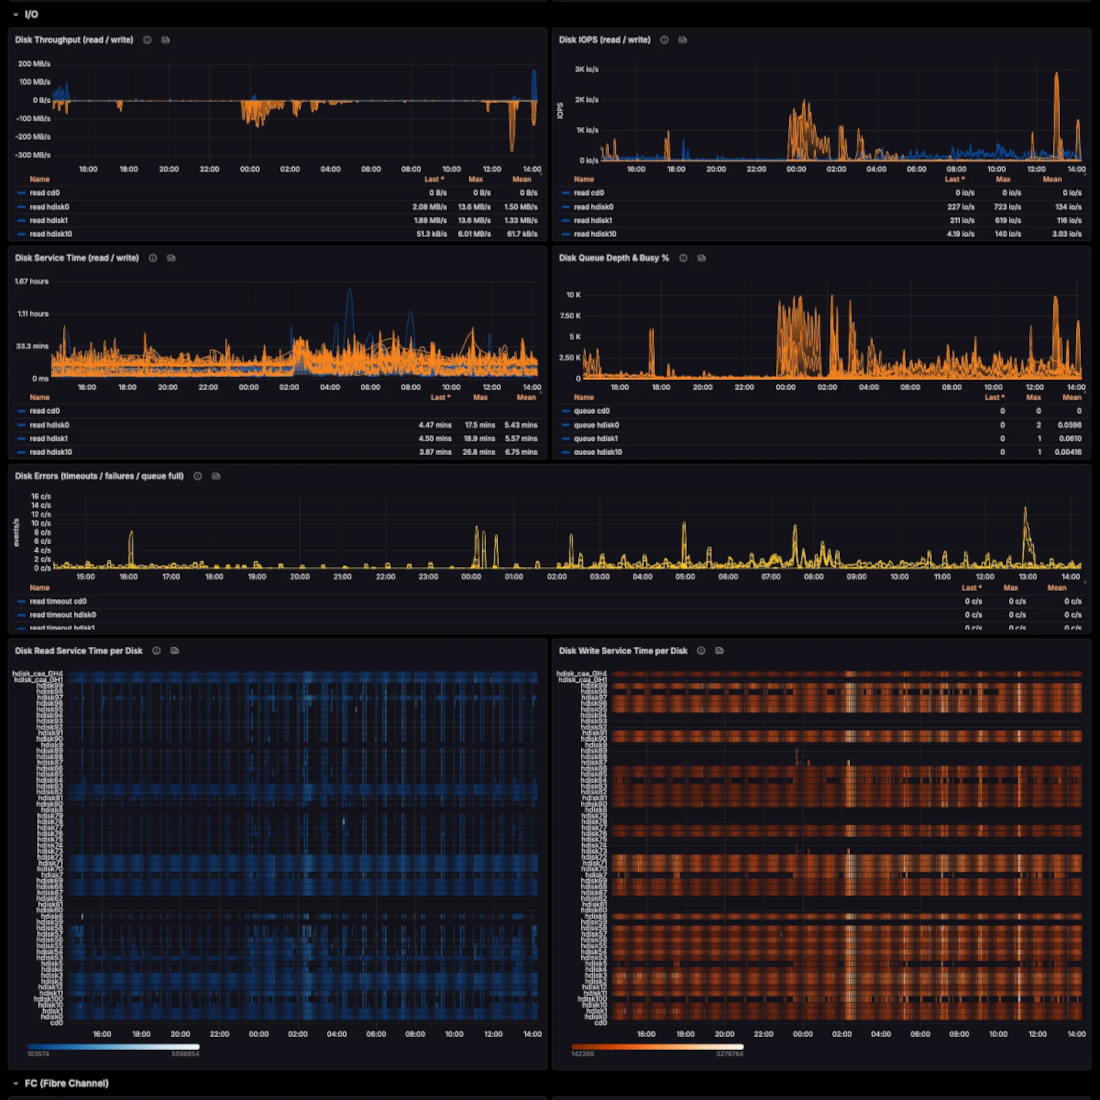
Comprehensive AIX server monitoring dashboard powered by AIX-exporter, the only native Prometheus exporter for IBM Power Systems. CPU (user/sys/wait/SPURR per logical CPU), memory, paging, network, filesystems, and processes — straight off the LPAR, no scripts, no syslog hacks, no SNMP bridge. ⚠️ This dashboard renders nothing until AIX-exporter is scraping your LPARs. Free trial — no credit card, 60-second installp, first metrics in ~5 minutes: https://aixwatch.com/trial/
Get started (free)
Download the free AIX-exporter trial — no credit card, no time limit, runs fully offline (air-gapped friendly, no phone-home). Install via installp, point Prometheus at port 9106, import this dashboard. First metrics in ~5 minutes. → https://aixwatch.com/trial/
This dashboard requires:
- AIX-exporter (native exporter reading libperfstat, ODM and AIX commands)
- Prometheus scraping AIX-exporter (self-hosted or Grafana Cloud)
- Standard labels exposed by the exporter (hostname, partition_name, lpar_id, system_serial)
About AIXwatch
🔗 Free trial (no card, 60-sec install): https://aixwatch.com/trial/ 🔗 Product & docs: https://aixwatch.com/product/aix-exporter/
License
Try it free: the AIX-exporter trial ships 3 core collectors (CPU, memory, partition) with no time limit. Unlock all 22 collectors and the full dashboard with a perpetual license — $115/LPAR. This Grafana dashboard itself is MIT-licensed.
Data source config
Collector config:
Upload an updated version of an exported dashboard.json file from Grafana
| Revision | Description | Created | |
|---|---|---|---|
| Download |
IBM DB2
Easily monitor your deployment of IBM DB2, a relational database management system designed to store, manage, and retrieve data efficiently, with Grafana Cloud's out-of-the-box monitoring solution.
Learn more