AIX Loki errpt — error log dashboard (Loki Agent)
Real-time AIX errpt error-log monitoring for IBM Power, via Grafana Loki. Fleet timeline across all LPARs, PERM-error alerting, error-volume trends, error-class heatmap, top resources, and drill-down log entries — shipped by the Loki Agent for AIX (native errpt forwarder, no syslog hacks). > **▶ The dashboard needs logs.** Stream your AIX errpt to Loki with **Loki Agent for AIX** — native forwarder, no syslog hacks. Free on a single LPAR, no time limit. > **→ [Download the free trial](https://aixwatch.com/trial/)**
About this dashboard
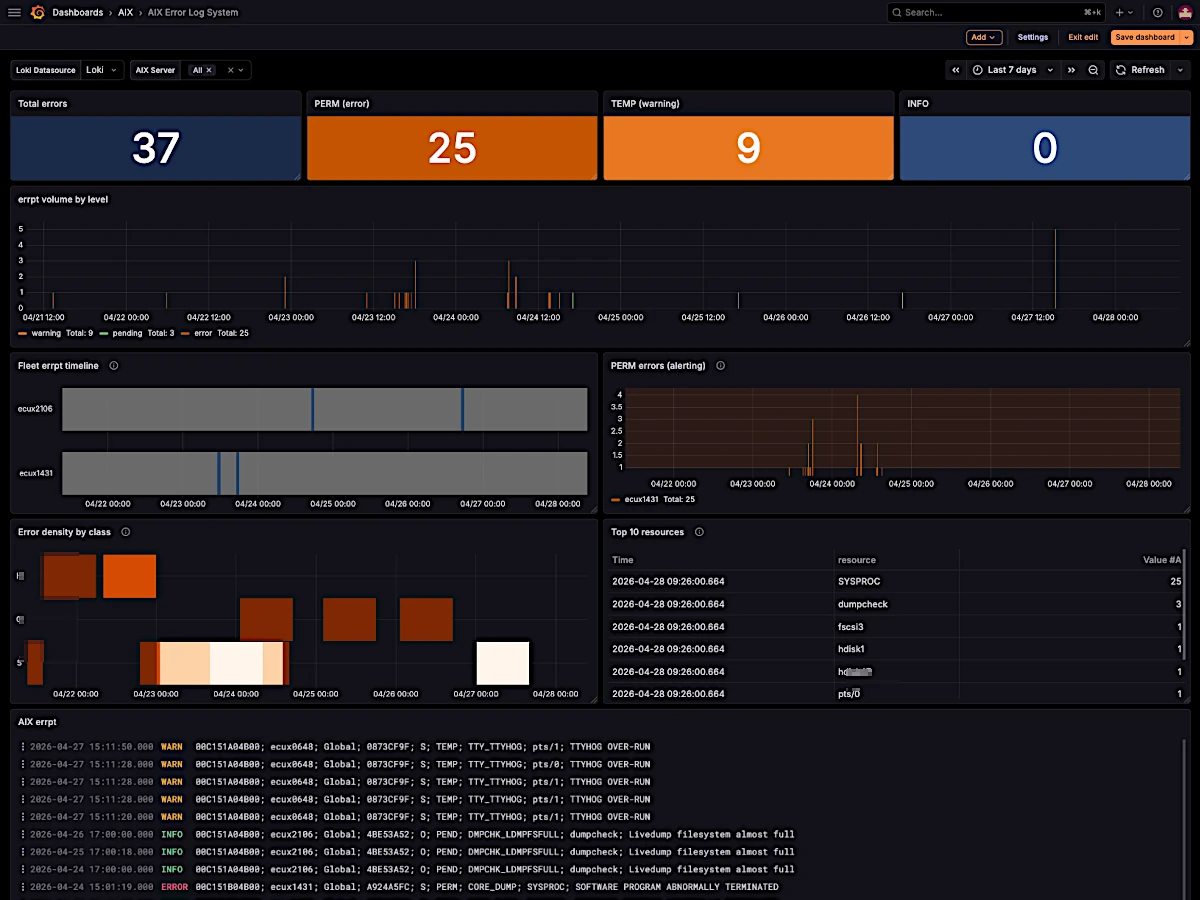
This dashboard provides comprehensive AIX error report (errpt) monitoring through a Grafana Loki backend. It is designed for IBM Power Systems administrators who need real-time visibility into system errors across their AIX/IBM i fleet.
What you'll see
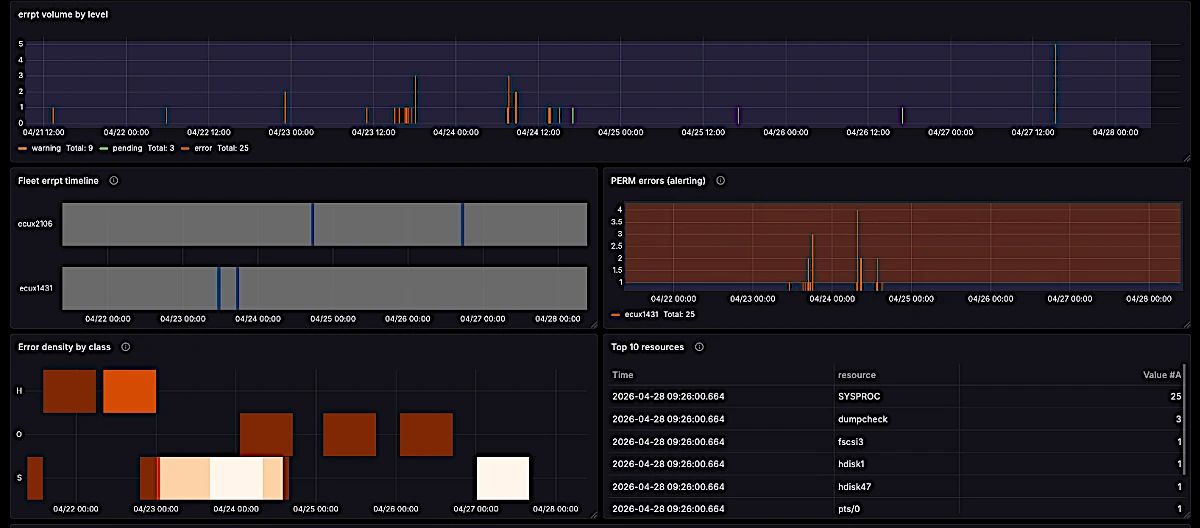
- Fleet timeline: errors across all your AIX hosts in one view
- Alerting panel: critical errors that require immediate attention
- Error volume: trends over time to spot patterns
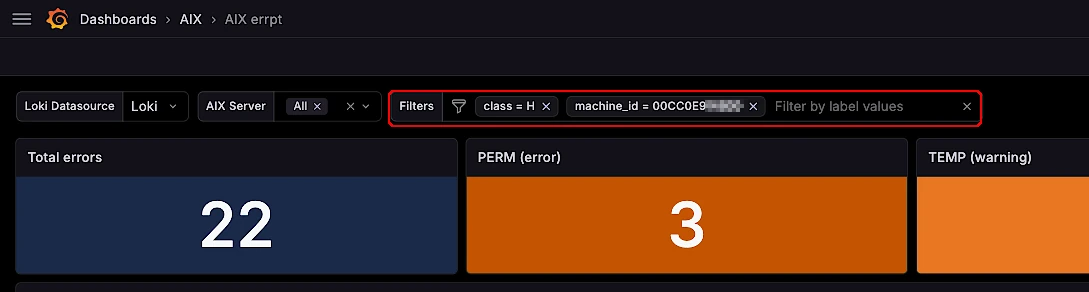
- Heatmap: error distribution by host and time window
- Top resources: which subsystems are generating the most errors
- Detailed log entries: drill-down to specific events
How to use this dashboard
This dashboard requires:
Loki Agent for AIX — native log forwarder for AIX systems that pushes errpt entries to Grafana Loki without intermediate transformations. No syslog hacks, no fragile shell scripts.
Grafana Loki — any standard Loki backend (self-hosted or Grafana Cloud)
Standard log labels — the agent ships with sensible defaults (host, sequence, error_id, class, type, resource_name)
Try Loki Agent for AIX
The dashboard expects logs shipped by Loki Agent for AIX, the native companion agent built specifically for IBM Power workloads.
→ Download the free trial — fully functional on a single LPAR, no time limit.
License your fleet at $75/LPAR (perpetual, first-year maintenance included) — see pricing. Volume or enterprise? Get in touch.
→ See pricing ($75/LPAR perpetual license, first-year maintenance included)
→ Get in touch for enterprise deployments or volume pricing
About AIXwatch
AIXwatch is a suite of native observability tools for IBM Power Systems, built by Nicolas Gravillon — infrastructure engineer with 25 years of AIX, PowerHA and SAN/Storage experience (BCSD certified, ex-IBM Global Services).
The suite covers:
- AIX-exporter — Prometheus metrics for AIX/IBM i
- Loki Agent for AIX — native log shipping to Grafana Loki
- power-hmc-exporter — agentless HMC monitoring (CPU, NPIV, SEA, VIOS)
All deployed in production at enterprise scale.
Feedback
Found a bug or have a suggestion? Reach out via aixwatch.com/contact — feedback from real AIX operators directly shapes the roadmap.
License
This dashboard is provided as-is under MIT license — free to use, modify, and share.
The Loki Agent for AIX is a commercial product with perpetual licensing (you own it forever). The free evaluation runs on a single LPAR with no time limit — install and evaluate at your own pace.
Data source config
Collector config:
Upload an updated version of an exported dashboard.json file from Grafana
| Revision | Description | Created | |
|---|---|---|---|
| Download |
Grafana Loki (self-hosted)
Easily monitor Grafana Loki (self-hosted), a horizontally scalable, highly available, multi-tenant log aggregation system inspired by Prometheus, with Grafana Cloud's out-of-the-box monitoring solution.
Learn more