GPU Memory & Throttle: OOM, thermal, power debug (single host)
Single-host NVIDIA GPU resource state dashboard. Memory used/free/total/fragmentation, top PIDs by allocation, throttle bitmask + rising-edge event counters (power/thermal/sw/hw), experimental memfrag IOCTL counter. Why is my GPU running hot, throttled, or full?
What this dashboard shows
A single-host NVIDIA GPU resource state view. Memory used / free / total / fragmentation, top processes by allocation, throttle bitmask
- rising-edge event counters, plus an experimental memfrag IOCTL
counter when
--enable-experimental-kprobesis on. Answer to: "Why is my GPU running hot, throttled, or full?"
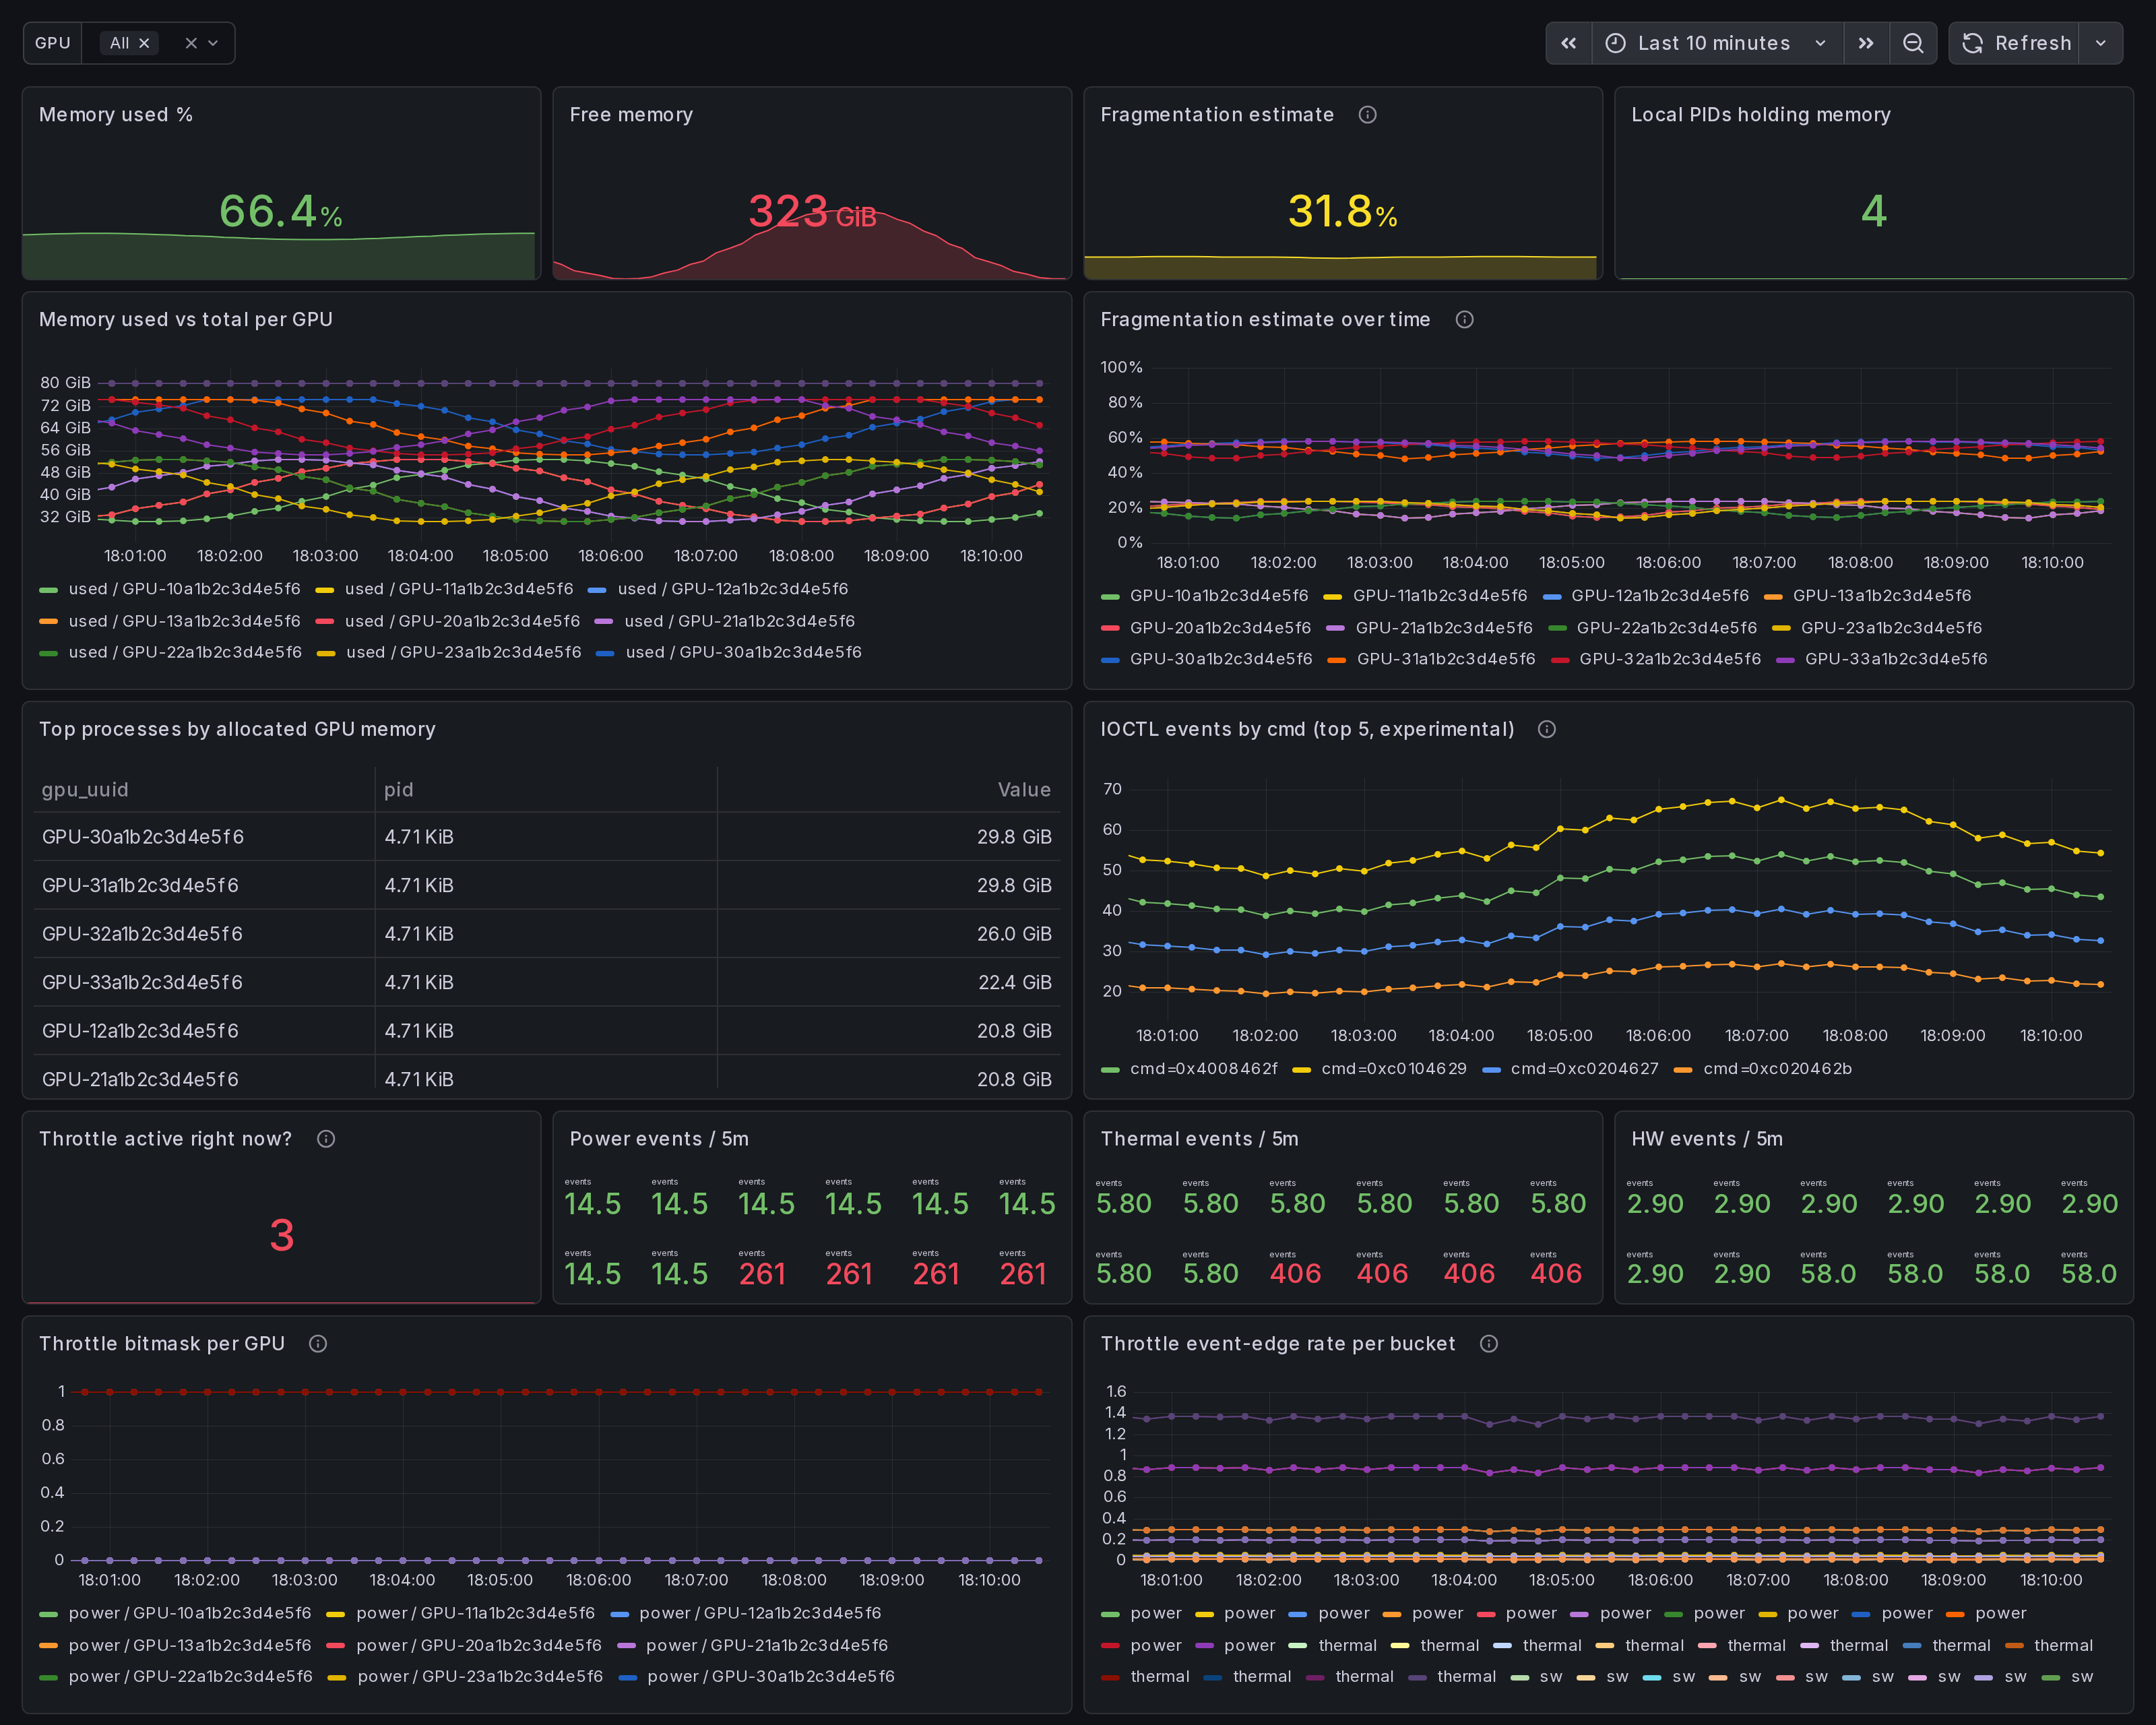
The headline panels:
Memory section:
- Memory used % - aggregate across selected GPUs.
- Free memory - bytes available right now.
- Fragmentation estimate - heuristic: 1 - (largest free block / total free). 0 = unfragmented; 1 = fully fragmented. Average across selected GPUs.
- Local PIDs holding memory - process count.
- Memory used vs total per GPU - one line per GPU.
- Fragmentation estimate over time - tracks alloc churn. Spikes correlate with DataLoader rebuilds, optimizer state shuffles, KV-cache resets.
- Top processes by allocated memory (table).
- IOCTL events by cmd (top 5, experimental) - per-cmd rate from the v0.15 memfrag kprobe (gated; empty when off).
Throttle section:
- Throttle active right now? - sum across all 4 buckets.
- Power / Thermal / HW events / 5m - rising-edge counters.
- Throttle bitmask per GPU - which bucket is active. Concurrent active = compound throttle (e.g. power + thermal under sustained load).
- Throttle event-edge rate per bucket - rate-of-rising-edge per bucket type.
Linux only. amd64 + arm64.
How the data is collected
Install the Ingero agent:
curl -sSL https://github.com/ingero-io/ingero/releases/latest/download/install.sh | bash
Run with Prometheus exporter (production metrics):
sudo ingero trace --prometheus :9090
Run with experimental kprobes enabled (memfrag IOCTL counter):
sudo ingero trace --enable-experimental-kprobes --prometheus :9090
Scrape and import:
Scrape :9090/metrics from your Prometheus / Grafana Alloy /
Grafana Cloud agent. Import this dashboard, pick your Prometheus
datasource.
Production metrics
NVML / nvidia-smi polls every --memfrag-poll-interval (default
10s) and every --throttle-poll-interval (default 5s):
gpu_memory_used_bytes(per gpu_uuid label)gpu_memory_free_bytesgpu_memory_total_bytesgpu_memory_fragmentation_estimate(heuristic)gpu_memory_process_allocated_bytes(per gpu_uuid + pid)gpu_throttle_power_active/_thermal_active/_sw_active/_hw_active(per gpu_uuid; gauge 0/1)gpu_throttle_power_event_total/_thermal_event_total/_sw_event_total/_hw_event_total(rising-edge counters)
Experimental metrics
Gated behind --enable-experimental-kprobes. The agent reads the
running NVIDIA driver version + kernel version and only loads the
memfrag IOCTL kprobe when the pair is on its allowlist. Off-list
hosts surface a startup warning and the experimental panel stays
empty.
gpu_memfrag_ioctl_event_total(per cmd label) - one ringbuf event pernvidia_unlocked_ioctlinvocation; cmd is the raw IOCTL command code.
Decode cmd values against open-gpu-kernel-modules nv-ioctl-numbers.h and nvos.h: https://github.com/NVIDIA/open-gpu-kernel-modules/blob/main/kernel-open/common/inc/nv-ioctl-numbers.h
How to read the heuristic + edge counters
The fragmentation estimate is a coarse signal. Values above ~0.6
across multiple sequential polls usually correlate with alloc /
free churn (DataLoader workers, KV-cache reset, mixed-size
allocator pressure). For the actual allocator-level signal,
turn on --enable-experimental-kprobes and watch the IOCTL panel.
The throttle event-edge counters are rising-edge: each transition
from "not throttled" to "throttled" increments the bucket counter
once. Sub-poll bursts shorter than --throttle-poll-interval are
still missed by design.
Companion dashboards
- Single-host set (this set): GPU Trace Overview (#25277), CUDA Op Profiler (#25278), GPU Data Movement (#25280), GPU Memory & Throttle (this one).
- Multi-node cluster set: GPU Cluster Overview (#25271), NCCL Stragglers (#25273), GPU Memcpy Bandwidth (#25274), GPU Memory Fragmentation (#25275), Per-Node Drill-Down (#25276).
- Fleet pipeline health: operator dashboard for the Ingero Fleet collector itself.
All published under https://grafana.com/orgs/ingero
Source
- Agent: https://github.com/ingero-io/ingero
- Dashboard JSON: https://github.com/ingero-io/ingero/tree/main/examples/grafana/single-node
- License: Apache-2.0
Issues, panel suggestions, dashboard PRs welcome on https://github.com/ingero-io/ingero/issues
Data source config
Collector config:
Upload an updated version of an exported dashboard.json file from Grafana
| Revision | Description | Created | |
|---|---|---|---|
| Download |