GPU Data Movement: CUDA memcpy + NCCL collectives (single host)
Single-host CUDA memcpy + NCCL data-movement dashboard. Per-direction memcpy throughput + p50/p95/p99 (from per-event histogram), local NCCL collective rates by op_type, libnccl version roster. Answer: is data movement my bottleneck on this box? eBPF uprobes on libcudart and libnccl.
What this dashboard shows
A single-host data-movement view: CUDA memcpy bandwidth + per-event duration percentiles by direction, plus local NCCL collective rates + libnccl version roster. Answer to: "Is data movement my bottleneck on this box?"
The headline panels:
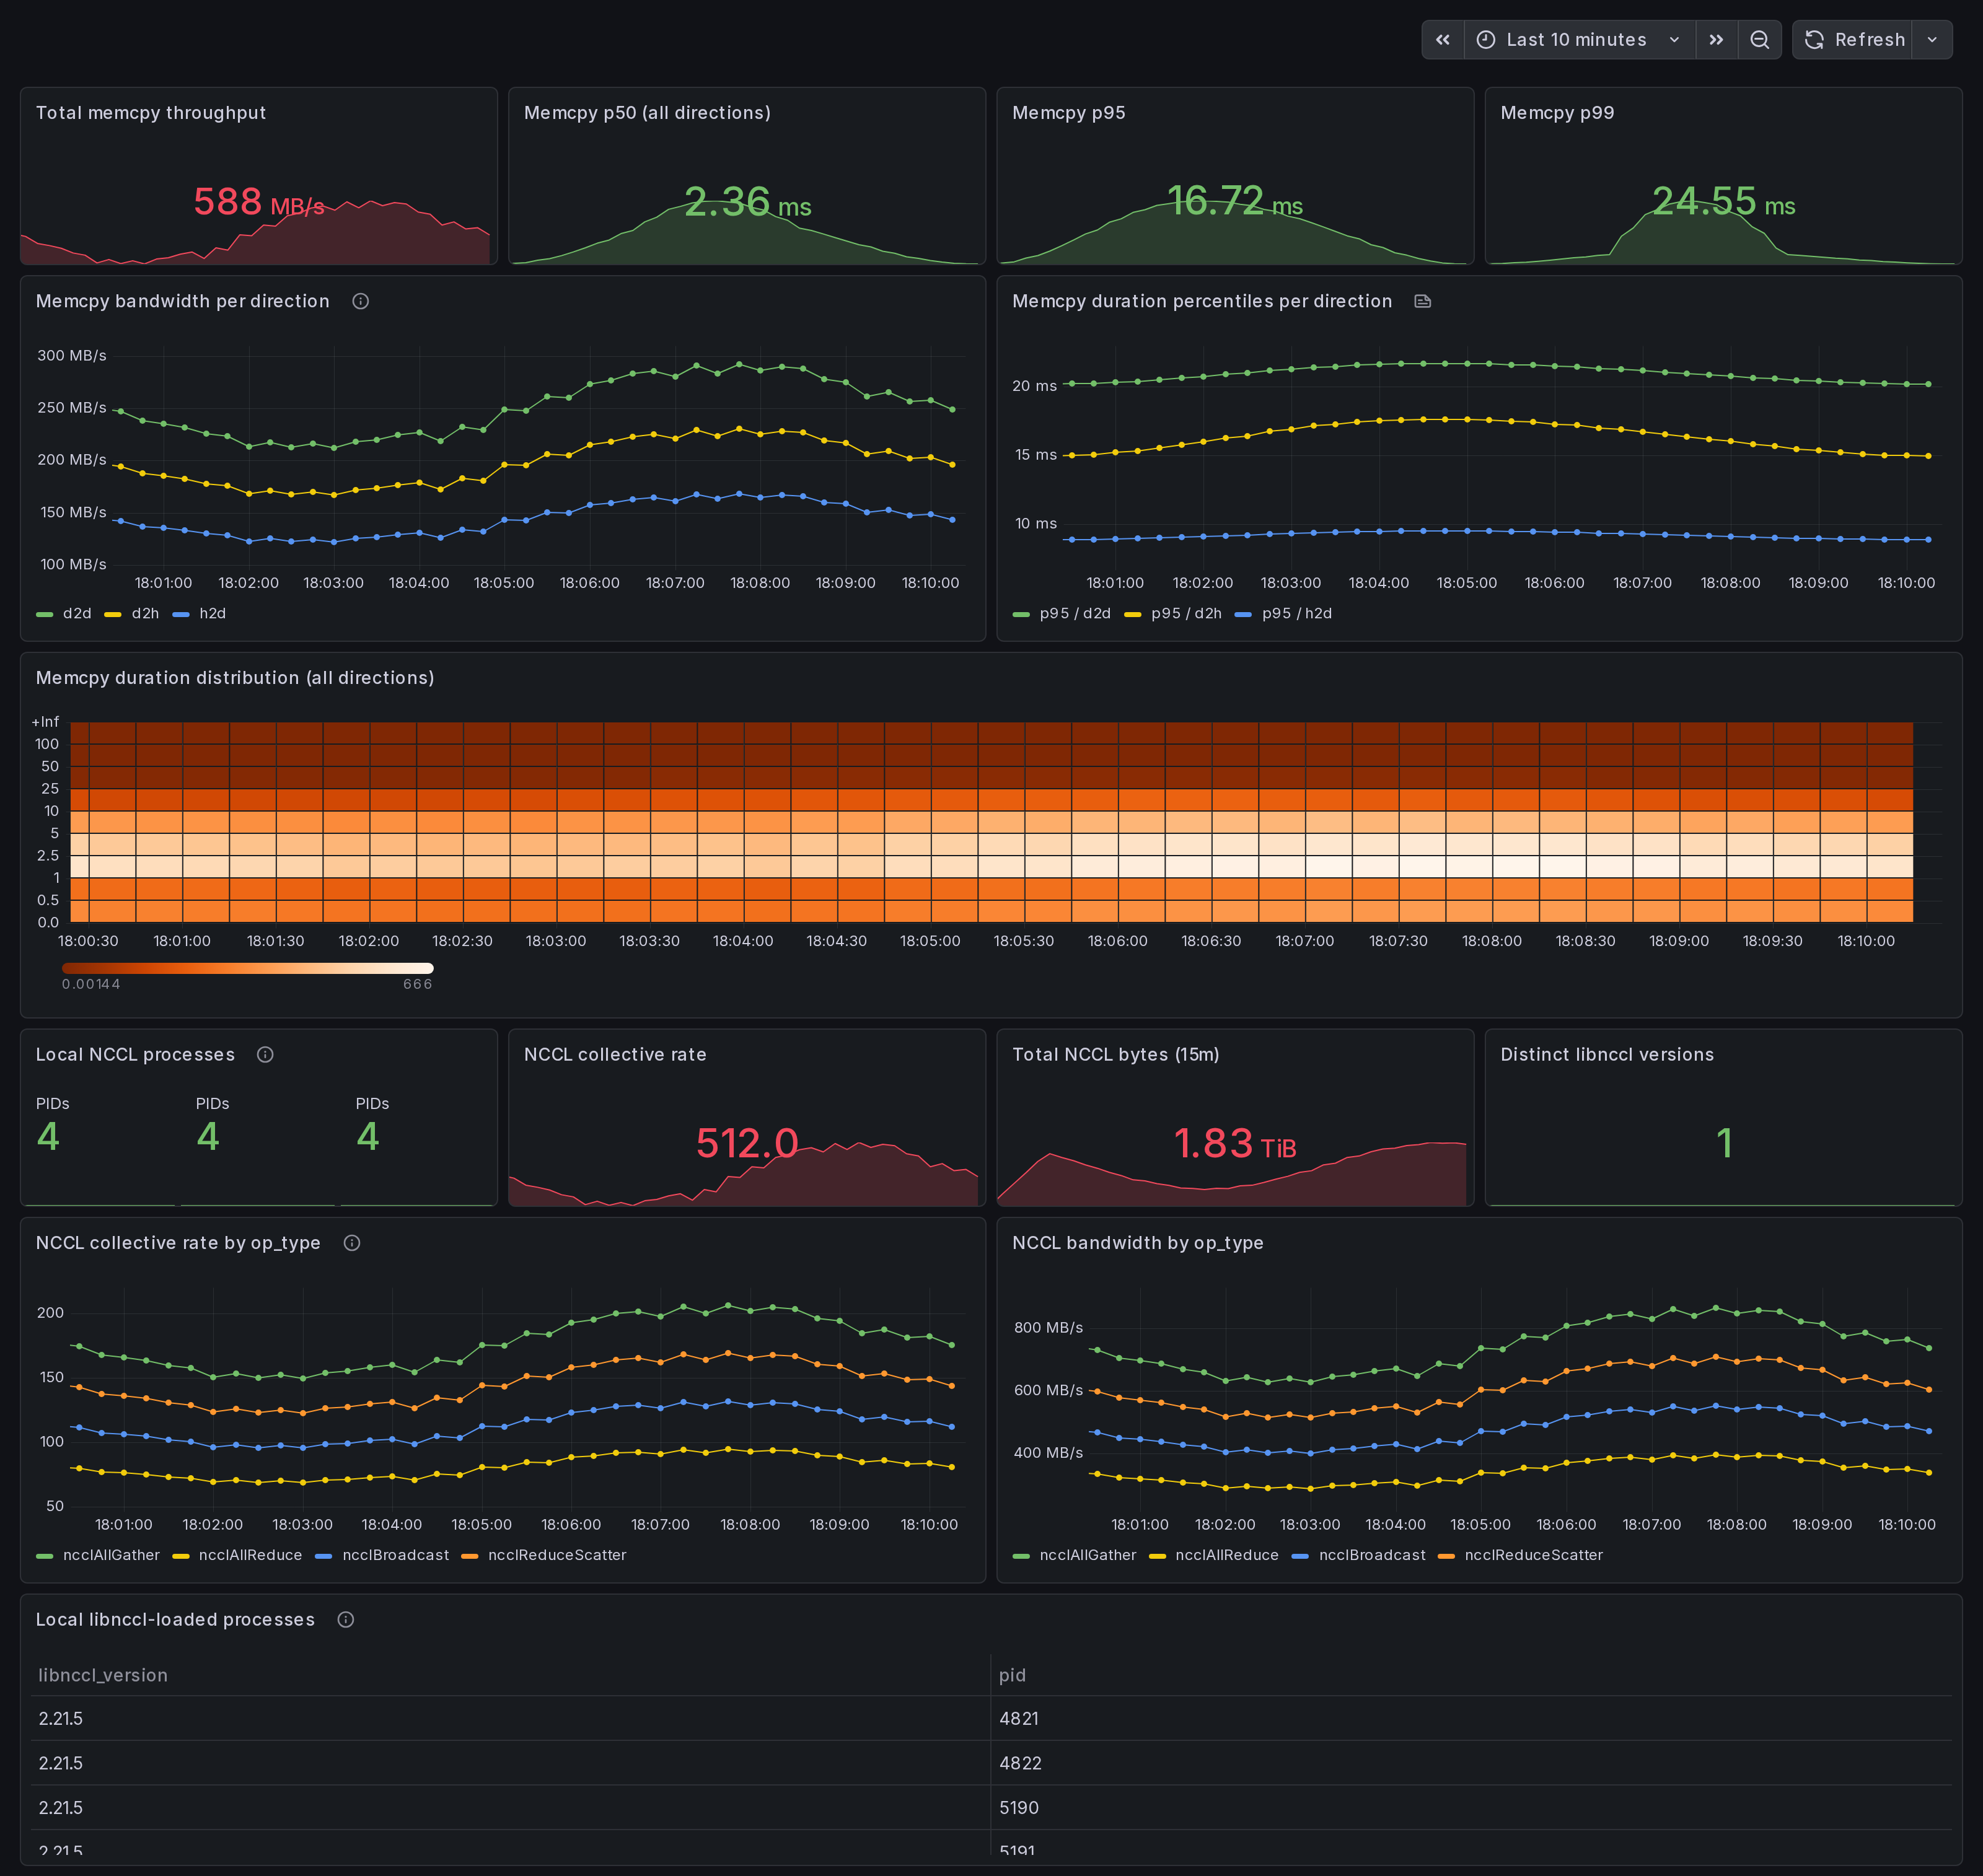
Memcpy section:
- Total memcpy throughput - sum of
gpu_memcpy_bytes_totalrate across all directions. - p50 / p95 / p99 duration (all directions) - per-event
latency percentiles from the
gpu_memcpy_duration_mshistogram. - Bandwidth per direction - h2d / d2h / d2d / default / unknown over time. h2d-d2h skew = data-pipeline imbalance.
- Duration percentiles per direction - p95 per direction to surface direction-specific tail latency.
- Duration distribution heatmap - shape of the duration histogram over time. Right-skewed = tail latency.
NCCL on this node section:
- Local NCCL processes - count of libnccl-loaded PIDs from the discovery scanner.
- Collective rate by op_type - locally fired collectives:
ncclAllReduce,ncclAllGather,ncclReduceScatter,ncclBcast,ncclSend,ncclRecv. - Bandwidth by op_type - rate of cumulative bytes counter.
- Distinct libnccl versions - count of unique
libnccl_versionlabels (different PyTorch venvs ship different NCCL ABIs). - Local libnccl-loaded processes (table) - PID + comm + libnccl path + version per process.
Linux only. amd64 + arm64.
How the data is collected
Install the Ingero agent:
curl -sSL https://github.com/ingero-io/ingero/releases/latest/download/install.sh | bash
Run with the Prometheus exporter and NCCL uprobes:
sudo ingero trace --nccl --prometheus :9090
Scrape and import:
Scrape :9090/metrics from your Prometheus / Grafana Alloy /
Grafana Cloud agent. Import this dashboard, pick your Prometheus datasource.
Memcpy metrics
eBPF uprobes on libcudart cudaMemcpy symbols (cudaMemcpy, cudaMemcpyAsync, cudaMemcpy2D, cudaMemcpy2DAsync, cudaMemcpyPeer, cudaMemcpyPeerAsync) at function entry + return. The cudaMemcpyKind argument is read from the userspace register at uprobe entry to label the direction.
gpu_memcpy_bytes_total(per direction label) - cumulative bytes.gpu_memcpy_duration_ms_bucket/_sum/_count(per direction label) - per-event histogram. Usehistogram_quantile()onrate(_bucket)for accurate percentiles.
The 2D variants emit direction=unknown because cudaMemcpyKind is the 7th parameter and not portably readable from BPF on amd64 + arm64.
NCCL metrics
eBPF uprobes on libnccl.so symbols (ncclAllReduce, ncclAllGather, ncclReduceScatter, ncclBcast, ncclSend, ncclRecv, etc.) at function entry + return. A runtime libnccl-discovery scanner finds PyTorch and pip-installed NCCL ABIs in /proc/PID/maps (no system-libnccl required) and attaches uprobes to each libnccl path on the fly.
gpu_nccl_collective_count(per op_type label) - total events.gpu_nccl_collective_bytes_total(per op_type label) - total bytes.gpu_nccl_collective_barrier_events(per op_type label) - barrier-shape collectives.gpu_nccl_process_loaded(with pid, comm, libnccl_path, libnccl_version labels) - per-PID gauge from discovery scanner.gpu_nccl_processes_total- count of discovered PIDs.
Why eBPF for data movement
nvidia-smi --query-gpu=memory.used polls device-state registers;
it cannot tell you whether the bytes flowed h2d, d2h, or d2d, and has no per-call latency. DCGM-exporter has the same limitation. Ingero's libcudart + libnccl uprobes capture every memcpy and every collective at the call boundary, so the per-direction breakdown + per-op_type breakdown both come from real call-site
data, not aggregate counters.
For NCCL specifically, the multi-libnccl-discovery is what makes this work on PyTorch + pip workloads, where libnccl ships inside the venv (e.g. $VENV/lib/python3.10/site-packages/torch/../nvidia/nccl/lib/libnccl.so.2) rather than a system path. Without runtime discovery the agent would attach to whatever libnccl was on LD_LIBRARY_PATH at boot, which is usually nothing useful for PyTorch wheels.
Companion dashboards
- Single-host set (this set): GPU Trace Overview (#25277), CUDA Op Profiler (#25278), GPU Data Movement (this one), GPU Memory & Throttle.
- Multi-node cluster set: GPU Cluster Overview (#25271), NCCL Stragglers (#25273), GPU Memcpy Bandwidth (#25274), GPU Memory Fragmentation (#25275), Per-Node Drill-Down (#25276).
- Fleet pipeline health: operator dashboard for the Ingero Fleet collector itself.
All published under https://grafana.com/orgs/ingero
Source
- Agent: https://github.com/ingero-io/ingero
- Dashboard JSON: https://github.com/ingero-io/ingero/tree/main/examples/grafana/single-node
- License: Apache-2.0
Issues, panel suggestions, dashboard PRs welcome on https://github.com/ingero-io/ingero/issues
Data source config
Collector config:
Upload an updated version of an exported dashboard.json file from Grafana
| Revision | Description | Created | |
|---|---|---|---|
| Download |