CUDA Op Profiler: per-op latency p50/p95/p99 (single host, eBPF)
Single-host CUDA Runtime + Driver operation profiler. Per-op p50/p95/p99 latency from eBPF uprobes on libcudart and libcuda. Find your slowest kernel: top-10 slowest p99 table, per-op timeseries, op rate. Covers cudaMemcpy, cudaLaunchKernel, cuLaunchKernel, cuMemAlloc_v2, cuCtxSynchronize, cuda graphs, host tracepoints.
What this dashboard shows
A single-host CUDA Runtime + Driver operation profiler. Per-op
p50 / p95 / p99 latency, captured by eBPF uprobes on libcudart
and libcuda. The "find my slow kernel" view.
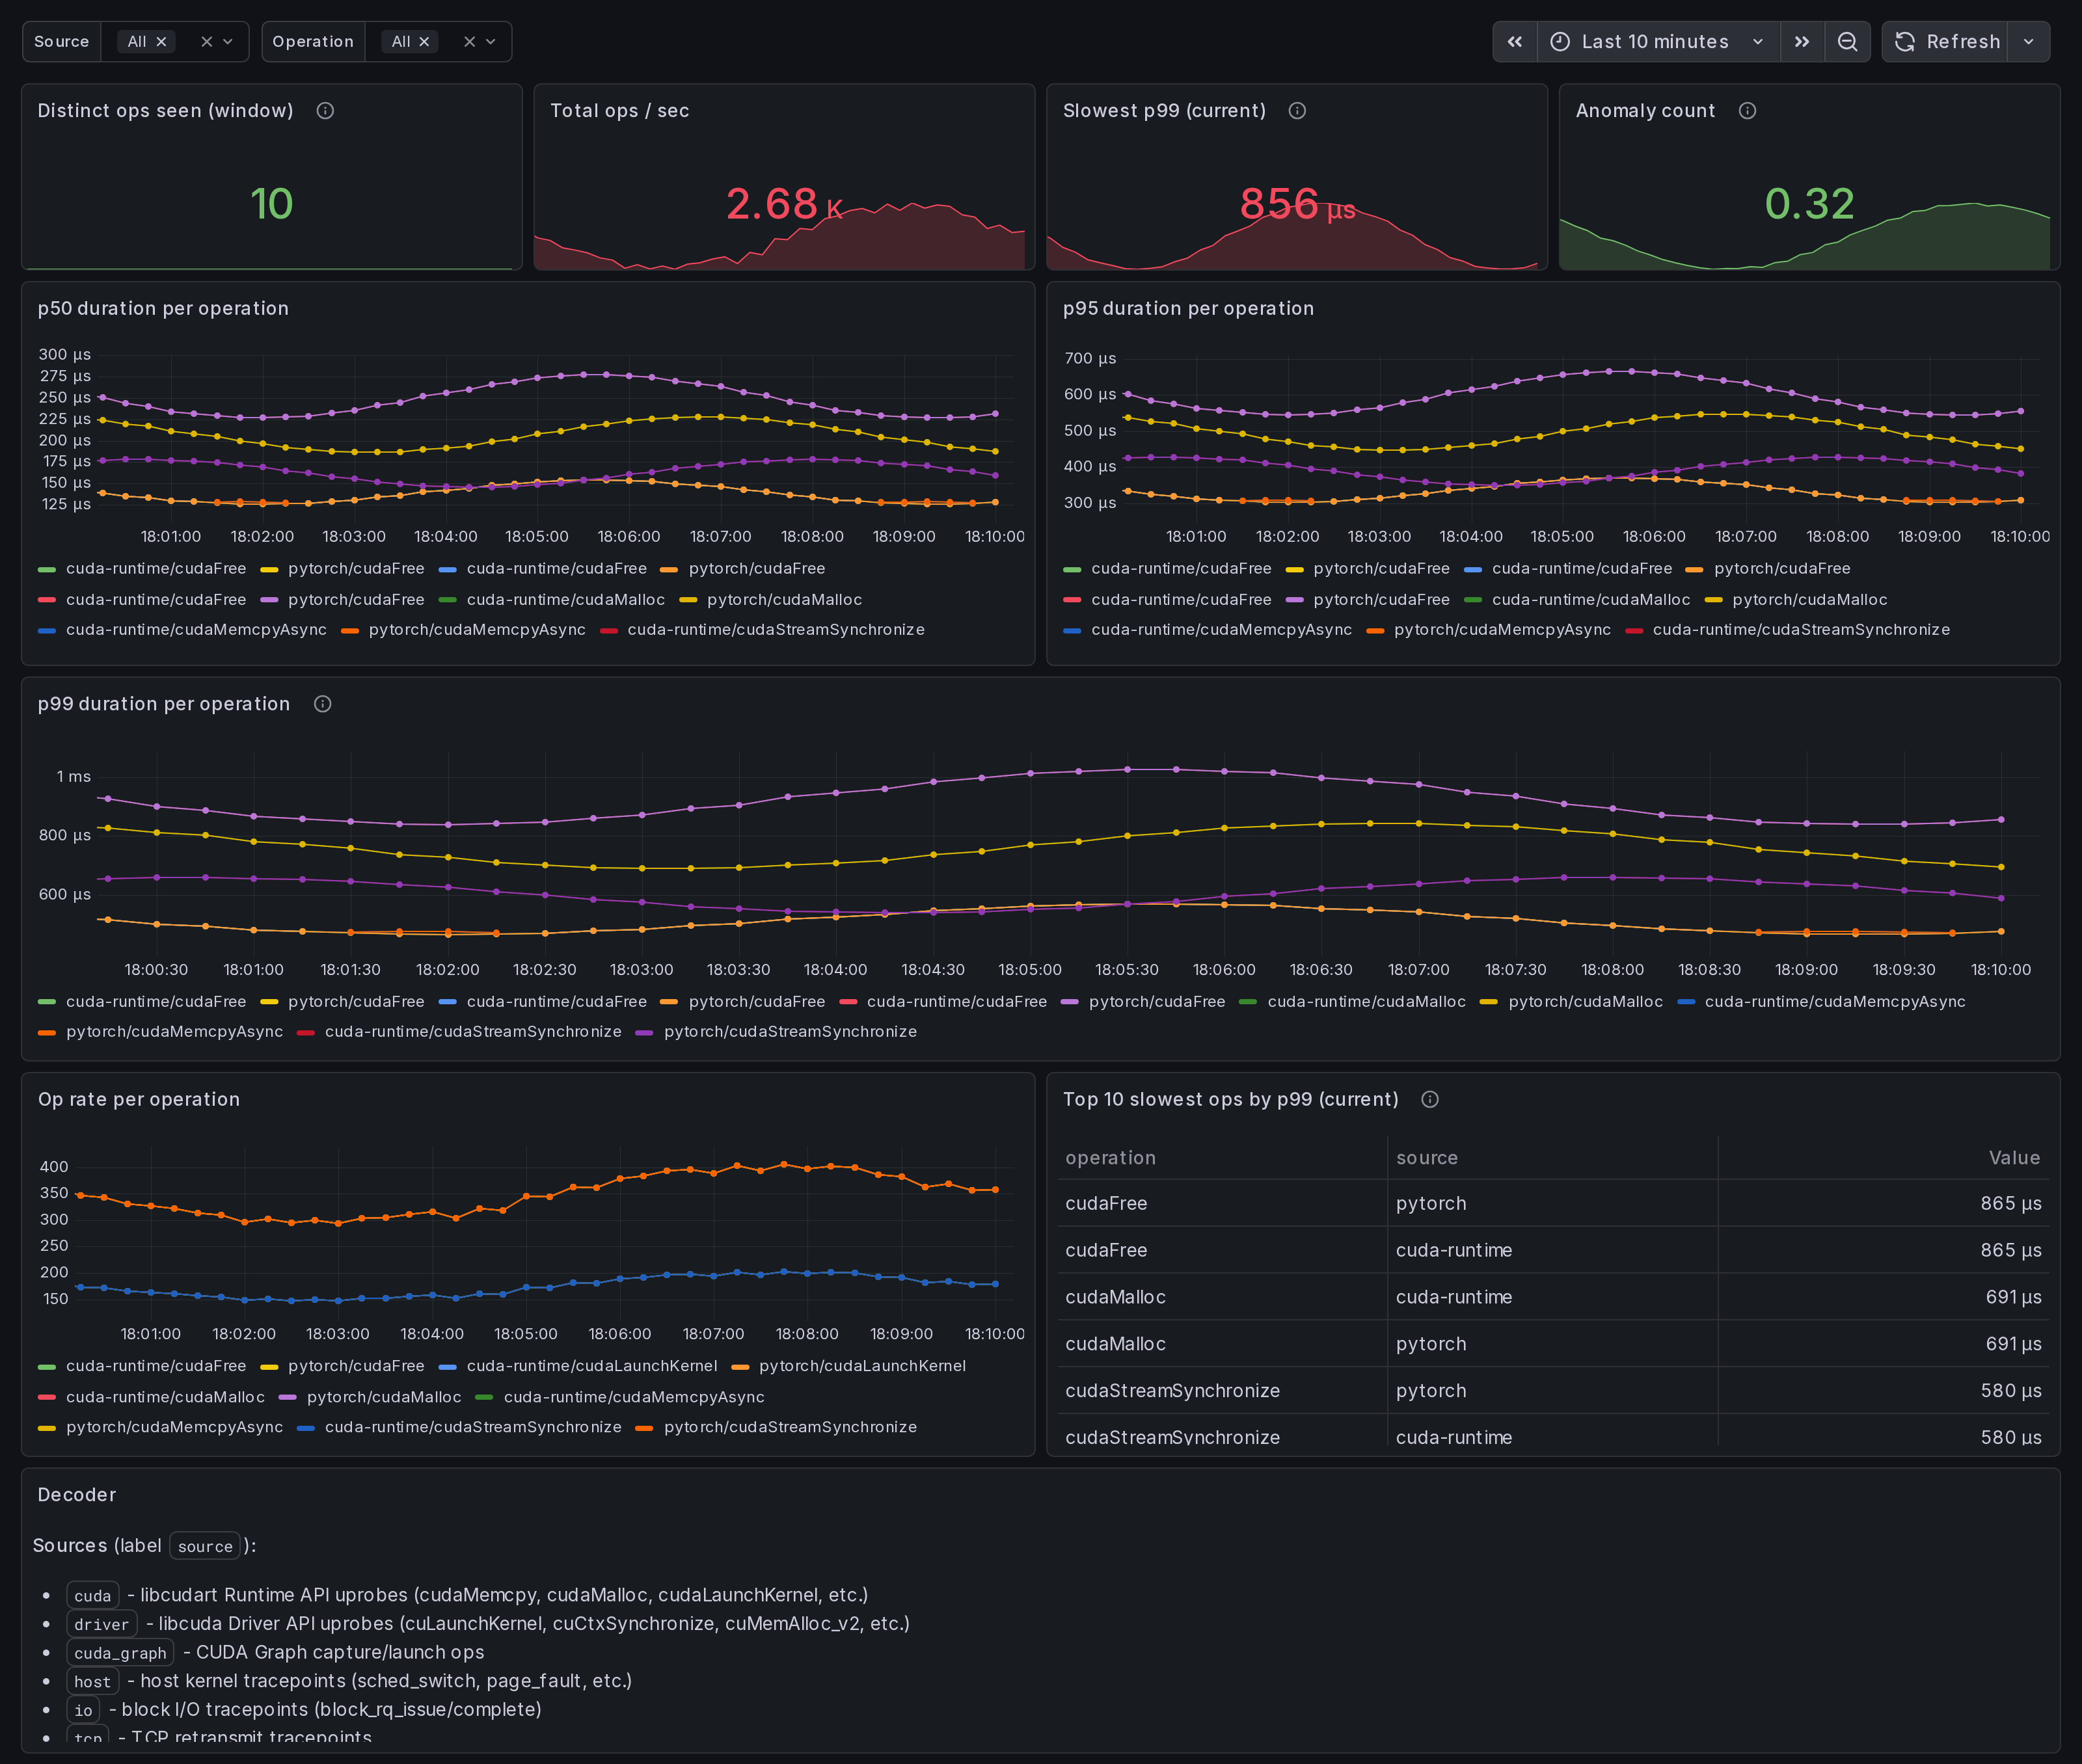
The headline panels:
- Slowest p99 (current) - top stat. Worst p99 across all selected ops in microseconds.
- p99 duration per operation - tail latency time series. Spikes here surface kernels that occasionally take much longer than their median (often hardware contention or compiler-output divergence).
- p50 / p95 duration per operation - median + tail.
- Op rate per operation - per-op frequency. A slow op that fires rarely matters less than a slow op that fires constantly.
- Top 10 slowest ops by p99 (table) - quick triage list.
- Anomaly count - rate of
ingero_anomaly_countfrom the agent's correlator output.
Source + operation template variables let you scope to a specific tracer (cuda / driver / cuda_graph / host / io / tcp / net) or specific op family (cudaMemcpy*, cudaMalloc*, cuLaunchKernel*, sched_switch, block_rq_*, etc).
Linux only. amd64 + arm64.
How the data is collected
Install the Ingero agent:
curl -sSL https://github.com/ingero-io/ingero/releases/latest/download/install.sh | bash
Run with the Prometheus exporter:
sudo ingero trace --prometheus :9090
Scrape and import:
Scrape :9090/metrics from your Prometheus / Grafana Alloy /
Grafana Cloud agent. Import this dashboard, pick your Prometheus
datasource.
The agent exposes per-op latency reservoirs via:
gpu_cuda_operation_duration_microseconds{source,operation,percentile}withpercentilein {p50, p95, p99}gpu_cuda_operation_count_total{source,operation}(cumulative rate)ingero_anomaly_count(correlator output)
Source decoder
The source label distinguishes which tracer captured the event:
cuda- libcudart Runtime API uprobes (cudaMemcpy, cudaMalloc, cudaLaunchKernel, cudaStreamSynchronize, etc.)driver- libcuda Driver API uprobes (cuLaunchKernel, cuCtxSynchronize, cuMemAlloc_v2, etc.)cuda_graph- CUDA Graph capture / launch opshost- host kernel tracepoints (sched_switch, page_fault, etc.)io- block I/O tracepoints (block_rq_issue / complete)tcp- TCP retransmit tracepointsnet- network socket syscalls (sendto / recvfrom)
Why eBPF over CUDA profilers
nvprof, nsys, and the CUPTI library all hook the CUDA driver
through the official profiling interface. They give detailed
single-process traces but require attaching at process start and
add measurable overhead. Ingero's libcudart + libcuda uprobes
attach to running processes (no recompile, no restart), have
sub-microsecond overhead per call, and produce continuous
per-percentile signals suitable for scraping.
The two are complementary: use Nsight Systems for one-time deep dives; use Ingero for continuous monitoring + alerting on production workloads.
Companion dashboards
- Single-host set (this set): GPU Trace Overview (#25277), CUDA Op Profiler (this one), GPU Data Movement, GPU Memory & Throttle.
- Multi-node cluster set: GPU Cluster Overview (#25271), NCCL Stragglers (#25273), GPU Memcpy Bandwidth (#25274), GPU Memory Fragmentation (#25275), Per-Node Drill-Down (#25276).
- Fleet pipeline health: operator dashboard for the Ingero Fleet collector itself.
All published under https://grafana.com/orgs/ingero
Source
- Agent: https://github.com/ingero-io/ingero
- Dashboard JSON: https://github.com/ingero-io/ingero/tree/main/examples/grafana/single-node
- License: Apache-2.0
Issues, panel suggestions, dashboard PRs welcome on https://github.com/ingero-io/ingero/issues
Data source config
Collector config:
Upload an updated version of an exported dashboard.json file from Grafana
| Revision | Description | Created | |
|---|---|---|---|
| Download |