NVIDIA GPU Trace Overview: CUDA, NCCL, memcpy, throttle
Single-host NVIDIA GPU dashboard. Per-operation CUDA latency (p50/p95/p99) from eBPF uprobes on libcudart + libcuda. NCCL collective rates, memcpy bandwidth by direction (h2d/d2h/d2d), GPU memory, throttle state. amd64 + arm64.
What this dashboard shows
A single-host view of NVIDIA GPU activity, captured by the
Ingero agent through eBPF uprobes on libcudart.so and
libcuda.so plus NVML / nvidia-smi polls. The hero dashboard
for the solo-engineer trial path: install the agent, run, see
everything on one screen.
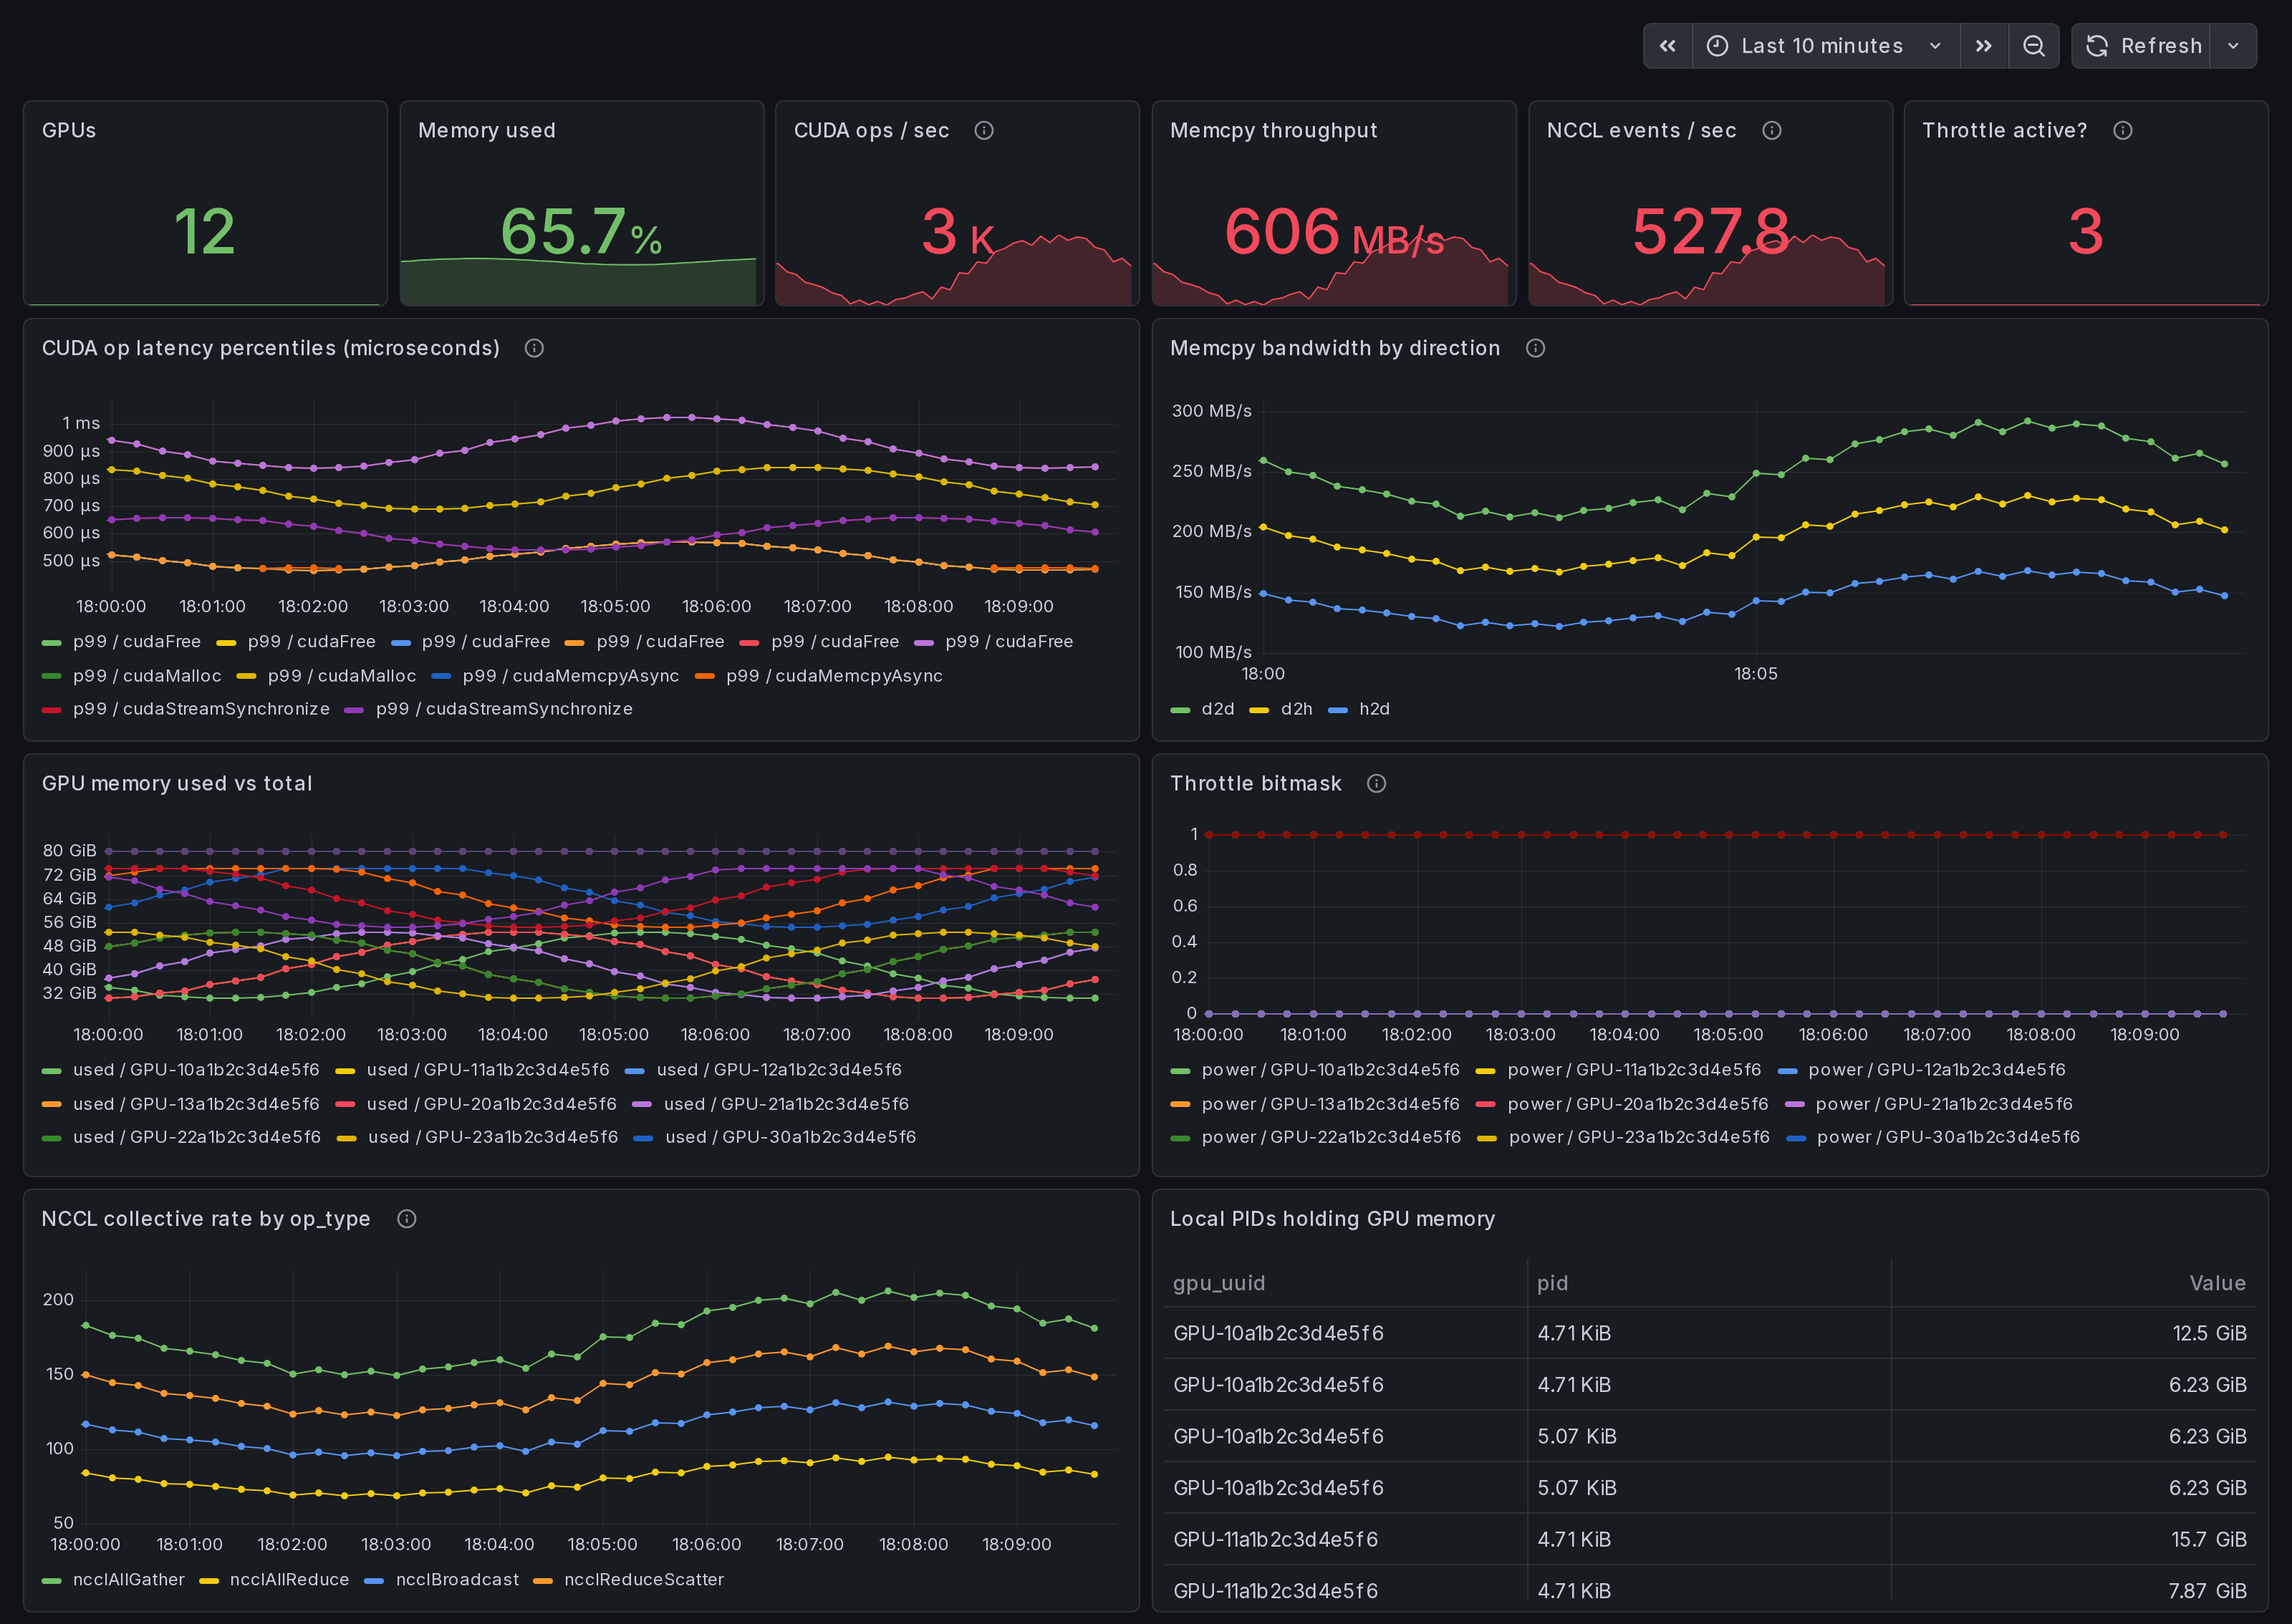
The headline panels:
- CUDA op latency p99 - top-10 slowest operations from
gpu_cuda_operation_duration_microseconds. Real wall-clock times forcudaMemcpy,cudaLaunchKernel,cuMemAlloc_v2,cuCtxSynchronize, etc., measured at the libcudart and libcuda boundaries. - Memcpy bandwidth by direction - h2d / d2h / d2d / default / unknown.
- GPU memory used vs total - one line per GPU.
- Throttle bitmask - power / thermal / sw / hw. Concurrent active = compound throttle.
- NCCL collective rate by op_type - locally fired
collectives if the agent ran with
--nccl. - Local PIDs holding GPU memory - process roster.
Linux only. amd64 + arm64.
How the data is collected
- Install the Ingero agent:
curl -sSL https://github.com/ingero-io/ingero/releases/latest/download/install.sh | bash
- Run with the Prometheus exporter:
sudo ingero trace --prometheus :9090
Scrape
:9090/metricsfrom your Prometheus / Grafana Alloy / Grafana Cloud agent.Import this dashboard, pick your Prometheus datasource.
The agent's metrics namespace is gpu_* (Prometheus-format) /
gpu.* (OTLP). Full list: see the
agent's CHANGELOG.
Why eBPF
Polling via NVML / nvidia-smi misses sub-second CUDA call shape.
Ingero attaches uprobes directly to libcudart + libcuda so
every CUDA Runtime / Driver call is captured at function entry +
return, yielding real per-call duration (not averaged), exposed
as gpu_cuda_operation_duration_microseconds{percentile=p50|p95|p99}.
DCGM-exporter and nvidia-smi --query-gpu cannot do this; they
poll device-state registers, not function calls.
Companion dashboards
- Single-host set (this set): GPU Trace Overview (this one), CUDA Op Profiler, GPU Data Movement (memcpy + NCCL on one host), GPU Memory & Throttle.
- Multi-node cluster set (paired with Ingero Fleet collector): GPU Cluster Overview (#25271), NCCL Stragglers (#25273), GPU Memcpy Bandwidth (#25274), GPU Memory Fragmentation (#25275), Per-Node Drill-Down (#25276).
- Fleet pipeline health: operator dashboard for the Ingero Fleet collector itself.
All published under https://grafana.com/orgs/ingero
Source
- Agent: https://github.com/ingero-io/ingero
- Dashboard JSON: https://github.com/ingero-io/ingero/tree/main/examples/grafana/single-node
- License: Apache-2.0
Issues, panel suggestions, dashboard PRs welcome on https://github.com/ingero-io/ingero/issues
Data source config
Collector config:
Upload an updated version of an exported dashboard.json file from Grafana
| Revision | Description | Created | |
|---|---|---|---|
| Download |