Per-Node GPU Drill-Down: CUDA, NCCL, memcpy, throttle, kernel launch
Per-node NVIDIA GPU drill-down dashboard. Pick a node from the variable; everything filters to that host. Per-GPU memory + throttle, NCCL collective rates, memcpy duration percentiles, IOCTL event rates per cmd, kernel launch threads-per-block percentiles. Use after cluster overview surfaces a candidate.
What this dashboard shows
A per-node GPU drill-down. Pick a node from the variable; every panel below filters to that host. Use after the cluster overview or the straggler dashboard surfaces a candidate.
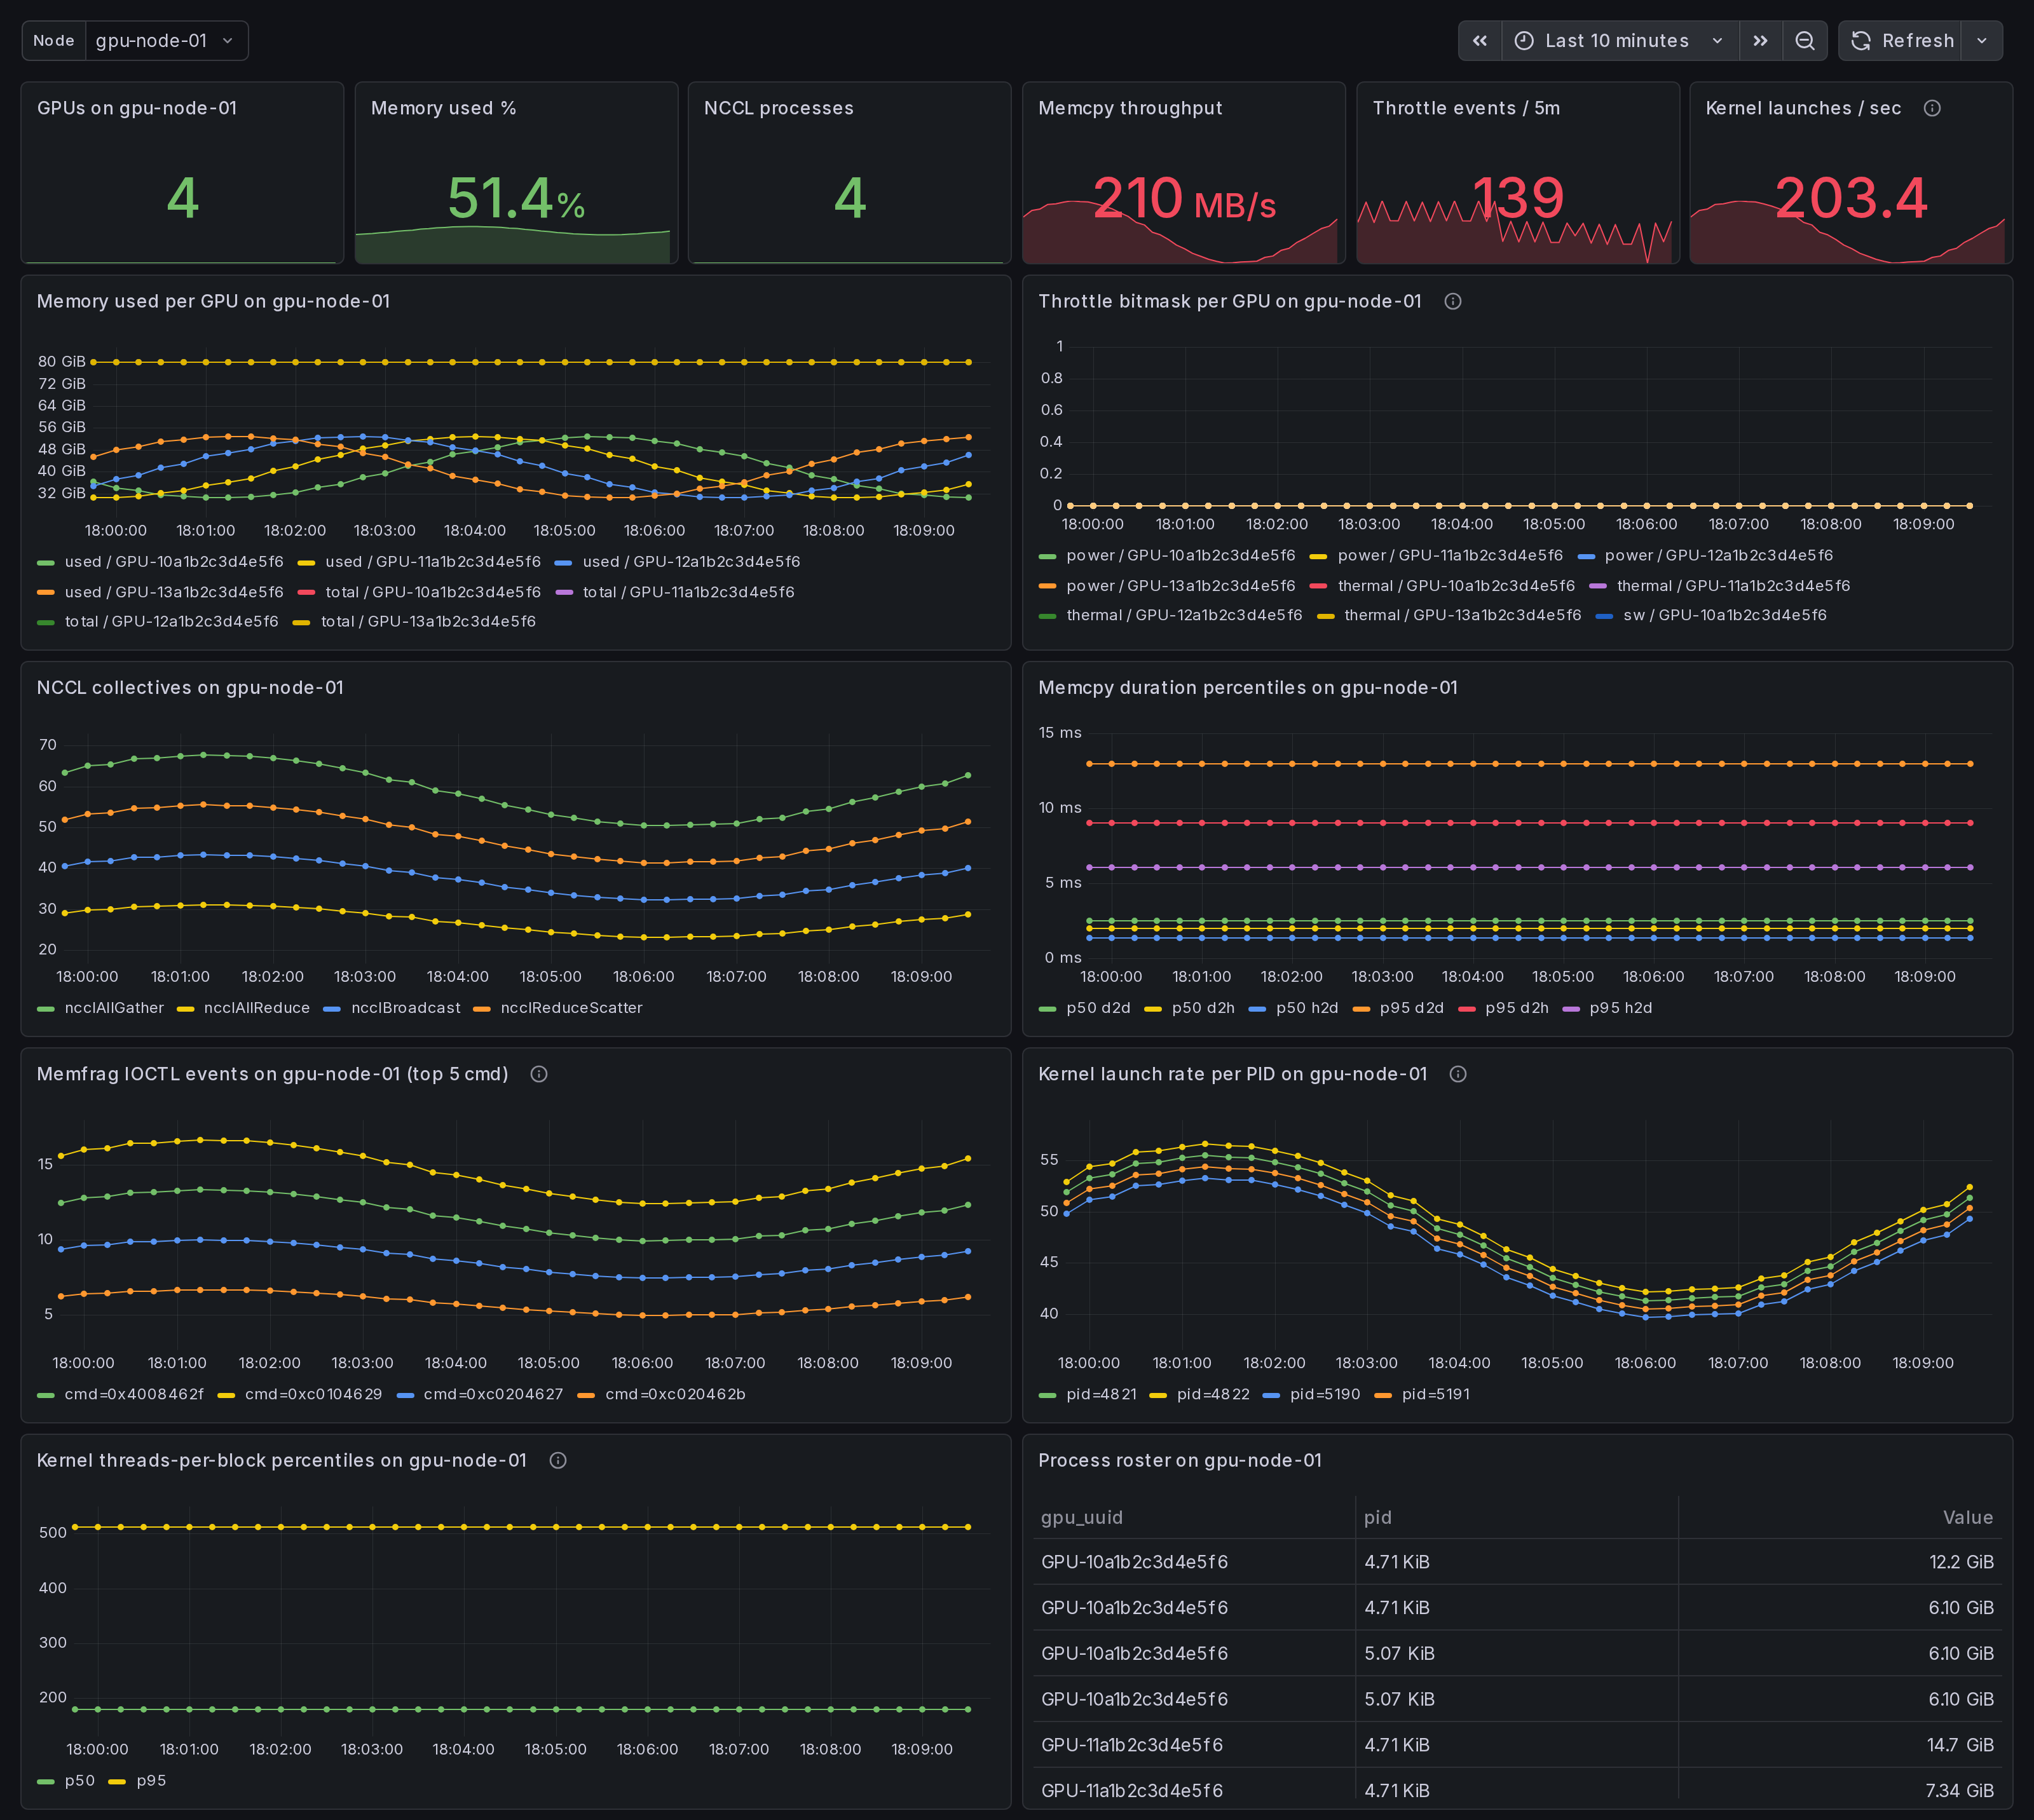
The headline panels:
- Stat row - GPUs on $node, memory used %, NCCL processes, memcpy throughput, throttle events / 5m, kernel launches / sec.
- Memory used per GPU on $node - one series per GPU.
- Throttle bitmask per GPU on $node - power / thermal / sw / hw. Concurrent active buckets = compound throttle.
- NCCL collectives on $node - per-op_type rate.
- Memcpy duration percentiles on $node - p50 / p95 per direction
from the
gpu_memcpy_duration_mshistogram. - Memfrag IOCTL events on $node - top 5 cmd codes by rate
(experimental, requires
--enable-experimental-kprobes). - Kernel launch rate per PID - per-process cuLaunchKernel rate (experimental).
- Kernel threads-per-block percentiles - p50 / p95. Outliers near the high end (>512) often saturate registers; near the low end (<64) under-utilize SMs (experimental).
- Process roster on $node - PIDs holding GPU memory.
Linux only. amd64 + arm64 agents.
How the data is collected
The Ingero agent on $node emits everything:
- libcudart + libcuda eBPF uprobes (CUDA op latency, memcpy)
- libnccl runtime-discovery uprobes (NCCL collective events)
- NVML /
nvidia-smipolls (memory, throttle, fragmentation) - Optional kprobes on
nvidia_unlocked_ioctlandcuLaunchKernel(experimental kernel-launch dims + memfrag IOCTL counters)
Boot the agent:
sudo ingero trace --nccl --enable-experimental-kprobes --prometheus :9090
Cluster aggregation via Prometheus / Grafana Alloy / Grafana Cloud
scrape, OR via OTLP push to the Ingero Fleet collector + Echo store.
The dashboard's node template variable is populated from
label_values(gpu_memory_total_bytes, instance), so any host that
has reported memory metrics shows up in the dropdown.
Install agent: https://github.com/ingero-io/ingero Install Fleet: https://github.com/ingero-io/ingero-fleet
When to use this vs the cluster set
The cluster overview / straggler / memcpy / memfrag dashboards answer "where in the fleet is the problem?" This dashboard answers "now that I know which node is the problem, what specifically is wrong on it?"
Typical investigation flow:
- Open GPU Cluster Overview - see throttle event spikes or bandwidth anomalies cluster-wide.
- Open NCCL Stragglers - find the offending rank by p99.
- Drop into this Per-Node Drill-Down with that instance selected - see per-GPU memory state, per-PID kernel launches, throttle history, memfrag IOCTL volume in one view.
For workstation / single-host trial (no fleet), use the
single-host set instead - it has the same panels with simpler
defaults and no instance template variable.
Companion dashboards
- Cluster set (multi-node aggregation): GPU Cluster Overview, NCCL Stragglers, GPU Memcpy Bandwidth, GPU Memory Fragmentation. All published under https://grafana.com/orgs/ingero
- Single-host: GPU Trace Overview, CUDA Op Profiler, GPU Data Movement, GPU Memory & Throttle.
- Fleet pipeline health: the operator dashboard for the Ingero Fleet collector itself.
Source
- Agent: https://github.com/ingero-io/ingero
- Fleet collector: https://github.com/ingero-io/ingero-fleet
- Dashboard JSON: https://github.com/ingero-io/ingero-fleet/tree/main/examples/grafana/cluster
- License: Apache-2.0
Issues, panel suggestions, dashboard PRs welcome on https://github.com/ingero-io/ingero-fleet/issues
Data source config
Collector config:
Upload an updated version of an exported dashboard.json file from Grafana
| Revision | Description | Created | |
|---|---|---|---|
| Download |