GPU Memory Fragmentation: OOM on half-full GPU debug (multi-node)
Multi-node NVIDIA GPU memory fragmentation dashboard. Per-GPU used/free/total, fragmentation estimate (heuristic), top processes by allocation, IOCTL event volume per cmd code (experimental kprobe on nvidia_unlocked_ioctl). For OOM-on-half-full-GPU debugging across the cluster.
What this dashboard shows
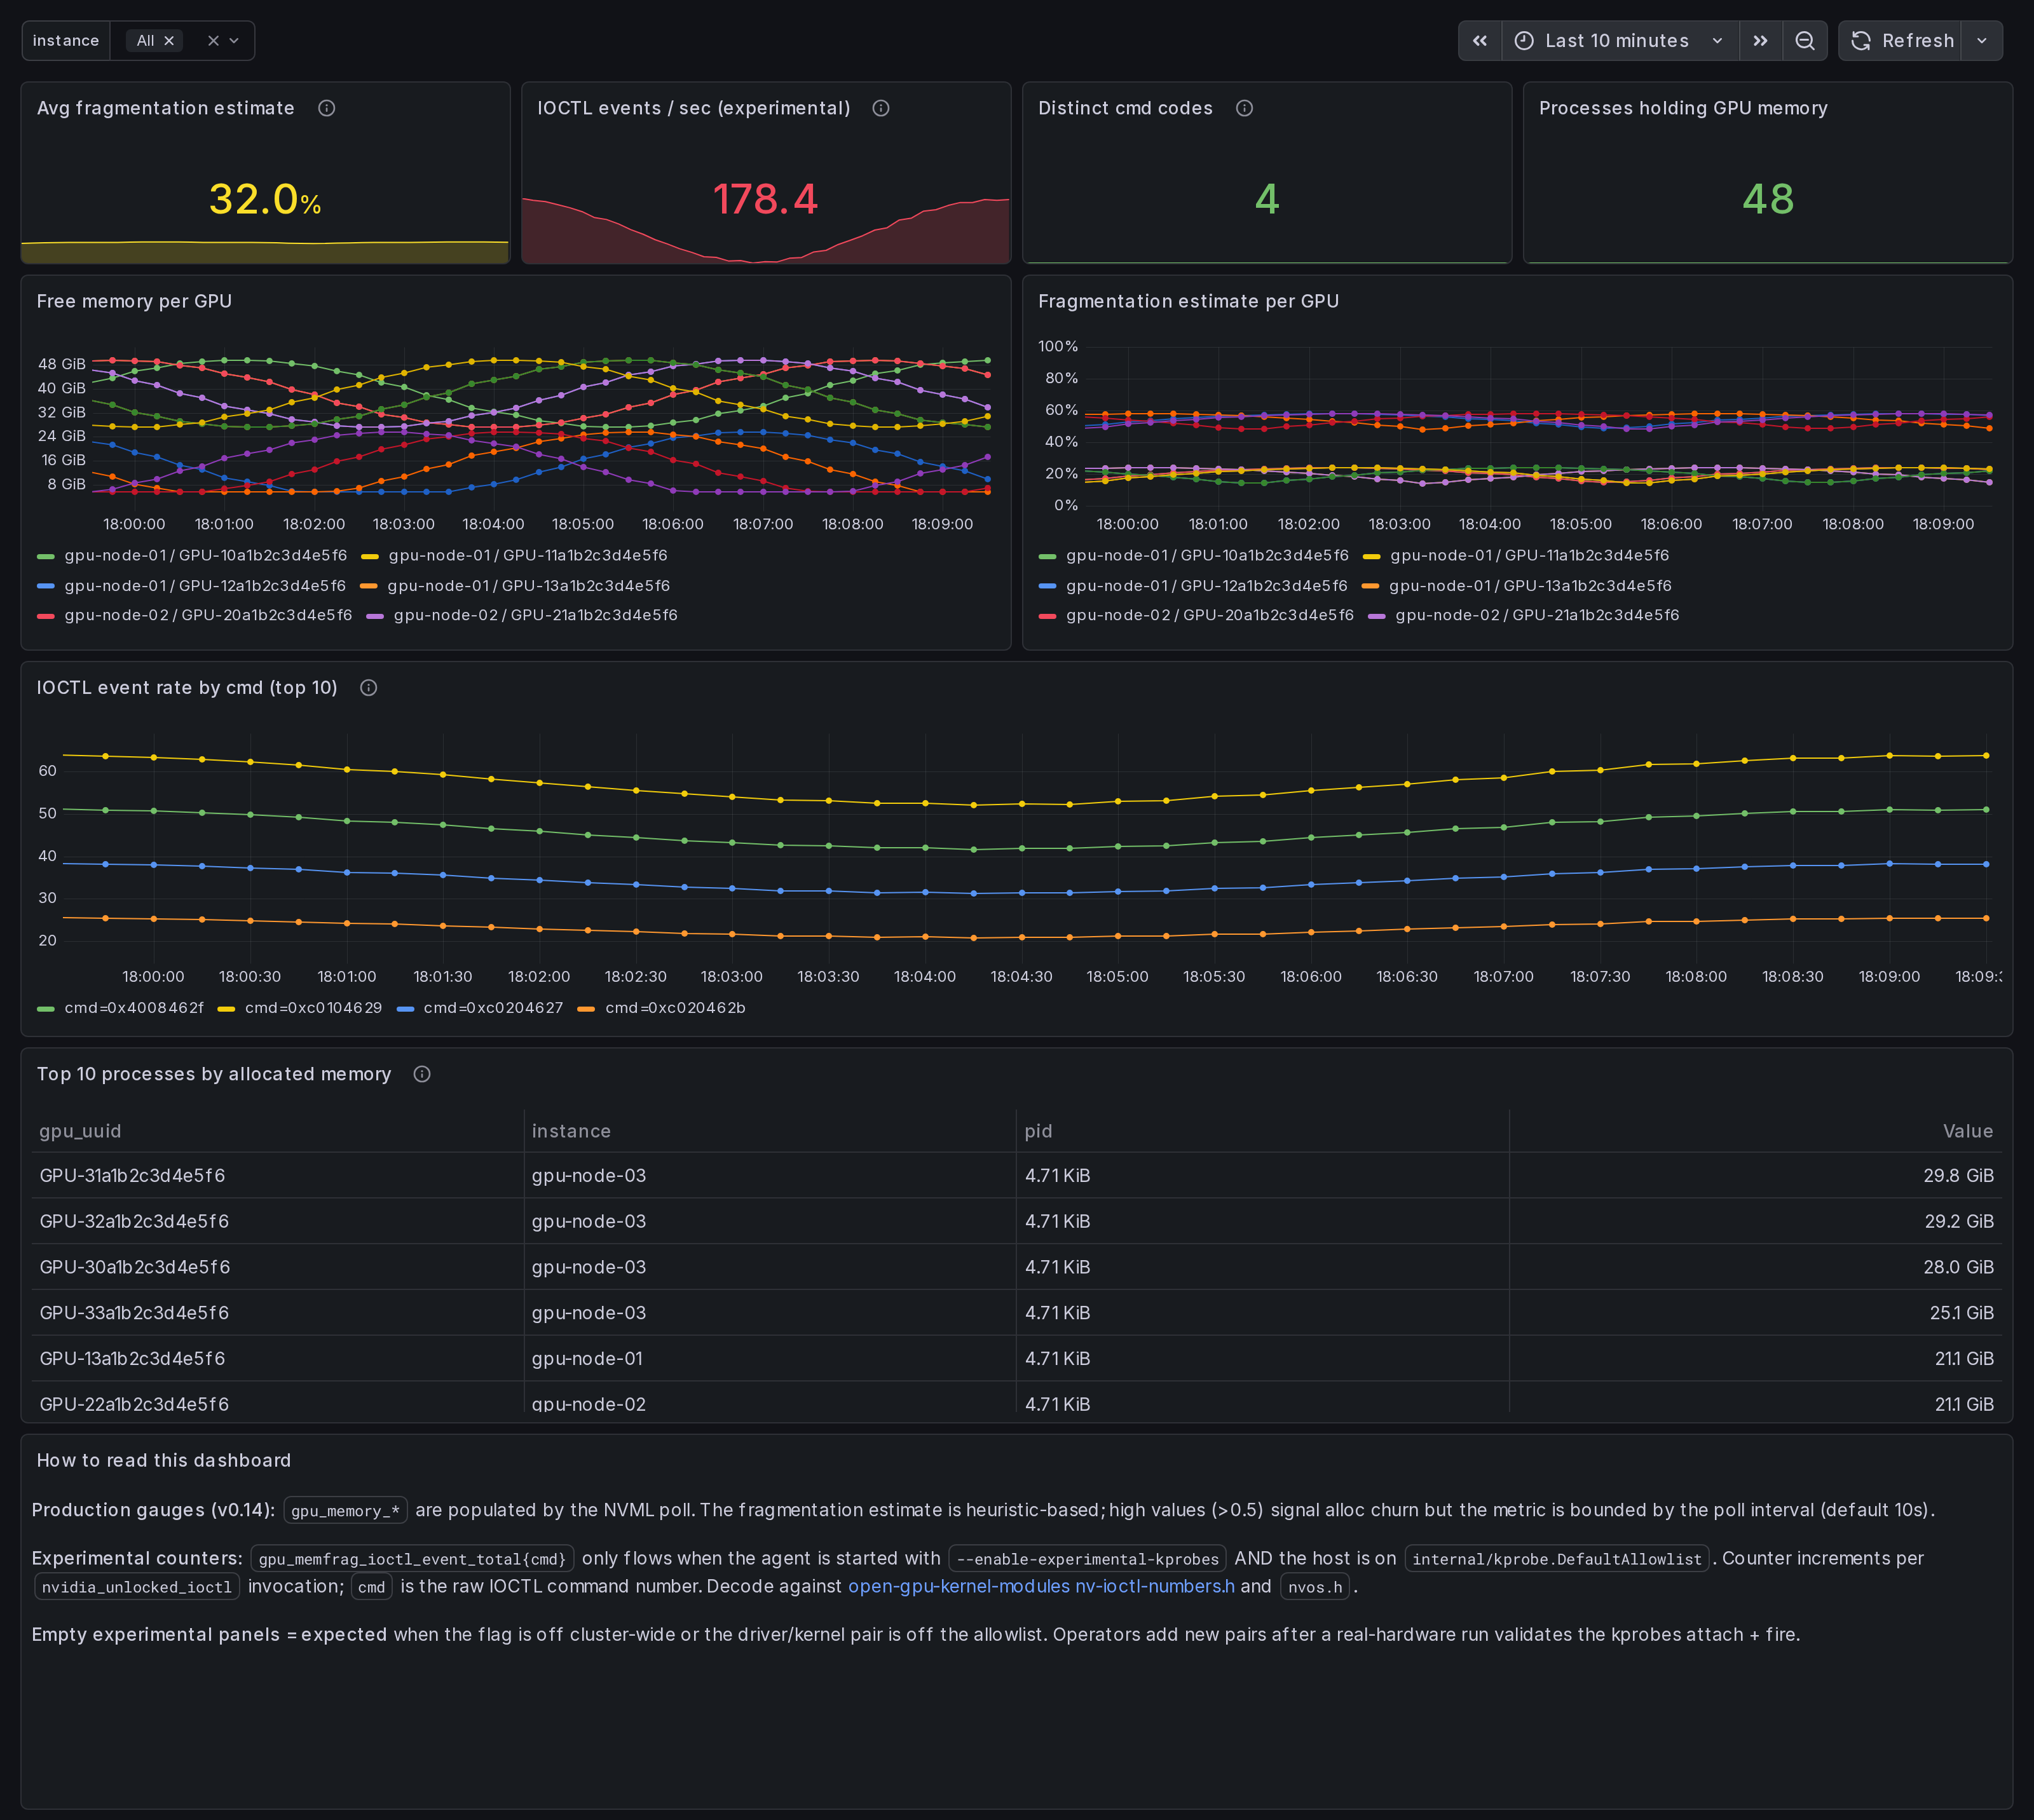
A multi-node NVIDIA GPU memory fragmentation view. For the "my GPU is half-empty but allocations fail" debugging case across a cluster.
The headline panels:
- Avg fragmentation estimate - across selected GPUs. Heuristic:
1 - (largest free block / total free). 0 = unfragmented; 1 = fully fragmented. - Free memory + fragmentation per GPU - time series. Spikes correlate with alloc churn (DataLoader rebuilds, optimizer state shuffles, KV-cache reset).
- IOCTL events / sec + distinct cmd codes - aggregate
signal from the experimental memfrag IOCTL kprobe. Higher rate
- more diverse cmd codes = more memory operations underway.
- Top 10 IOCTL events by cmd - per-cmd time series. Decode
cmd values against
nv-ioctl-numbers.handnvos.hfrom NVIDIA'sopen-gpu-kernel-modulesrepo to map raw codes to RM operation kinds. - Top 10 processes by allocated memory - from
gpu_memory_process_allocated_bytes.
Linux only. amd64 + arm64 agents.
How the data is collected
Two metric families feed this dashboard:
Production (always emitted)
NVML / nvidia-smi --query-gpu polls every
--memfrag-poll-interval (default 10s):
gpu_memory_used_bytes{gpu_uuid}/_free_bytes/_total_bytesgpu_memory_fragmentation_estimate{gpu_uuid}(heuristic)gpu_memory_process_allocated_bytes{gpu_uuid,pid}(fromnvidia-smi --query-compute-apps)
Experimental (gated behind --enable-experimental-kprobes)
Per-cmd nvidia driver IOCTL counter:
gpu_memfrag_ioctl_event_total{cmd}
Backed by an eBPF kprobe attached to nvidia_unlocked_ioctl in
the closed NVIDIA driver. Emits one ringbuf event per IOCTL
invocation; the cmd arg is recorded raw. Only loads when the
running NVIDIA driver + Linux kernel pair is on
internal/kprobe.DefaultAllowlist. Off-allowlist hosts surface
a startup warning and the experimental panels stay empty.
Boot the agent:
sudo ingero trace --enable-experimental-kprobes --prometheus :9090
Cluster aggregation via Prometheus / Grafana Alloy / Grafana Cloud scrape, OR via OTLP push to the Ingero Fleet collector + Echo store.
Install agent: https://github.com/ingero-io/ingero Install Fleet: https://github.com/ingero-io/ingero-fleet
How to read the heuristic
The fragmentation estimate is a coarse signal. Values above ~0.6 across multiple sequential polls usually correlate with:
- Alloc / free churn (DataLoader workers, KV-cache reset)
- Mixed-size allocator pressure (a single PyTorch process running variable-batch inference, or a Triton server hot-reloading models)
- Driver-side fragmentation that survives
cudaMemPooltrimming
For the actual allocator-level signal (per-cmd IOCTL volume),
turn on --enable-experimental-kprobes and watch the bottom panel.
Companion dashboards
- Cluster set (multi-node aggregation): GPU Cluster Overview, NCCL Stragglers, GPU Memcpy Bandwidth, Per-Node GPU Drill-Down. All published under https://grafana.com/orgs/ingero
- Single-host: GPU Trace Overview, CUDA Op Profiler, GPU Data Movement, GPU Memory & Throttle.
- Fleet pipeline health: the operator dashboard for the Ingero Fleet collector itself.
Source
- Agent: https://github.com/ingero-io/ingero
- Fleet collector: https://github.com/ingero-io/ingero-fleet
- Dashboard JSON: https://github.com/ingero-io/ingero-fleet/tree/main/examples/grafana/cluster
- License: Apache-2.0
Issues, panel suggestions, dashboard PRs welcome on https://github.com/ingero-io/ingero-fleet/issues
Data source config
Collector config:
Upload an updated version of an exported dashboard.json file from Grafana
| Revision | Description | Created | |
|---|---|---|---|
| Download |