GPU Memcpy Bandwidth: h2d / d2h / d2d, latency percentiles (multi-node)
Multi-node CUDA memcpy bandwidth dashboard. Per-direction throughput (h2d, d2h, d2d, peer, default), per-direction latency p50/p95/p99 from per-event histogram. Surfaces data-pipeline bottlenecks (h2d-d2h skew = CPU-bound prep; d2d dominance = peer-copy hot path). eBPF uprobes on libcudart cudaMemcpy*.
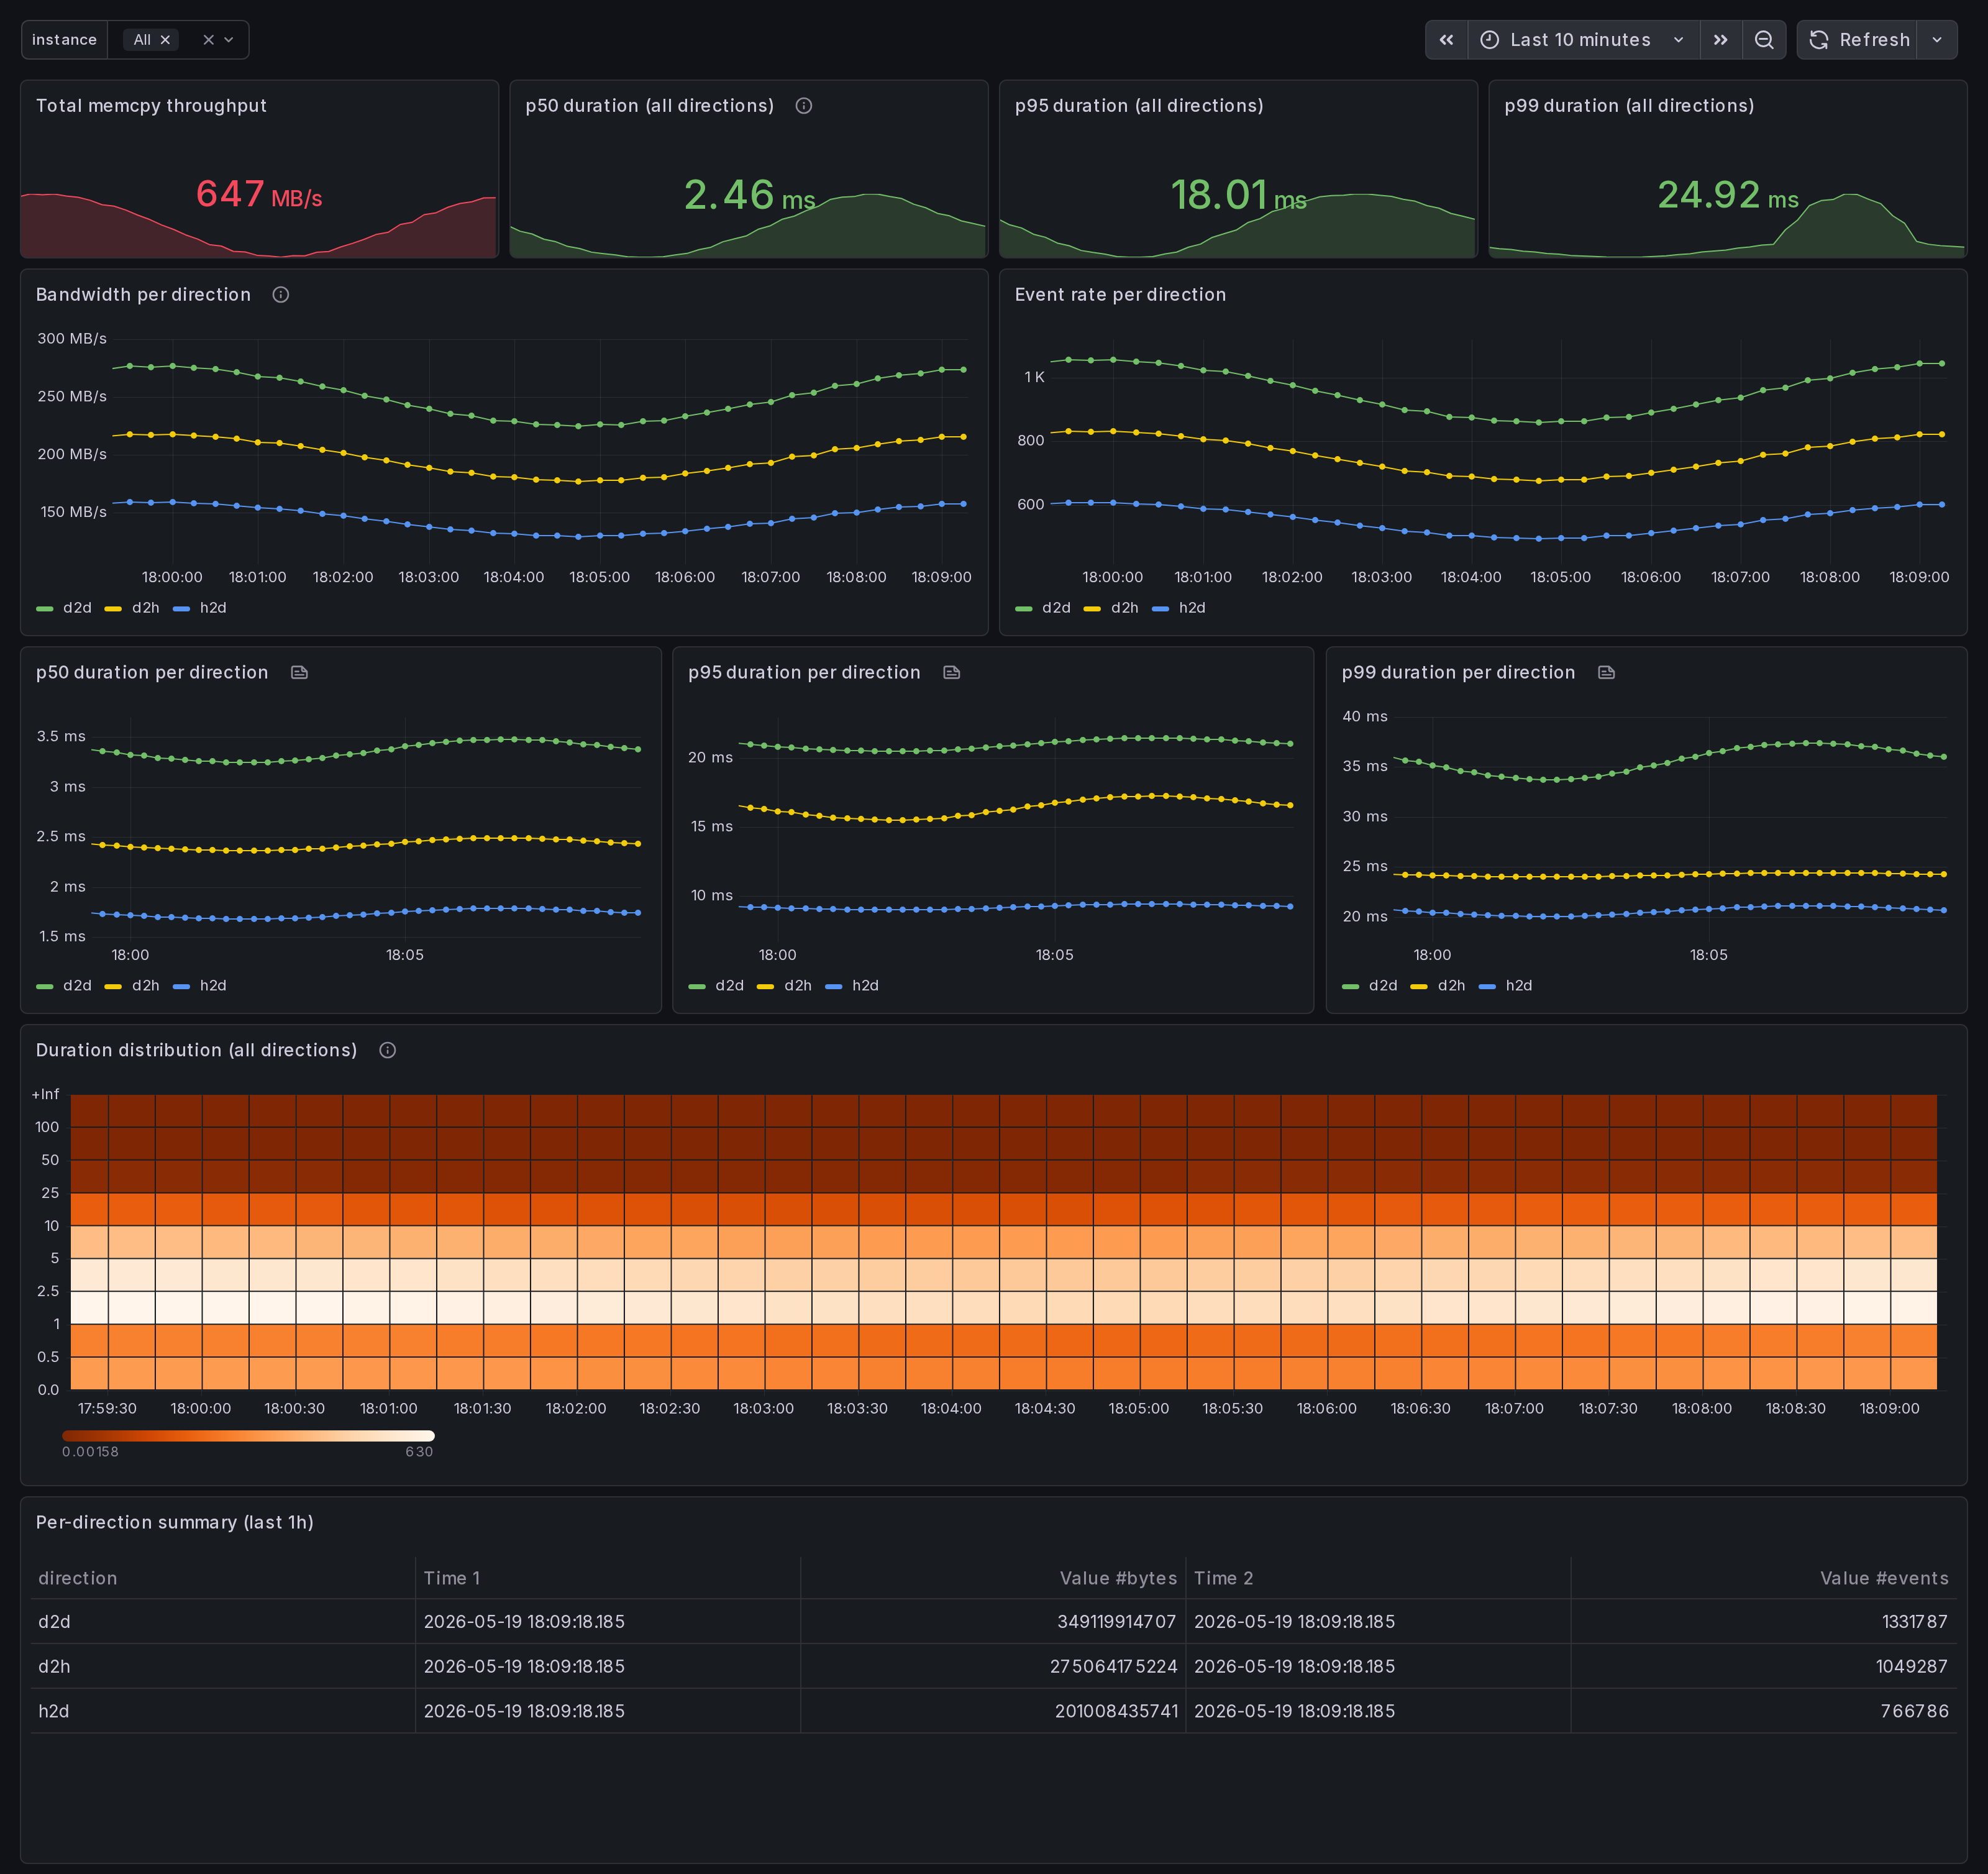
What this dashboard shows
A multi-node CUDA memcpy bandwidth view, broken out by direction
(h2d, d2h, d2d, default, unknown). Built for ML pipeline
engineers debugging data-pipeline bottlenecks across a cluster.
The headline panels:
- Bandwidth per direction - rate of
gpu_memcpy_bytes_totalper direction. h2d-d2h skew = data-pipeline imbalance (CPU-bound prep). d2d dominance = peer-copy or in-GPU shuffle hot path. - p50 / p95 / p99 duration per direction - per-event latency
percentiles from the
gpu_memcpy_duration_mshistogram. Tail latency surfaces transient contention; sustained p99 elevation surfaces structural memcpy-shape problems. - Heatmap (all directions) - duration distribution over time. Right-skewed clusters = tail latency. Bimodal clusters = two distinct memcpy shapes interleaving.
- Per-direction summary table (1h) - cumulative bytes + event counts. Quick way to confirm which direction owns the volume.
Linux only. amd64 + arm64 agents.
How the data is collected
Each node runs the Ingero agent with the Prometheus exporter:
sudo ingero trace --prometheus :9090
The agent attaches eBPF uprobes to libcudart cudaMemcpy* symbols
(cudaMemcpy, cudaMemcpyAsync, cudaMemcpy2D, cudaMemcpy2DAsync,
cudaMemcpyPeer, cudaMemcpyPeerAsync) at function entry + return.
The cudaMemcpyKind argument is read from the userspace register
at uprobe entry to label the direction.
Two metric families per direction:
gpu_memcpy_bytes_total{direction}- cumulative bytes counter. Sum-of-rates on this gives cluster-wide bandwidth.gpu_memcpy_duration_ms_{bucket,sum,count}{direction}- per-event histogram.histogram_quantile()overrate(_bucket)gives accurate per-direction percentiles.
The 2D variants emit direction=unknown because cudaMemcpyKind is
gpu_memcpy_duration_ms_{bucket,sum,count}{direction}- per-event histogram.histogram_quantile()overrate(_bucket)gives accurate per-direction percentiles.
The 2D variants emit direction=unknown because cudaMemcpyKind is
the 7th parameter and not portably readable from BPF on amd64 + arm64.
Cluster aggregation comes from your Prometheus / Grafana Alloy / Grafana Cloud agent scraping all nodes, OR from pushing OTLP to the Ingero Fleet collector and Echo store.
Install agent: https://github.com/ingero-io/ingero Install Fleet: https://github.com/ingero-io/ingero-fleet
Why eBPF for memcpy
nvidia-smi and DCGM-exporter expose throughput counters but no
per-call duration. Ingero's libcudart uprobes capture every
memcpy at the function boundary, yielding per-event duration
(not averaged) and per-event bytes counted at the call site.
The histogram exposition gives accurate percentiles via standard
histogram_quantile() on Prometheus rather than averages.
Companion dashboards
- Cluster set (multi-node aggregation): GPU Cluster Overview, NCCL Stragglers, GPU Memory Fragmentation, Per-Node GPU Drill-Down. All published under https://grafana.com/orgs/ingero
- Single-host: GPU Trace Overview, CUDA Op Profiler, GPU Data Movement (memcpy + NCCL on one host), GPU Memory & Throttle.
- Fleet pipeline health: the operator dashboard for the Ingero Fleet collector itself (peer-relative median + MAD across the cluster). Different metrics, different audience.
Source
- Agent: https://github.com/ingero-io/ingero
- Fleet collector: https://github.com/ingero-io/ingero-fleet
- Dashboard JSON: https://github.com/ingero-io/ingero-fleet/tree/main/examples/grafana/cluster
- License: Apache-2.0
Issues, panel suggestions, dashboard PRs welcome on https://github.com/ingero-io/ingero-fleet/issues
Data source config
Collector config:
Upload an updated version of an exported dashboard.json file from Grafana
| Revision | Description | Created | |
|---|---|---|---|
| Download |