NCCL Stragglers: distributed training slowdown finder (multi-GPU)
Multi-node NCCL straggler dashboard. Top-N nodes by collective byte volume, per-op_type bandwidth (ncclAllReduce, ncclAllGather, ncclReduceScatter, ncclBcast, ncclSend/Recv), barrier-event ratio, per-rank rates. Find which node is dragging down distributed PyTorch / FSDP / DeepSpeed training. eBPF uprobes on libnccl.so.
NCCL Stragglers: distributed training slowdown finder (multi-GPU)
Find which node is dragging down distributed PyTorch / FSDP / DeepSpeed training by surfacing per-node NCCL collective-op volume, bandwidth, and barrier-wait ratio across the cluster.
What it shows
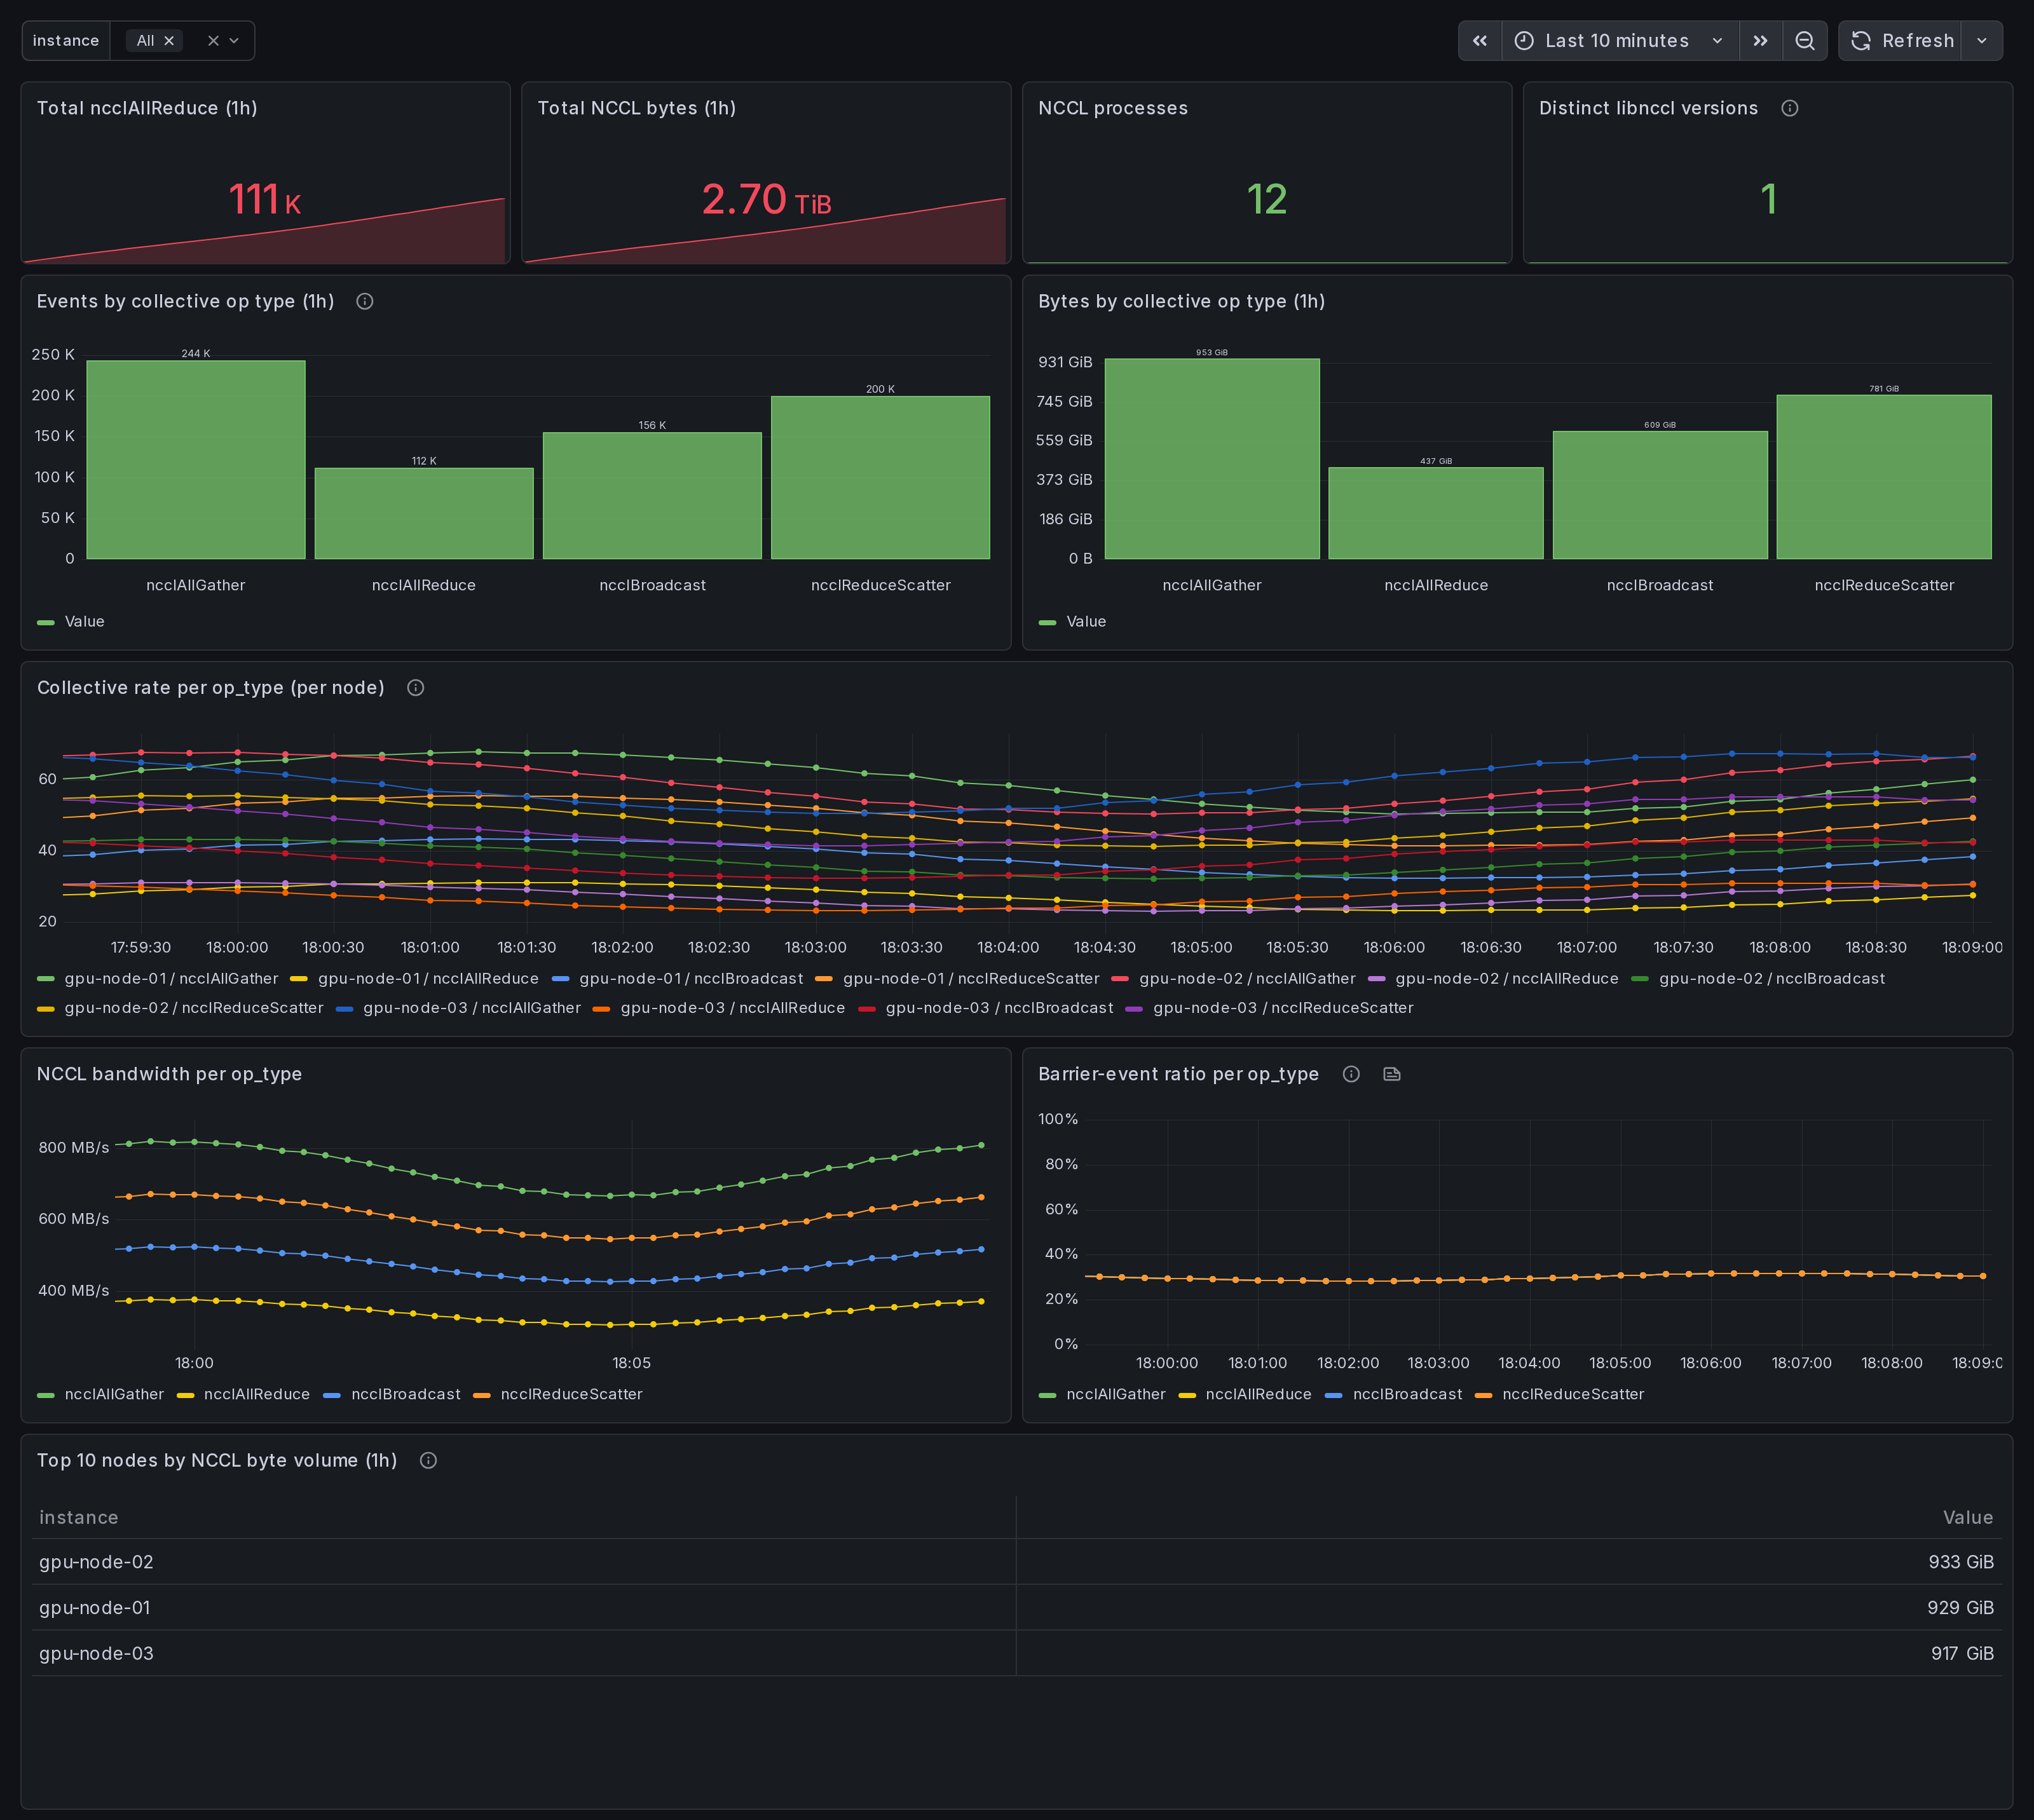
- Cluster-wide totals over the last hour: ncclAllReduce count, total NCCL bytes, NCCL-loaded processes, distinct libnccl versions.
- Event volume and byte volume broken out per collective op type (
ncclAllReduce,ncclAllGather,ncclReduceScatter,ncclBcast,ncclSend/ncclRecv). - Per-node collective rate and per-op-type bandwidth as time series.
- Barrier-event ratio per op type (a fast read on synchronization tax).
- Top 10 nodes by NCCL byte volume in the last hour, ranked - the candidate straggler list.
How it helps
Stragglers in distributed training are usually invisible to per-node GPU dashboards. Each rank's GPU looks busy, but one rank is consistently late to the collective, and every other rank waits at the barrier. This dashboard sorts on the right axis (per-node byte volume + barrier-wait ratio) so the laggard is the row that stands out.
Typical use:
- Cluster overview tells you training throughput dropped.
- Open this dashboard, scope to the same time range.
- The "Top 10 nodes by NCCL byte volume" table and the per-node "Collective rate per op_type" panel surface the outlier rank.
- Drill into that node with the "Per-Node Drilldown" dashboard (Grafana ID 25276).
Requirements
- Data source: Prometheus, scraping the Ingero agent's
/metricsendpoint on every node in the training cluster. - Agent: Ingero v0.15 or newer. Older agents do not expose the
gpu_nccl_*metric family. - Metrics consumed:
gpu_nccl_collective_count,gpu_nccl_collective_bytes_total,gpu_nccl_collective_barrier_events,gpu_nccl_processes_total,gpu_nccl_process_loaded. All emitted by the agent's libnccl.so uprobes when an NCCL-using process is
- The "Top 10 nodes by NCCL byte volume" table and the per-node "Collective rate per op_type" panel surface the outlier rank.
- Drill into that node with the "Per-Node Drilldown" dashboard (Grafana ID 25276).
Requirements
- Data source: Prometheus, scraping the Ingero agent's
/metricsendpoint on every node in the training cluster. - Agent: Ingero v0.15 or newer. Older agents do not expose the
gpu_nccl_*metric family. - Metrics consumed:
gpu_nccl_collective_count,gpu_nccl_collective_bytes_total,gpu_nccl_collective_barrier_events,gpu_nccl_processes_total,gpu_nccl_process_loaded. All emitted by the agent's libnccl.so uprobes when an NCCL-using process is detected on the host. - Variables:
$instance(multi-value, populated from any of the metrics above).
How to install
In Grafana, Dashboards → New → Import, paste the dashboard ID, pick your Prometheus datasource.
Or, with the Grafana operator's dashboard sidecar:
  kubectl create configmap ingero-nccl-stragglers \
    --from-file=cluster-02-nccl-stragglers.json \
    --namespace=monitoring
  kubectl label configmap ingero-nccl-stragglers grafana_dashboard=1
The dashboard JSON is Apache-2.0 and lives at https://github.com/ingero-io/ingero-grafana-app/blob/main/src/dashboards/cluster-02-nccl-stragglers.json. Forks and PRs welcome.
Notes
- NCCL tracing is via eBPF uprobes on
libnccl.so; the agent attaches when it sees an NCCL-linked process and detaches on exit. There is no library-side instrumentation and no NCCL build flag required. - Panels stay empty on hosts that do not load libnccl (inference-only nodes, control-plane nodes). That is expected.
- Barrier-event ratio is a heuristic, not a kernel-level wait timer. A high ratio means a high share of collective ops emit a barrier event; treat it as a relative signal across nodes in the same job, not an absolute latency.
Related dashboards
- Ingero Cluster: Overview (25271) - start here when training throughput drops.
- Ingero Cluster: Per-Node Drilldown (25276) - drill into the candidate straggler this dashboard surfaces.
- Ingero Cluster: Memcpy Bandwidth (25274) - rule out a data-pipeline bottleneck on the candidate node before blaming NCCL.
License
Apache-2.0. Source: https://github.com/ingero-io/ingero-grafana-app
Data source config
Collector config:
Upload an updated version of an exported dashboard.json file from Grafana
| Revision | Description | Created | |
|---|---|---|---|
| Download |