NVIDIA GPU Cluster Overview: NCCL, memcpy, throttle (multi-node)
Multi-node NVIDIA GPU cluster dashboard. One-glance health: active GPUs, NCCL collective rates by op_type, memcpy bandwidth by direction (h2d/d2h/d2d), throttle event counters, aggregate GPU memory. eBPF-collected agent metrics aggregated across N nodes. Pair with cluster-wide Prometheus + Ingero Fleet collector.
What this dashboard shows
A cluster-wide view of NVIDIA GPU activity, aggregated across every node running the Ingero agent + Ingero Fleet collector. One-glance cluster health on a single page.
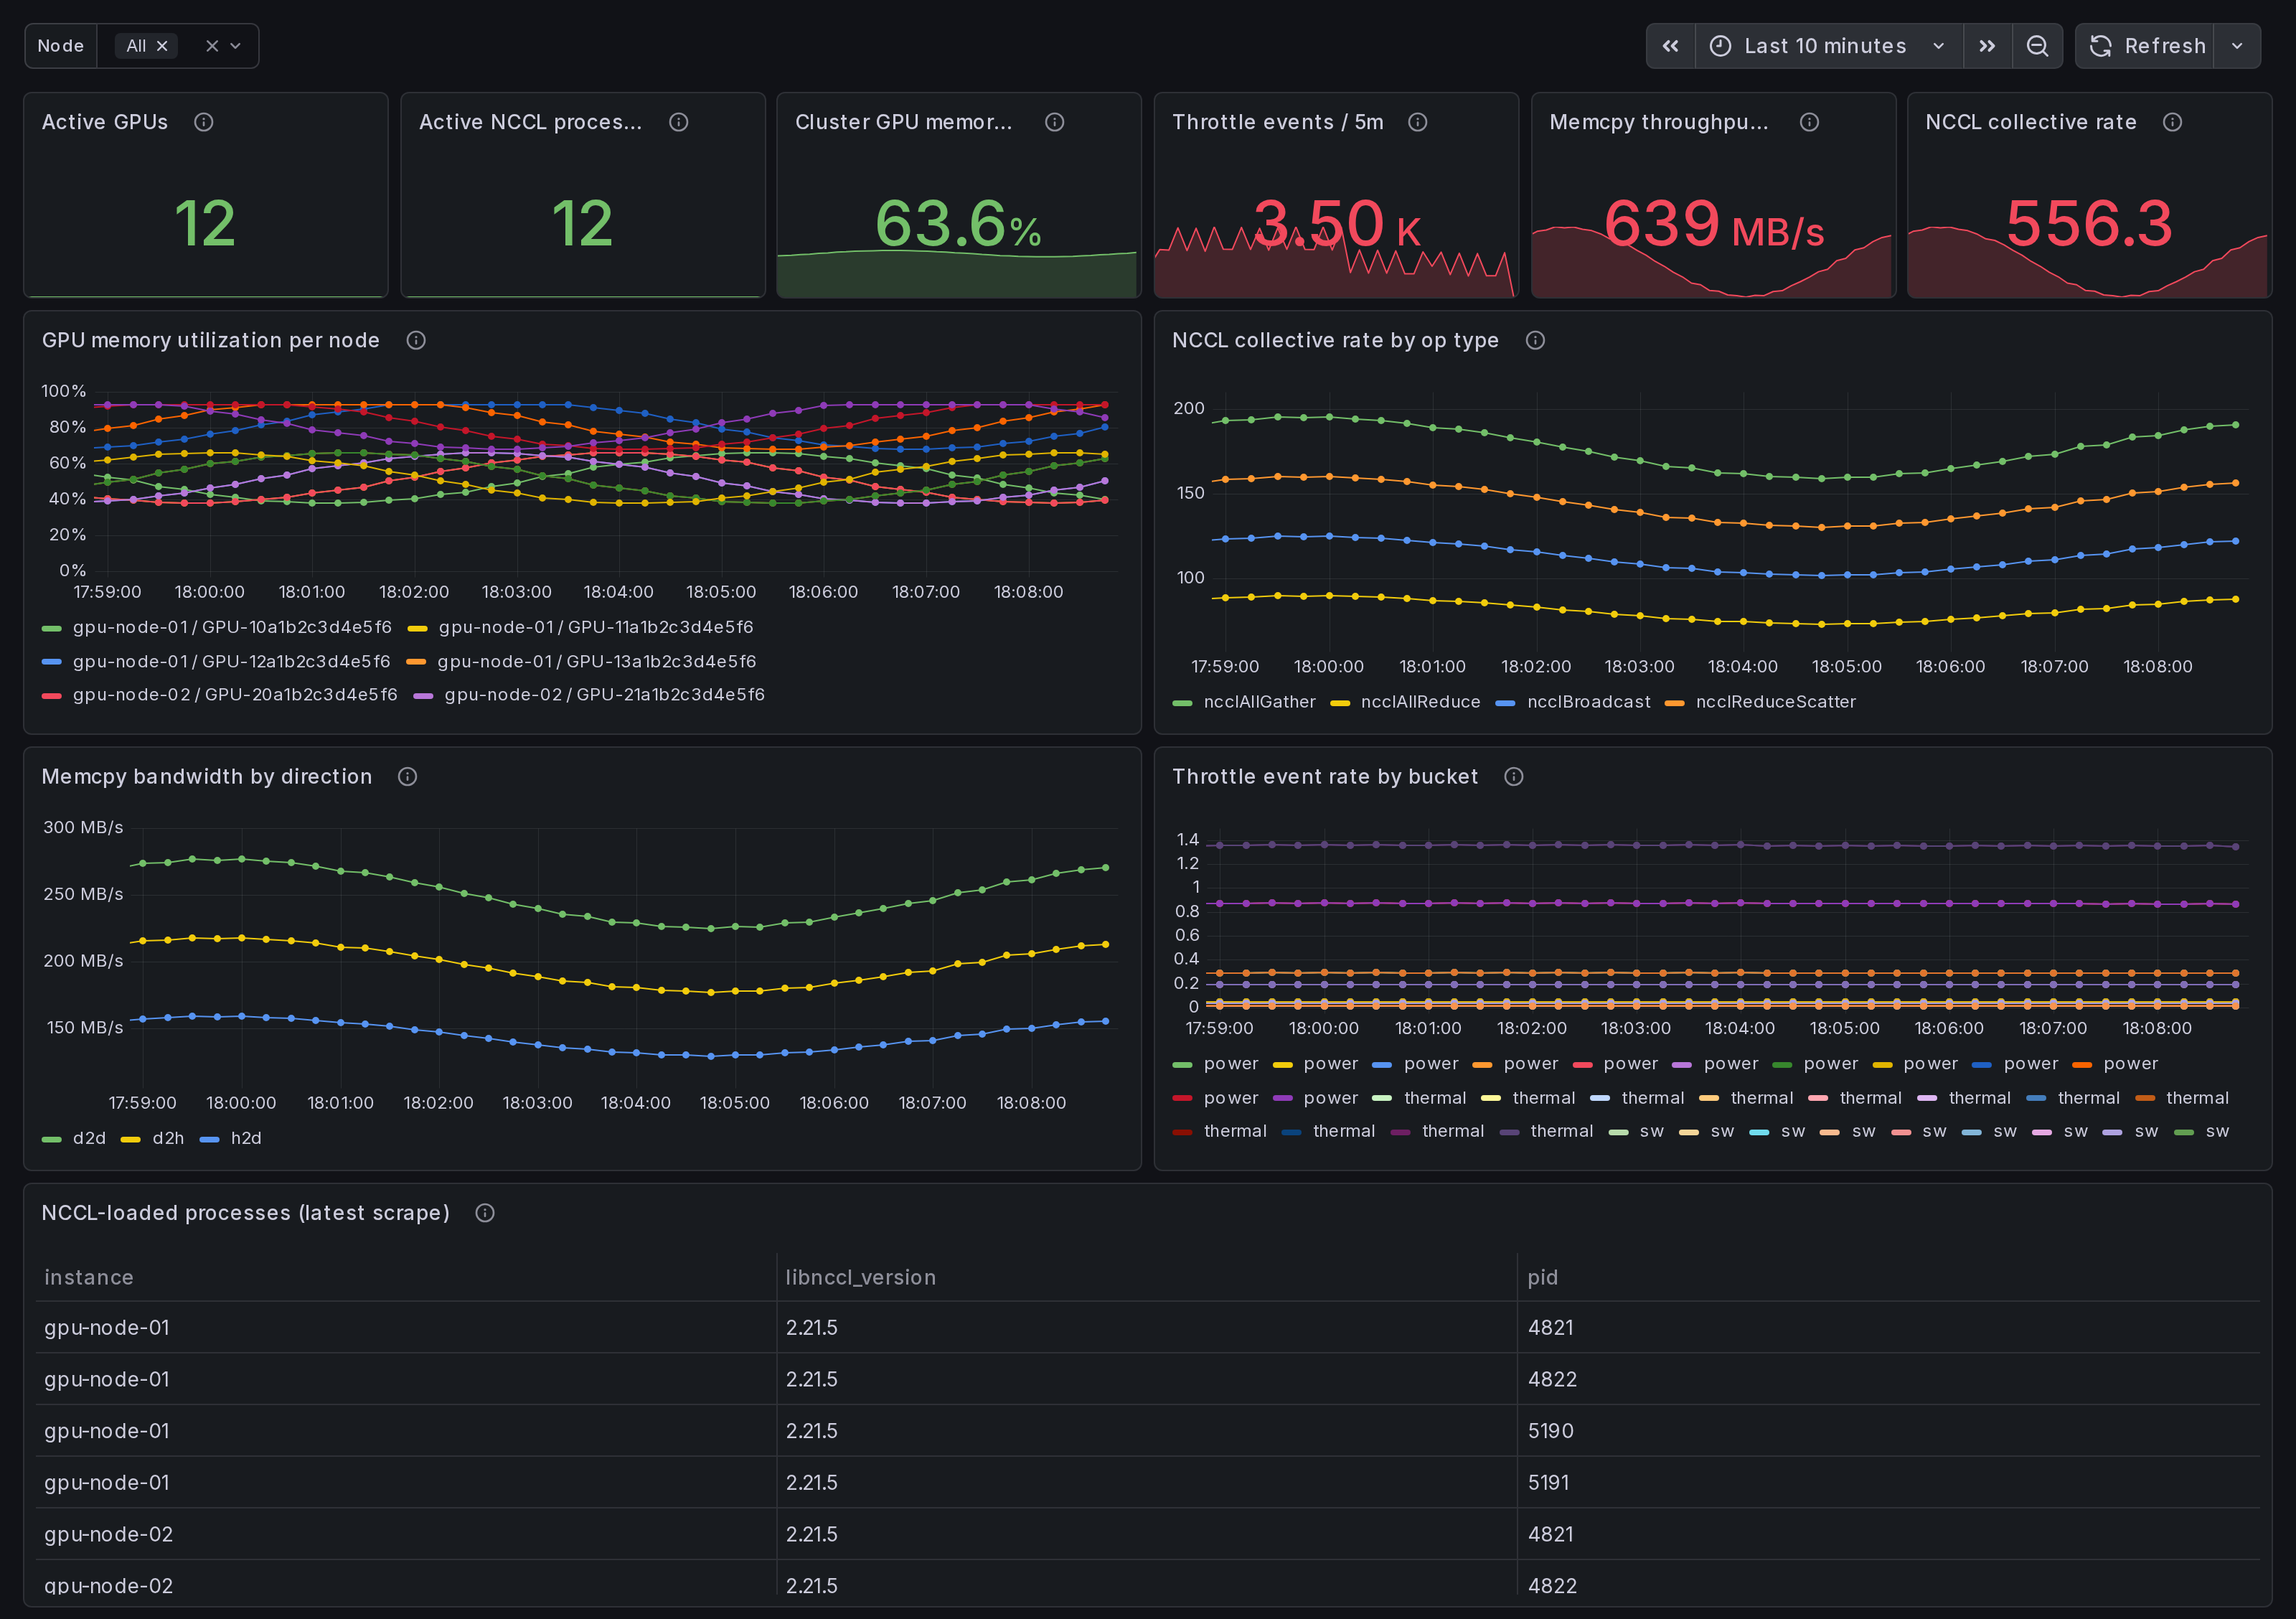
Active GPUs, active NCCL processes, aggregate GPU memory, total memcpy throughput, NCCL collective rate, and throttle event volume across the cluster, plus per-node breakdowns:
- GPU memory utilization per node - one series per (instance, gpu_uuid).
- NCCL collective rate by op_type - rate of
ncclAllReduce,ncclAllGather,ncclBcast,ncclSend/Recvetc. across the cluster. - Memcpy bandwidth by direction -
h2d/d2h/d2d/default/unknown. h2d-d2h skew = data-pipeline imbalance. - Throttle event rate - rising-edge counters per bucket
(
gpu_throttle_{power,thermal,sw,hw}_event_total). - NCCL-loaded process roster - PID + libnccl version per node, from the runtime libnccl discovery scanner.
Linux only. amd64 + arm64 agents. Pair with the agent's single-host dashboards for drill-down.
How the data is collected
The Ingero agent attaches eBPF uprobes directly to libcudart.so +
libcuda.so plus host tracepoints, NVML / nvidia-smi polls for
memory + throttle, and a libnccl discovery scanner that finds
PyTorch / pip-installed NCCL ABIs at runtime (no system-libnccl
required).
Each agent emits OTLP / Prometheus on every node:
sudo ingero trace --prometheus :9090
Either scrape :9090/metrics from your cluster Prometheus / Grafana
Alloy directly, or push OTLP to the Ingero Fleet collector for
cluster-wide aggregation:
ingero fleet-push --collector https://ingero-fleet.:4317
Install agent: https://github.com/ingero-io/ingero
Install Fleet: https://github.com/ingero-io/ingero-fleet (helm chart in helm/ingero-fleet)
The metrics namespace is gpu_* (Prometheus) / gpu.* (OTLP).
Standard label set: instance (per-node), gpu_uuid, pid,
op_type (NCCL), direction (memcpy), cluster_id (when Fleet is
in front).
Why eBPF over polling
Polling via NVML / DCGM-exporter misses sub-poll CUDA call shape and provides no per-operation latency. Ingero attaches uprobes directly to libcudart + libcuda so every CUDA Runtime / Driver call is captured at function entry + return, yielding real per-call duration (not averaged). On the cluster level this means the straggler-shape questions become answerable: "which rank is slow" instead of "everything looks roughly fine on average."
Companion dashboards
- Multi-node, this set: Cluster Overview (this one), NCCL Stragglers, Memcpy Bandwidth Breakdown, Memory Fragmentation, Per-Node Deep Dive. All published under https://grafana.com/orgs/ingero
- Single-host: GPU Trace Overview, CUDA Op Performance, Memcpy
- NCCL, GPU Memory & Throttle. Use these when drilling into one process on one box.
- Fleet pipeline health: the operator dashboard for the Ingero Fleet collector itself (peer-relative median + MAD across the cluster). Different metrics, different audience.
Source
- Agent: https://github.com/ingero-io/ingero
- Fleet collector: https://github.com/ingero-io/ingero-fleet
- Dashboard JSON: https://github.com/ingero-io/ingero-fleet/tree/main/examples/grafana/cluster
- License: Apache-2.0 (same as the agent)
Issues, panel suggestions, dashboard PRs welcome on https://github.com/ingero-io/ingero-fleet/issues
Data source config
Collector config:
Upload an updated version of an exported dashboard.json file from Grafana
| Revision | Description | Created | |
|---|---|---|---|
| Download |