Trustgrid Node Dashboard
A reference dashboard for Trustgrid customers showing how to use Trustgrid's built-in OTEL exporter to monitor Trustgrid appliances in Grafana. Includes interface RX/TX, VPN overlay traffic, system resources, gateway connectivity, connection flows, and structured log panels for node events, audit logs, and config changes.
Trustgrid Node Dashboard
A sample dashboard for monitoring Trustgrid edge nodes using the built-in OpenTelemetry (OTEL) exporter. Use it as a starting point or reference for building your own Trustgrid monitoring in Grafana.
What This Dashboard Shows
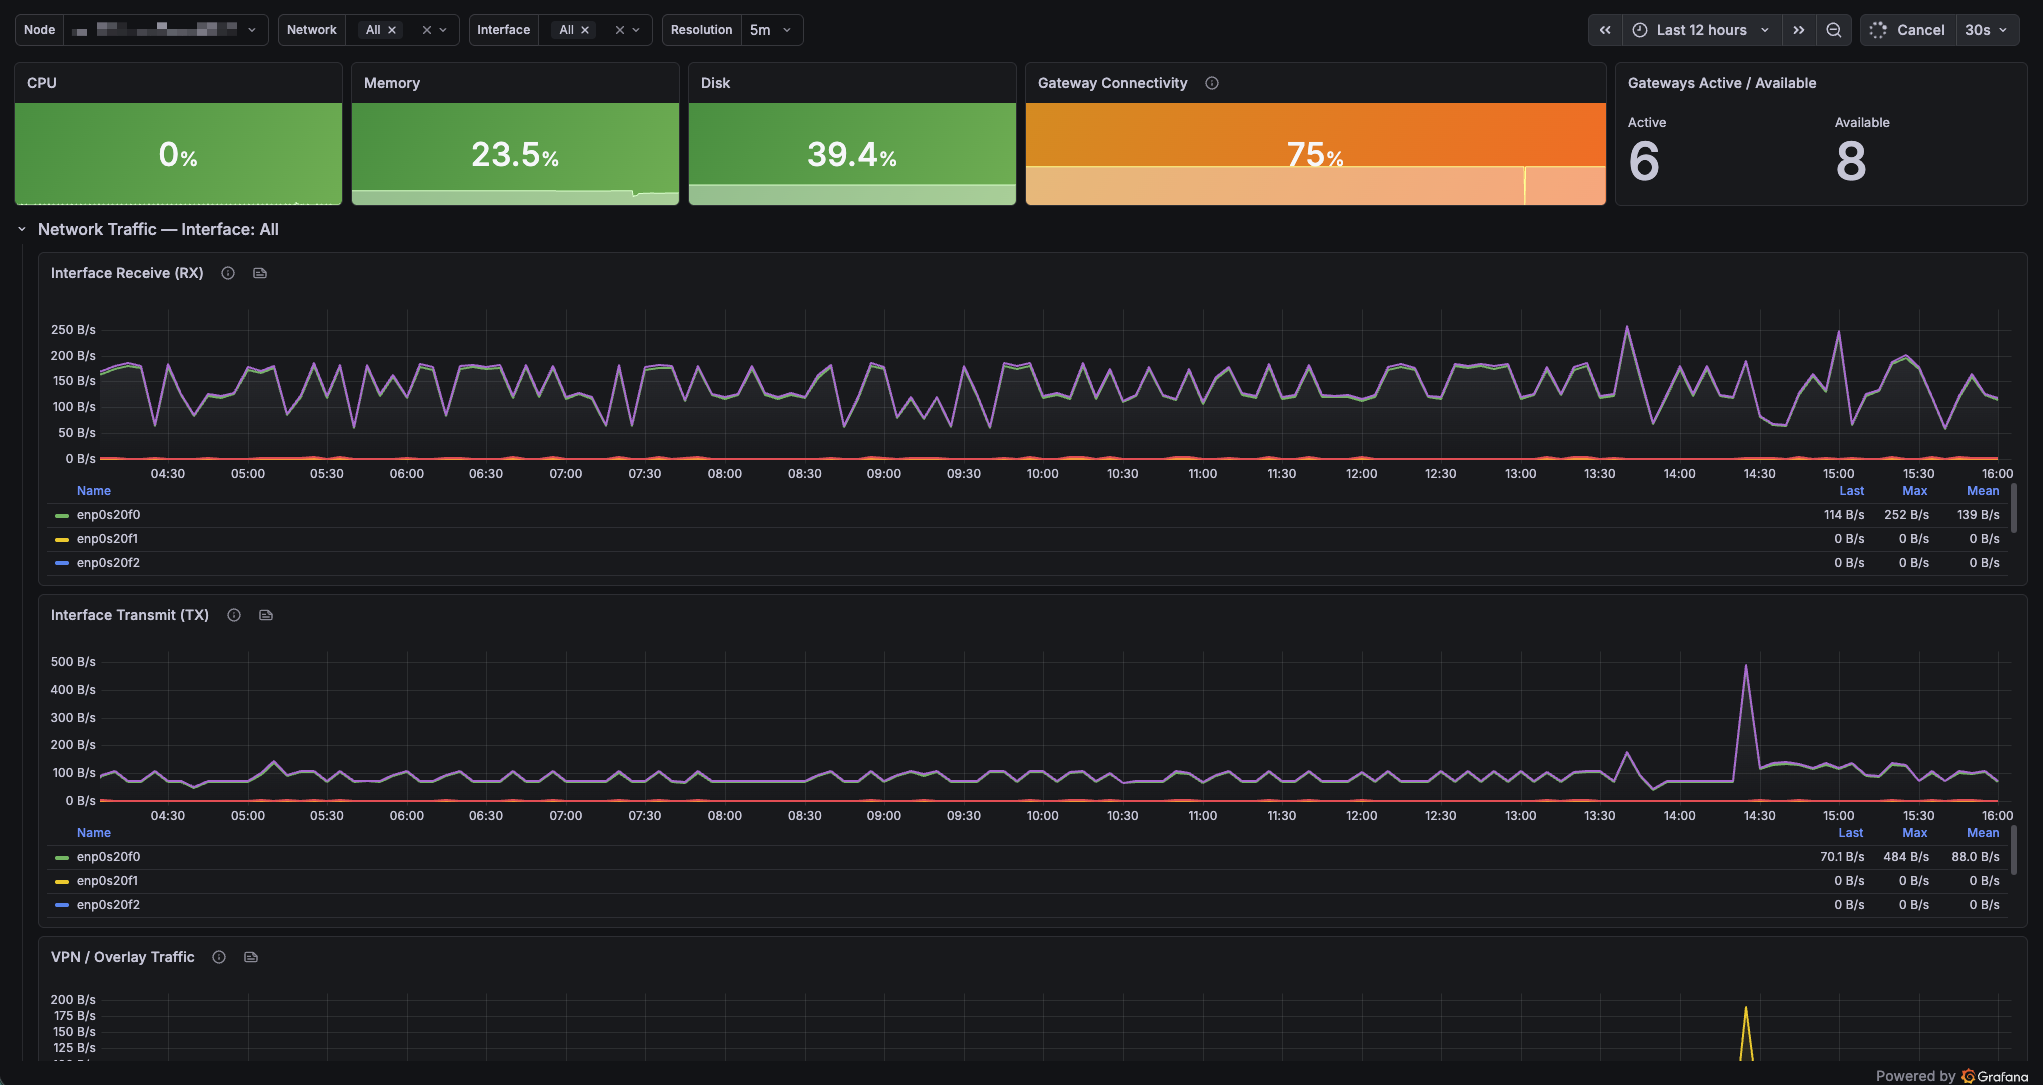
Top bar - at-a-glance status
- CPU, memory, and disk utilization
- Gateway connectivity percentage
- Active vs. available gateway connections
Network Traffic
- Interface RX and TX throughput (bytes/sec), filterable by interface
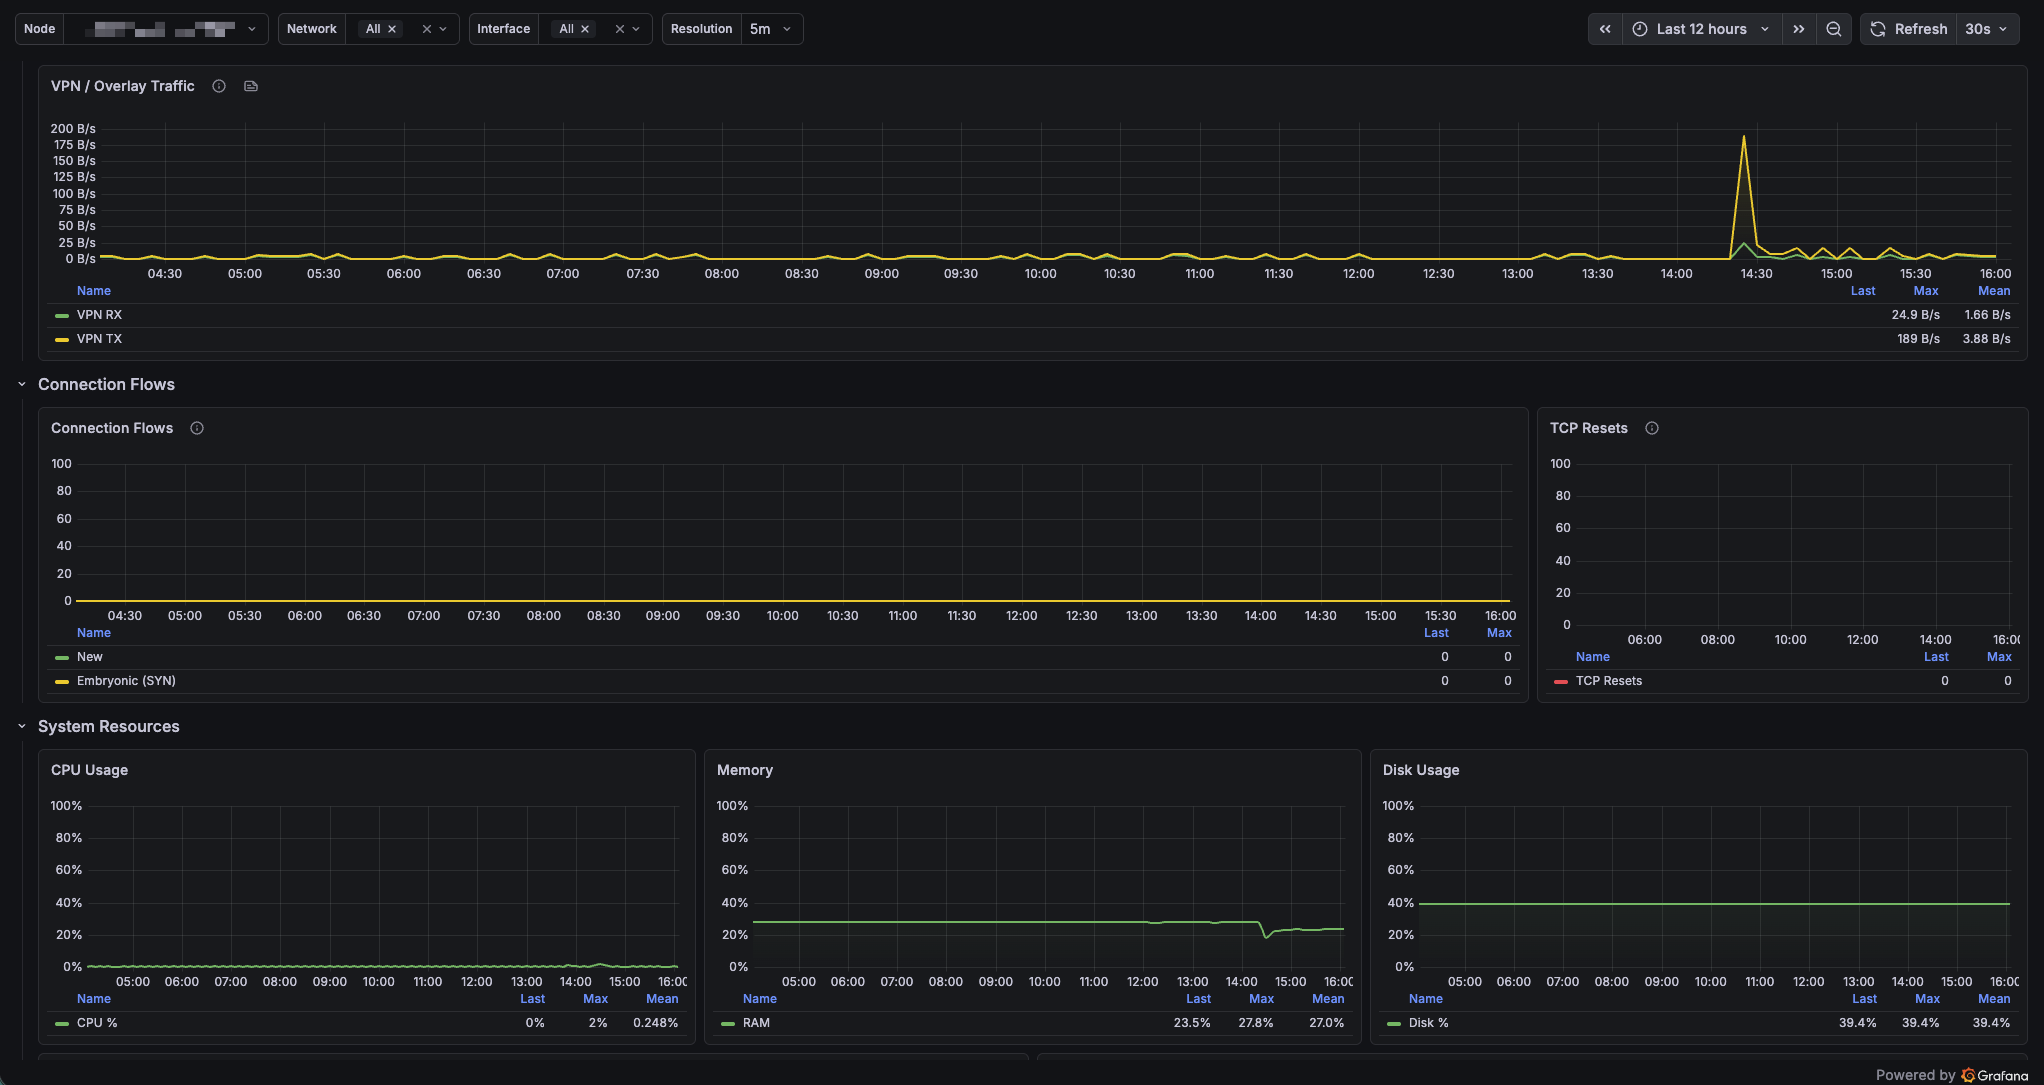
- VPN/overlay tunnel throughput
Connection Flows
- Active, new, and embryonic (half-open TCP) flows
- TCP resets over time useful for spotting dropped connections or service disruptions
System Resources
- CPU, memory, and disk usage over time
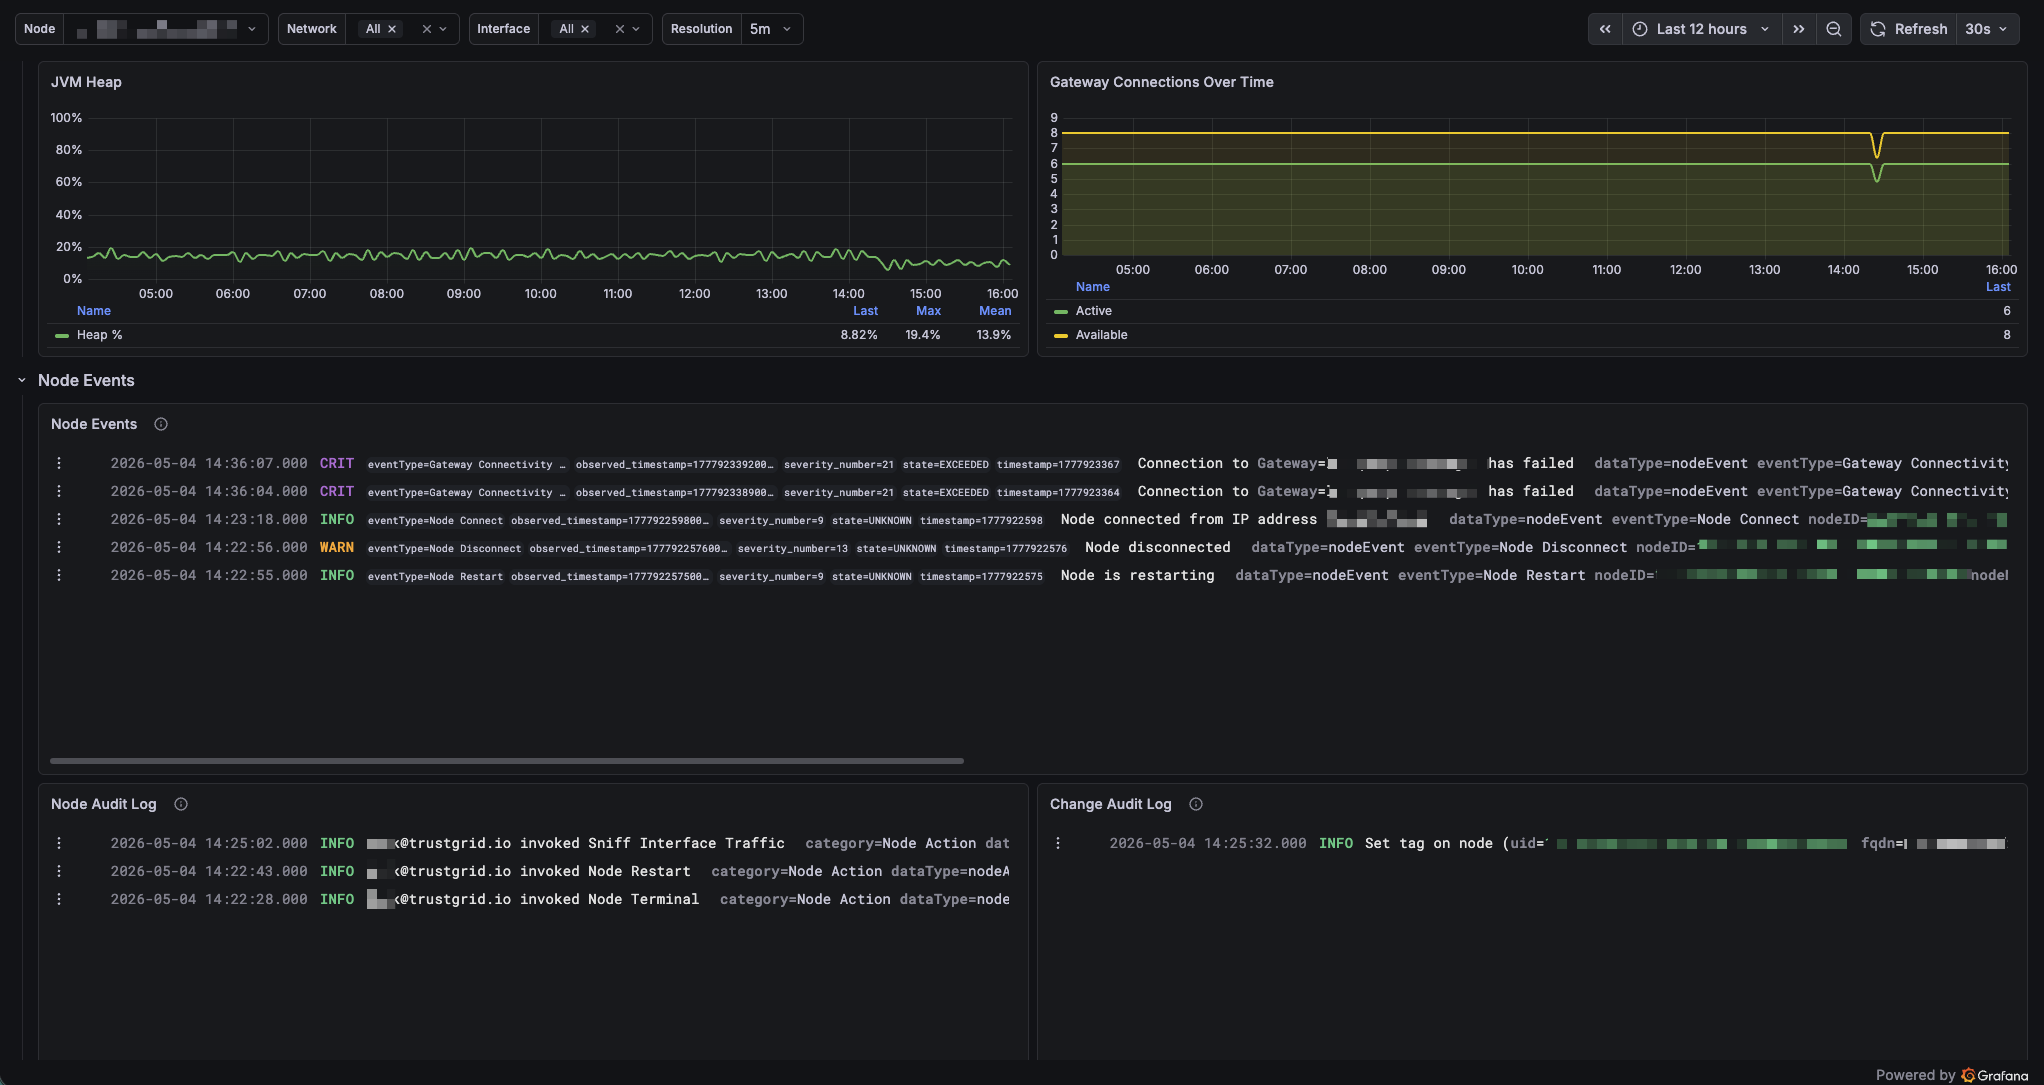
- JVM heap utilization
- Gateway connection counts over time
Node Events and Logs
- Node Events: connectivity changes, gateway disruptions, failover events, and network errors
- Node Audit Log: user-initiated actions such as upgrades and restarts
- Change Audit Log: changes that were made, and who made them
Requirements
- Observability enabled in your Trustgrid organization (by request)
- Grafana with a Prometheus datasource receiving Trustgrid metrics
- Grafana with a Loki datasource receiving Trustgrid logs
Variables
- Node the Trustgrid node to display data for
- Network filter flow and reset metrics by virtual network
- Interface filter network traffic panels by physical interface
- Resolution time window for metric averaging (5m, 10m, 30m, 1h)
Getting Started
- Configure OTEL exporter in the Trustgrid portal
- Confirm metrics are arriving in Prometheus and logs in Loki.
- Import this dashboard and map the two datasource inputs when prompted.
- Select your node from the Node dropdown to begin.
About Trustgrid
Trustgrid is a managed edge networking platform that connects cloud applications to data in any environment including customer on-premises systems, data centers, and legacy infrastructure over secure, encrypted tunnels.
Learn more at trustgrid.io and docs.trustgrid.io.
Data source config
Collector config:
Upload an updated version of an exported dashboard.json file from Grafana
| Revision | Description | Created | |
|---|---|---|---|
| Download |
Linux Server
Monitor Linux with Grafana. Easily monitor your Linux deployment with Grafana Cloud's out-of-the-box monitoring solution.
Learn more