Claude Code Metrics (Prometheus)
Claude Code usage analytics on Prometheus: cost, token consumption, sessions, active coding time, lines of code, commits, pull requests, tool decisions, cache hit ratio, and leaderboards by user, model, and session. Consumes Anthropic's OpenTelemetry metrics via OTLP. Works with Prometheus, VictoriaMetrics, Mimir, and Thanos. Requires Grafana 11+.
Claude Code Metrics (Prometheus)
A Grafana dashboard for monitoring Claude Code CLI usage on Prometheus-compatible backends. Consumes Claude Code's OpenTelemetry metrics (emitted via OTLP) and queries them with PromQL. Compatible with Prometheus, VictoriaMetrics, Mimir, and Thanos.
Source repository, issue tracker, and updates: https://github.com/rockdarko/claude-code-metrics-prometheus
Inspired by dashboard 25052 by 1w2w3y, which targets Azure Application Insights via KQL. This is a parallel implementation for the Prometheus stack — every panel re-queried in PromQL against Anthropic's published OpenTelemetry metric names.
What's in it
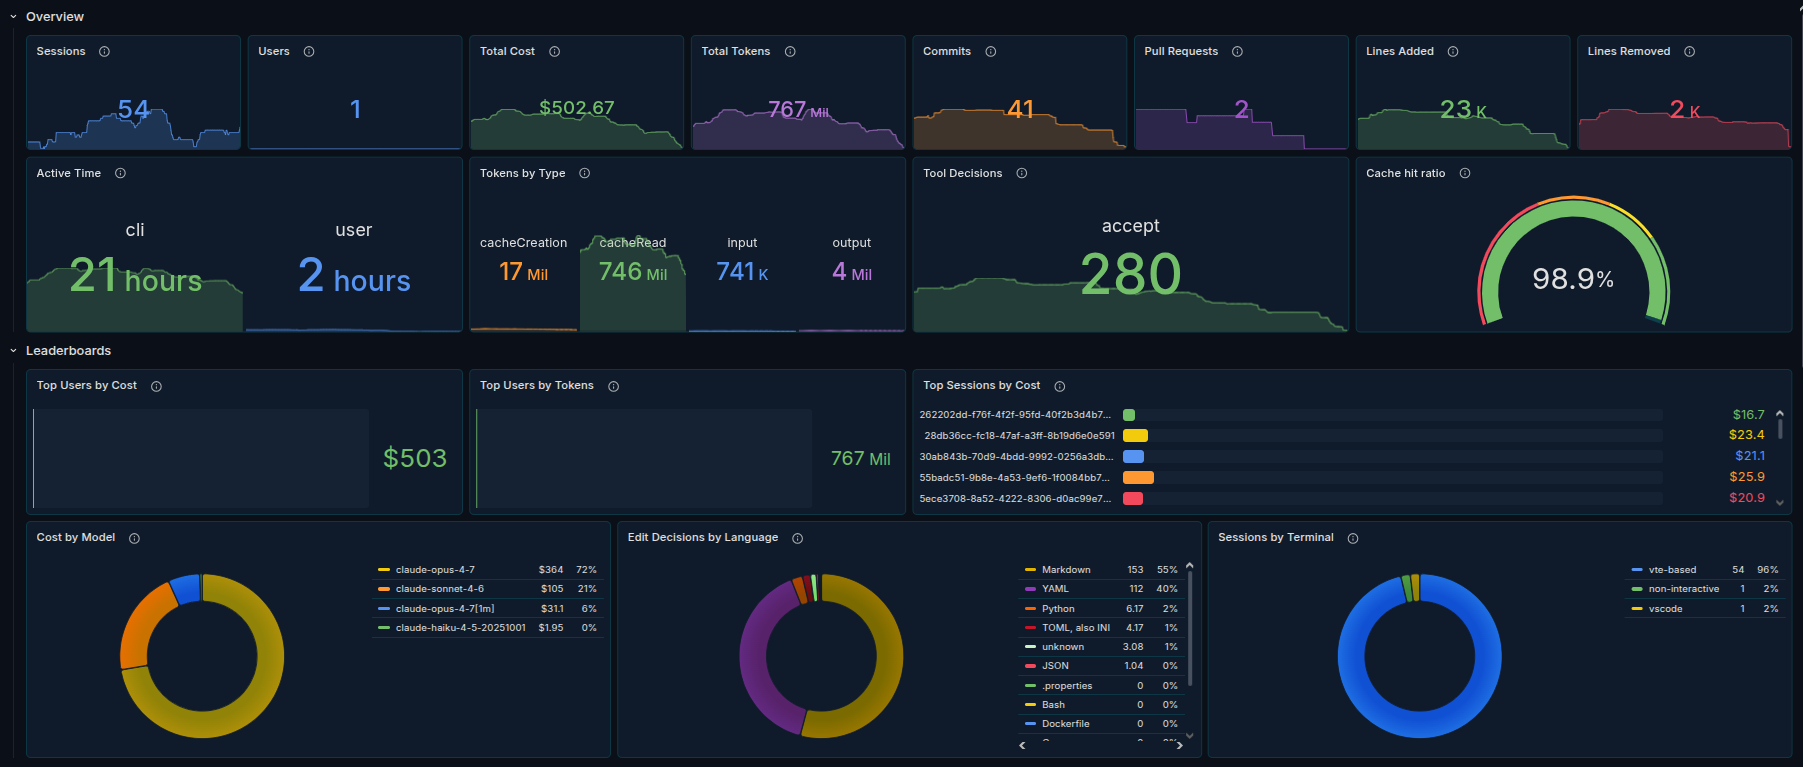
Overview — at-a-glance KPIs: sessions, users, total cost, total tokens, commits, pull requests, lines added/removed, active time, tokens by type, and tool decisions.
Leaderboards — top users by cost and tokens, top sessions by cost, cost by model, edit decisions by language, and sessions by terminal.
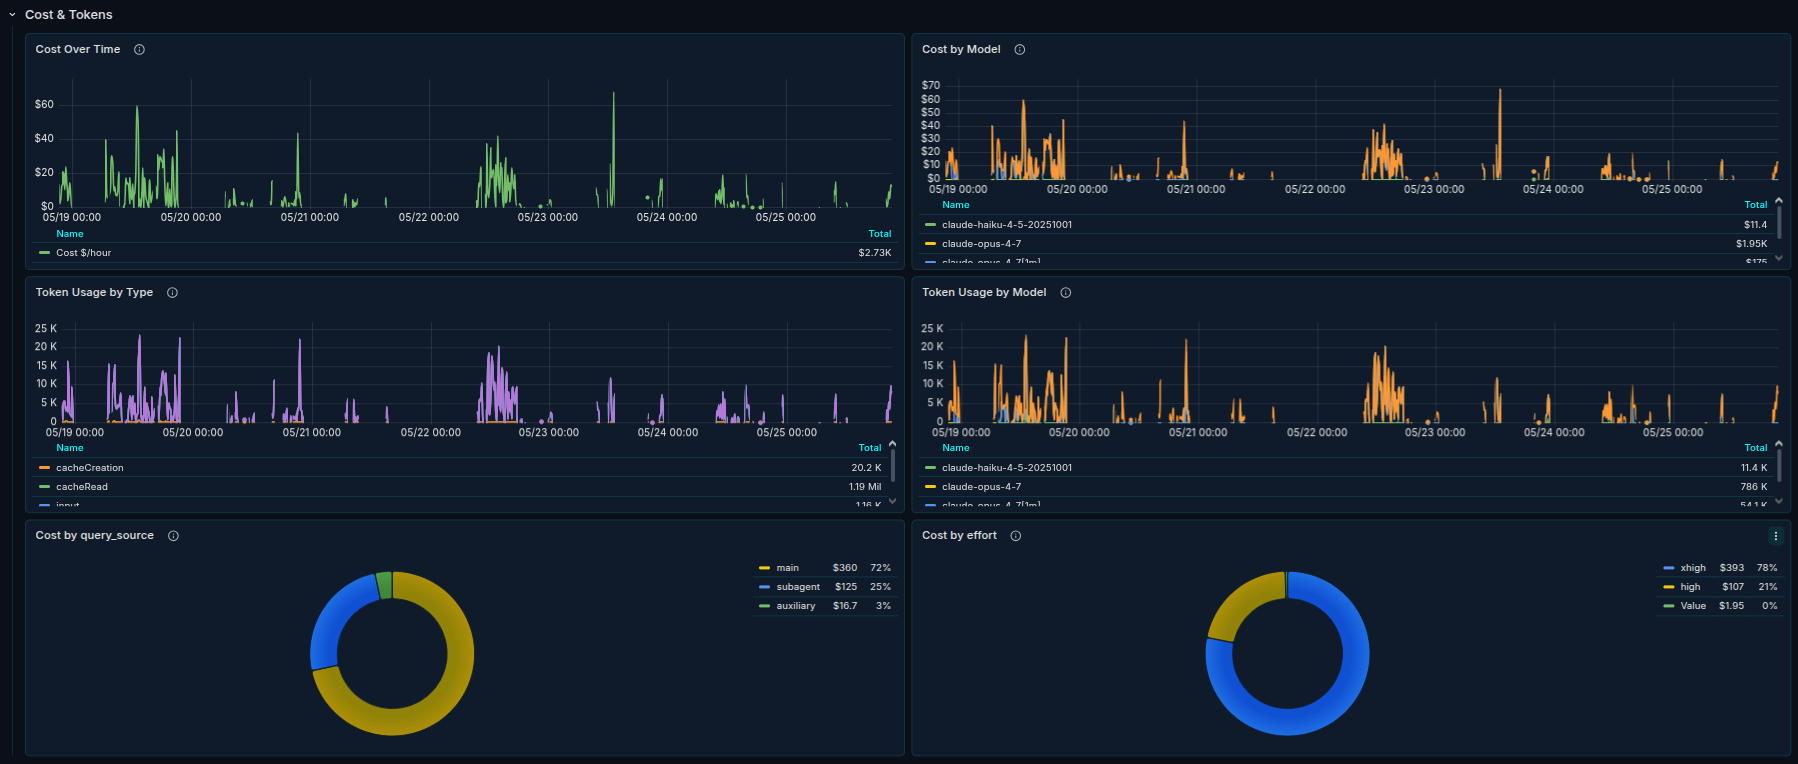
Cost & Tokens — cost over time (overall and by model) and token usage over time (by type and by model).
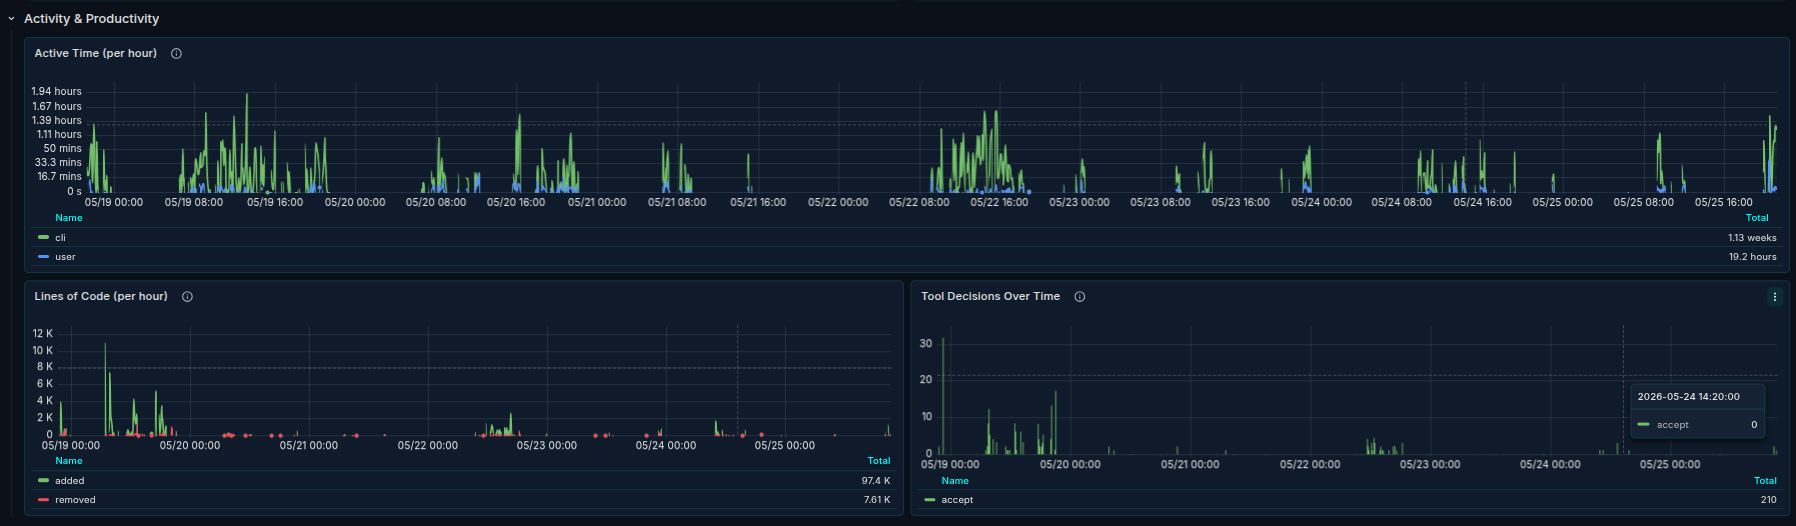
Activity & Productivity — active time per hour, lines of code per hour, and tool decisions over time.
Cost Breakdown — cost by query source, cost by effort, and cache hit ratio.
The dashboard uses three header variables — organization, user, and model — for filtering. Default time range is the last 7 days.
Requirements
- Grafana 11+
- A Prometheus-compatible data source: Prometheus, VictoriaMetrics, Mimir, or Thanos
- Claude Code with OpenTelemetry telemetry enabled, with metrics routed into your Prometheus-compatible backend
How metrics are collected
This dashboard expects the standard "OTel Collector in the middle" pipeline:
Claude Code → OTLP → OTel Collector → /metrics → Prometheus → dashboard
If you already run an OTel Collector and Prometheus, you mostly need to (1) tell Claude Code where to send OTLP, (2) add a Prometheus exporter to your Collector, and (3) add a scrape job to Prometheus.
1. Configure Claude Code to emit telemetry
Set these in your shell environment (or in ~/.claude/settings.json under env):
# Enable telemetry
export CLAUDE_CODE_ENABLE_TELEMETRY=1
Where to send OTLP. Use the HTTP receiver port (4318) for easier
debugging; gRPC (4317) works equally well.
export OTEL_EXPORTER_OTLP_ENDPOINT="http://your-collector:4318"
Recommended: pin temporality to cumulative. Prometheus-family backends
require cumulative counters. The OpenTelemetry SDK currently defaults to
cumulative, but defaults can drift between SDK versions — being explicit
avoids silent breakage on upgrades.
export OTEL_EXPORTER_OTLP_METRICS_TEMPORALITY_PREFERENCE=cumulative
For full details on Claude Code's telemetry options, see Anthropic's monitoring documentation.
2. Configure the OTel Collector
A minimal Collector configuration that accepts OTLP from Claude Code and exposes a Prometheus /metrics endpoint:
receivers:
  otlp:
    protocols:
      http:
        endpoint: "0.0.0.0:4318"
      grpc:
        endpoint: "0.0.0.0:4317"
processors:
batch/metrics:
timeout: 5s
send_batch_size: 128
send_batch_max_size: 256
exporters:
prometheus:
endpoint: "0.0.0.0:9464"
# Promotes OpenTelemetry resource attributes to Prometheus labels.
resource_to_telemetry_conversion:
enabled: true
# Preserves original OTel timestamps rather than ingest time.
send_timestamps: true
service:
pipelines:
metrics:
receivers: [otlp]
processors: [batch/metrics]
exporters: [prometheus]
If you already run a Collector with other pipelines (traces, logs), add the otlp receiver and prometheus exporter to it; you don't need a separate Collector.
3. Configure Prometheus to scrape the Collector
Add a scrape job pointing at the Collector's Prometheus exporter port (default :9464):
scrape_configs:
  - job_name: claude-code-metrics
    scrape_interval: 30s
    static_configs:
      - targets:
          - "otel-collector:9464"   # ← replace with your Collector's host:port
VictoriaMetrics, Grafana Mimir, and Thanos all accept the same scrape job configuration in their scraper components (vmagent, distributor with --web.enable-otlp-receiver, etc.).
Metrics consumed
The dashboard queries the following metric names emitted by Claude Code:
claude_code_session_count_totalclaude_code_token_usage_tokens_totalclaude_code_cost_usage_USD_totalclaude_code_active_time_seconds_totalclaude_code_lines_of_code_count_totalclaude_code_commit_count_totalclaude_code_pull_request_count_totalclaude_code_code_edit_tool_decision_total
Filter labels used: organization_id, user_email, model, session_id, terminal_type, type (token type), language (file language), decision, query_source, effort.
Troubleshooting
No data anywhere. Verify the full pipeline by checking each hop:
- Is Claude Code emitting? Run any Claude Code command, then
curl http://your-collector:9464/metrics | grep claude_code_— you should see Claude Code's metric series listed. - Is Prometheus scraping? In Prometheus, go to Status → Targets and confirm the
claude-code-metrics(or whatever you named it) job isUP. - Are queries finding data? In Grafana Explore, select your Prometheus data source and query
claude_code_session_count_total— values should appear.
Some panels show data but Sessions by Terminal (or other panels using count aggregations) is empty. Check that your Collector's prometheus exporter has resource_to_telemetry_conversion: enabled: true set (see the example config). Without it, some attribute-derived labels may not be exposed.
Counters look wrong (negative rates, jumps to zero). Likely a temporality mismatch — Claude Code emitting delta metrics into a cumulative-expecting backend. Set OTEL_EXPORTER_OTLP_METRICS_TEMPORALITY_PREFERENCE=cumulative in Claude Code's environment.
Pull Requests = 0 even though I've made PRs. Claude Code only emits the PR counter when Claude Code itself opens the PR (e.g., via the gh CLI inside a Claude Code session). PRs you open manually outside Claude Code don't count.
Cost numbers don't match my Anthropic billing dashboard. Claude Code's cost metric is computed client-side from token counts and published model prices, so it's an estimate. It will be close to billing but not identical, particularly across pricing changes or for cached tokens that get billed differently than the local estimate assumes.
Credits
Original dashboard concept and panel set: grafana.com dashboard 25052 by 1w2w3y, targeting Azure Application Insights.
This Prometheus port: @rockdarko.
Data source config
Collector config:
Upload an updated version of an exported dashboard.json file from Grafana
| Revision | Description | Created | |
|---|---|---|---|
| Download |