MCP Server Observability
Comprehensive observability for MCP servers: transport, protocol, tool execution, agentic metrics, sessions, resources, and system health. Supports multi-client monitoring.

MCP Server Observability Dashboard
Comprehensive monitoring dashboard for Model Context Protocol (MCP) servers — the open standard enabling AI assistants to invoke tools, access resources, and interact with external systems.
What This Dashboard Shows
Organized into 10 sections covering the full MCP observability stack:
| Section | Key Panels |
|---|---|
| Overview | Total tool calls, error rate gauge, active sessions, in-flight concurrency, handshake success rate |
| Multi-Client Breakdown | Per-client call rates, active sessions by client |
| Transport Layer | Connection distribution by transport type (streamable-http, SSE, WebSocket), reconnection events, handshake success/failure |
| Protocol & Messages | Message rates by JSON-RPC method, request-response latency (p50/p95/p99), JSON-RPC error codes, protocol version distribution, message size |
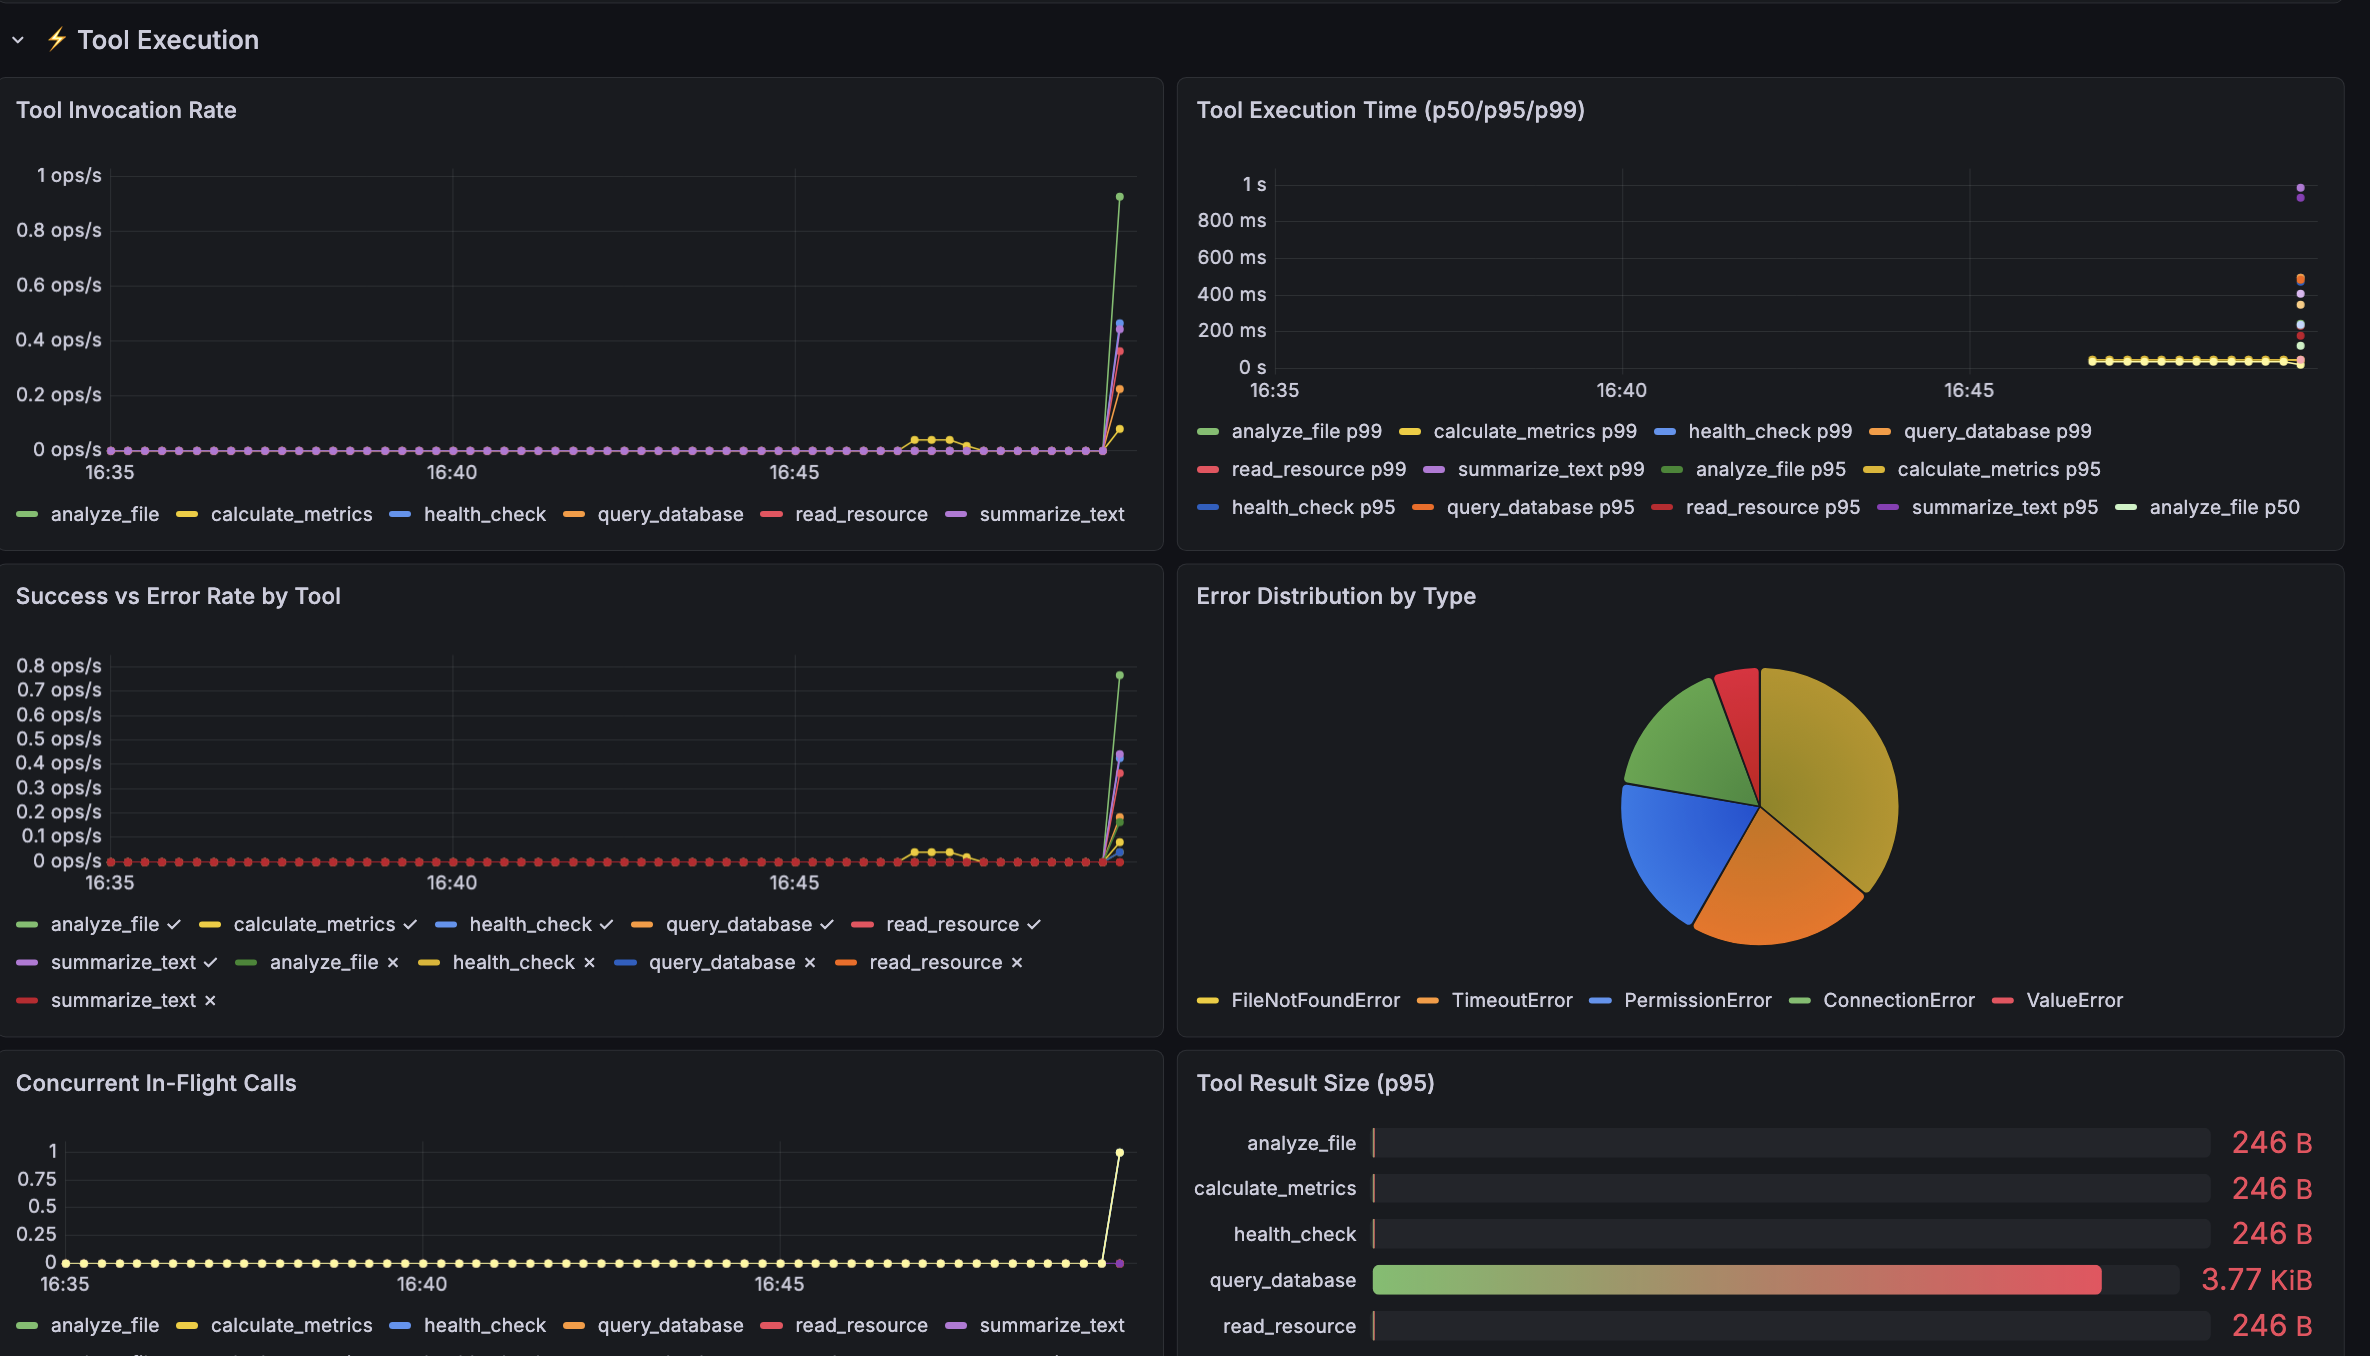
| Tool Execution | Invocation rate per tool, execution time percentiles, success vs error rate, error type classification, concurrent in-flight calls, result payload sizes |
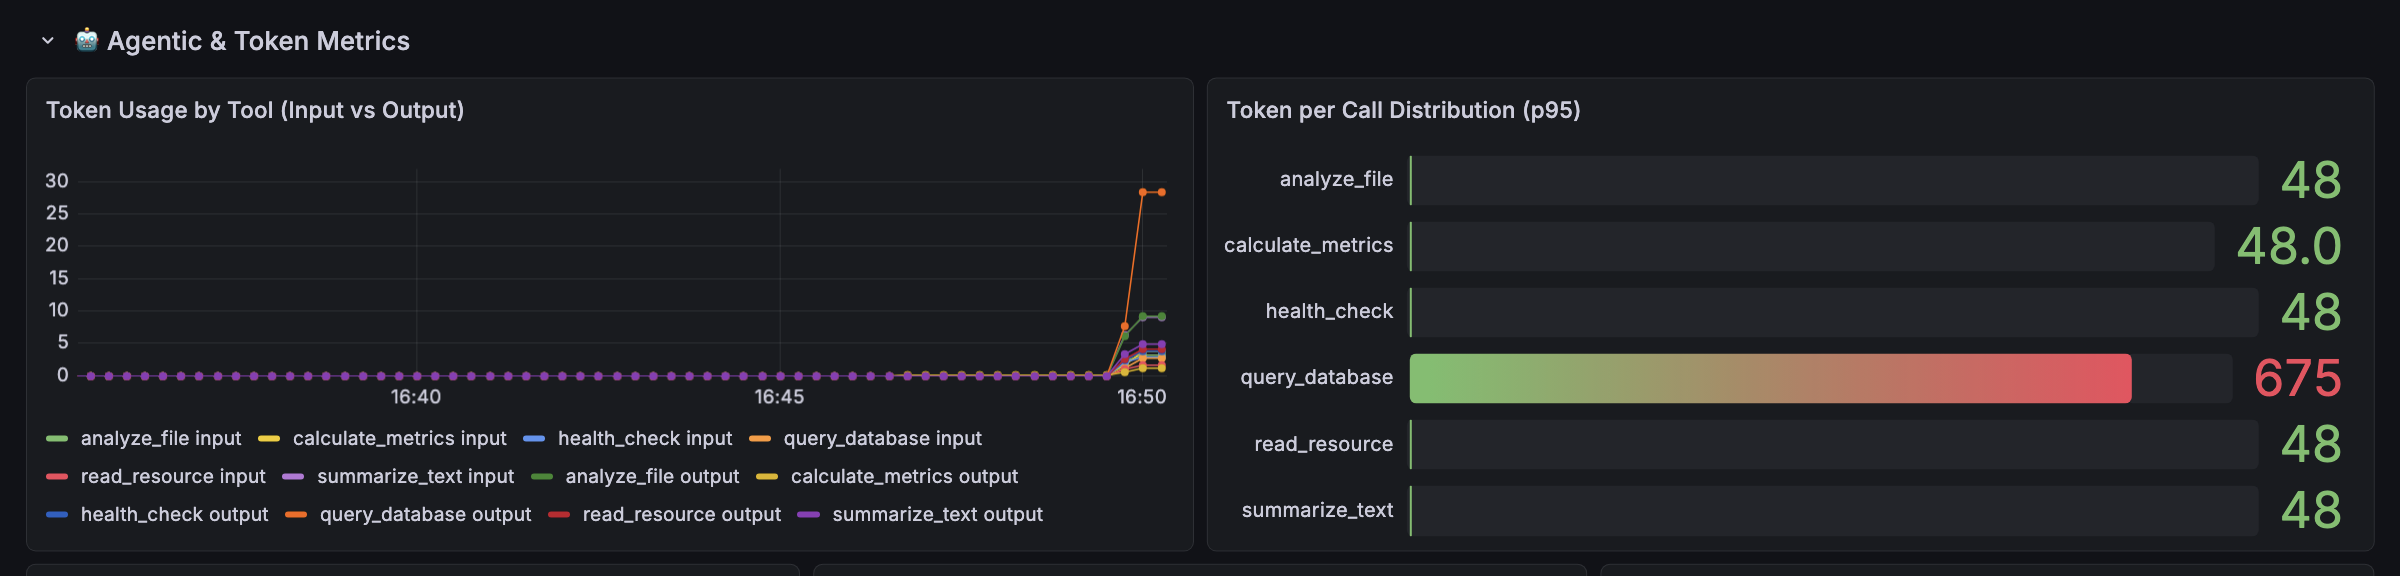
| Agentic & Token Metrics | Token usage (input/output) per tool, hallucination detection (calls to non-existent tools), prompt template usage, self-correction rate, turns-to-completion, task success rate |
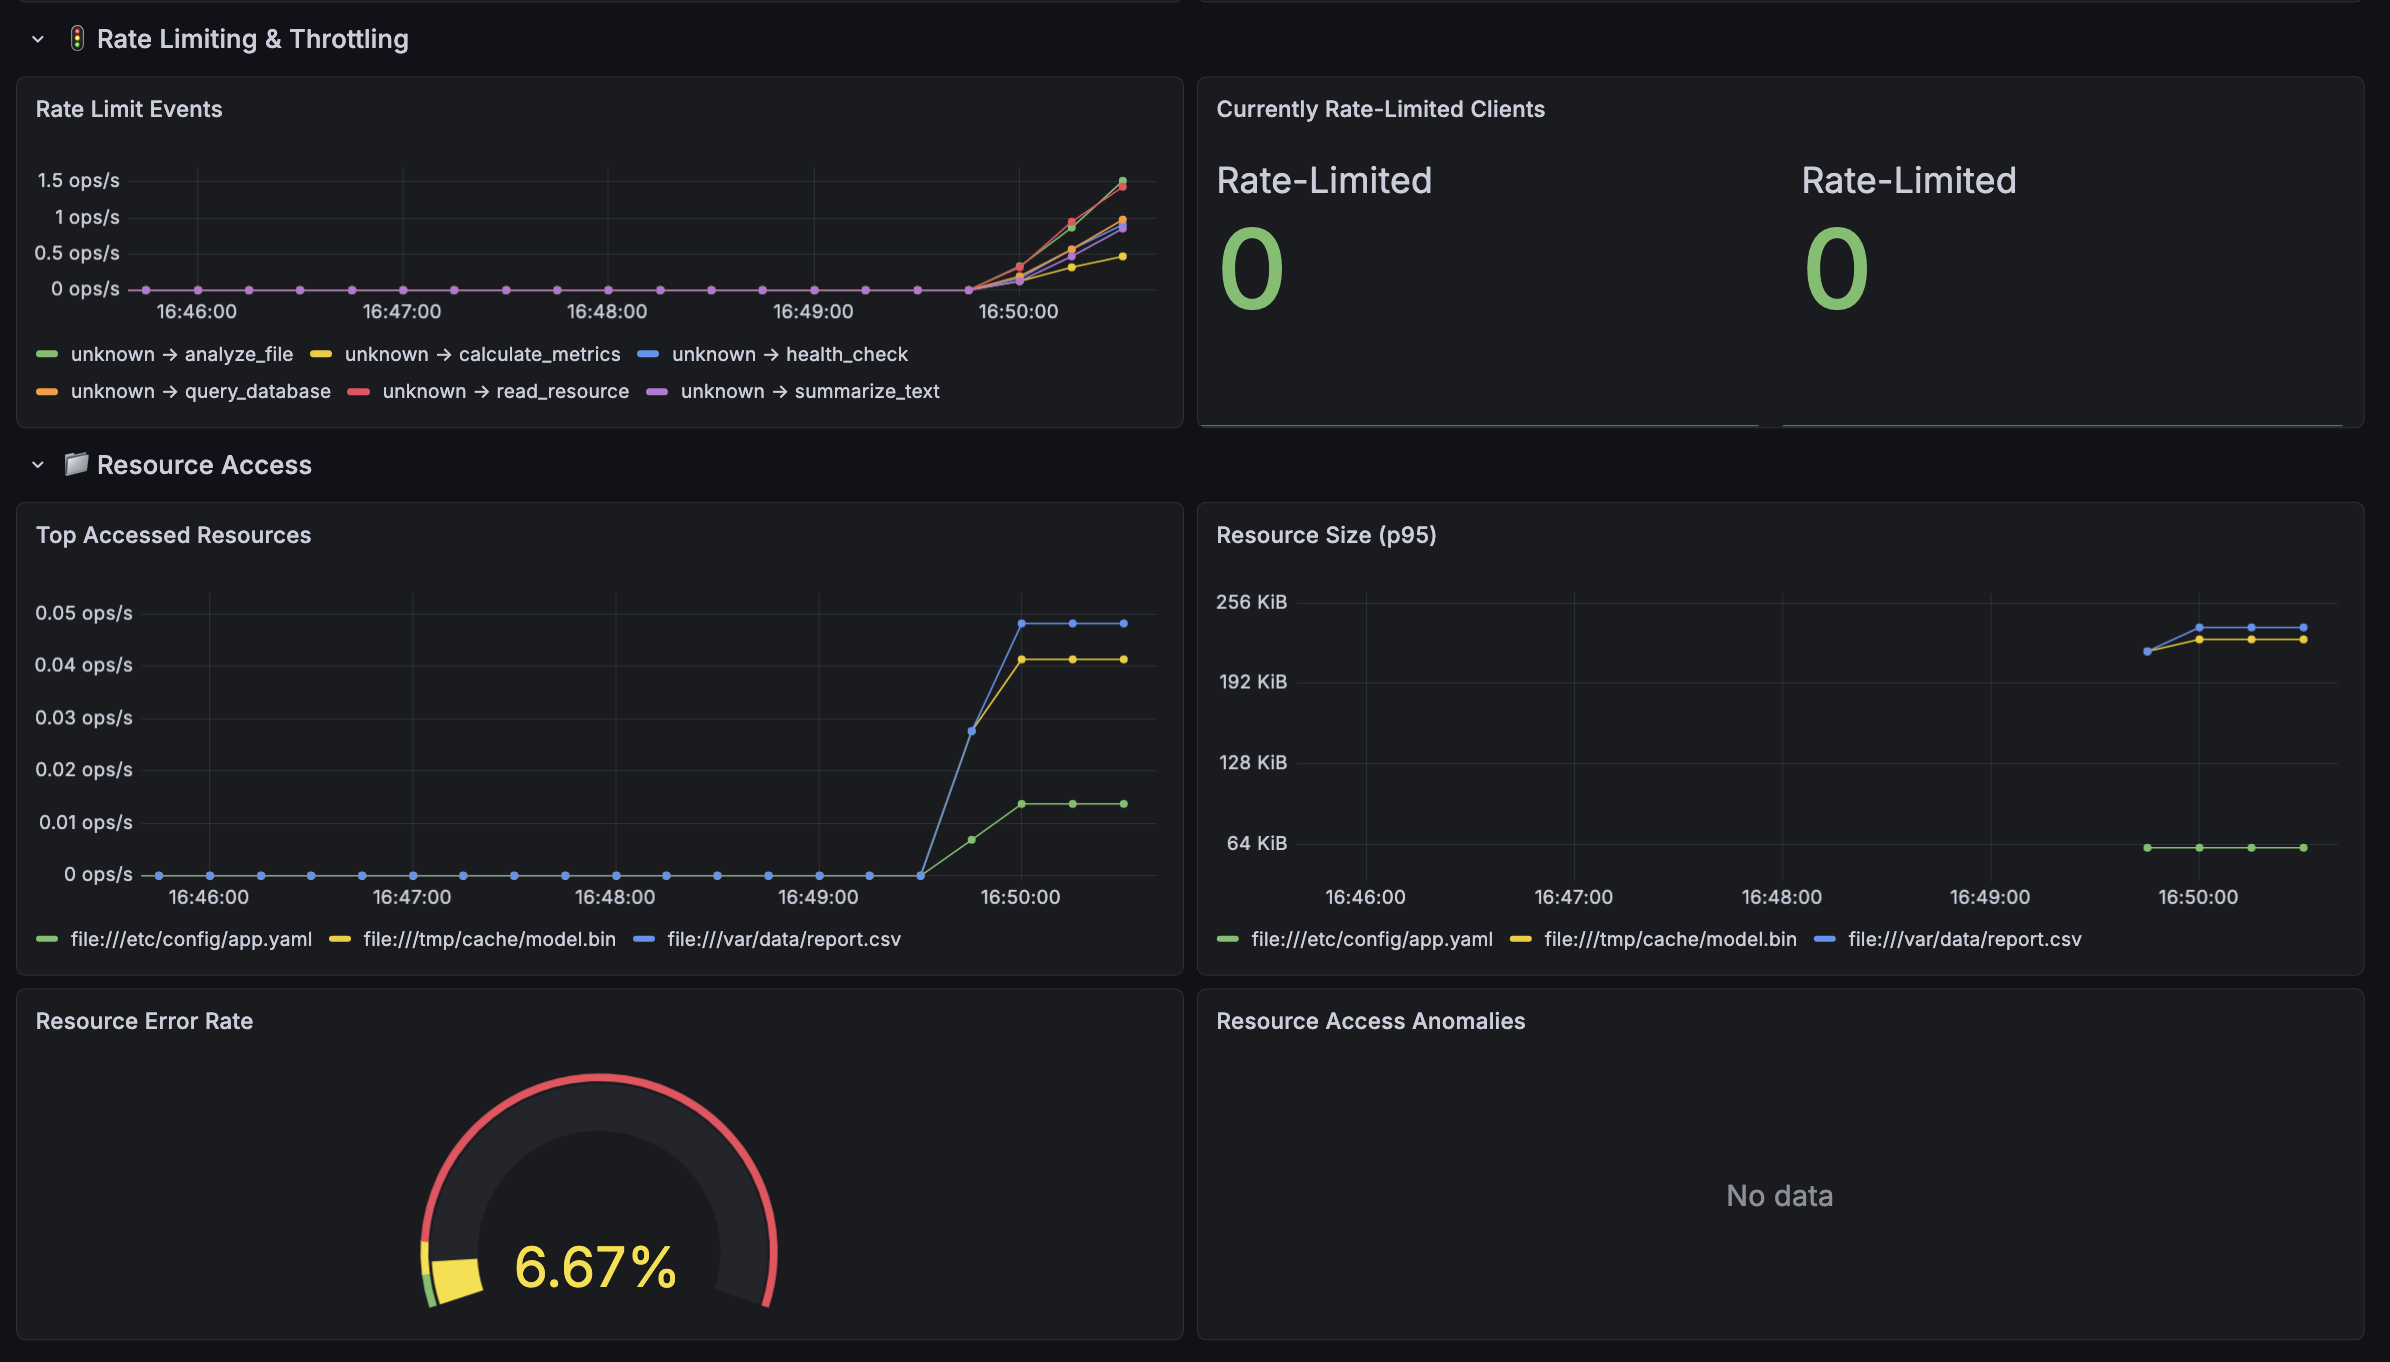
| Rate Limiting | Throttle events by client/tool, currently rate-limited clients |
| Resource Access | Top accessed resources, response sizes, error rates, access anomaly detection |
| Sessions & Connections | Session duration percentiles, disconnect reasons by client |
| System Resources | CPU and memory usage of the MCP server process |
Dashboard variables allow filtering by client_id and tool_name.
How Metrics Are Collected
Metrics collection: No external collector/agent. The MCP server exposes Prometheus metrics directly at /metrics using prometheus_client. Prometheus scrapes this endpoint every 5s.
Distributed tracing: OpenTelemetry SDK embedded in the application creates spans for every tool call, exported via OTLP gRPC to Jaeger (or any OTLP-compatible backend like Tempo/Grafana Cloud)
Data Source
Type: Prometheus Optional: Tempo data source for tracing
Requirements
Grafana 9.0+ Prometheus 2.40+
Full source code and instrumentation library: https://github.com/tyagian/mcp_server_observability
Data source config
Collector config:
Upload an updated version of an exported dashboard.json file from Grafana
| Revision | Description | Created | |
|---|---|---|---|
| Download |