Open Outbox Dashboard
The Grafana dashbord for open-outbox relay service.
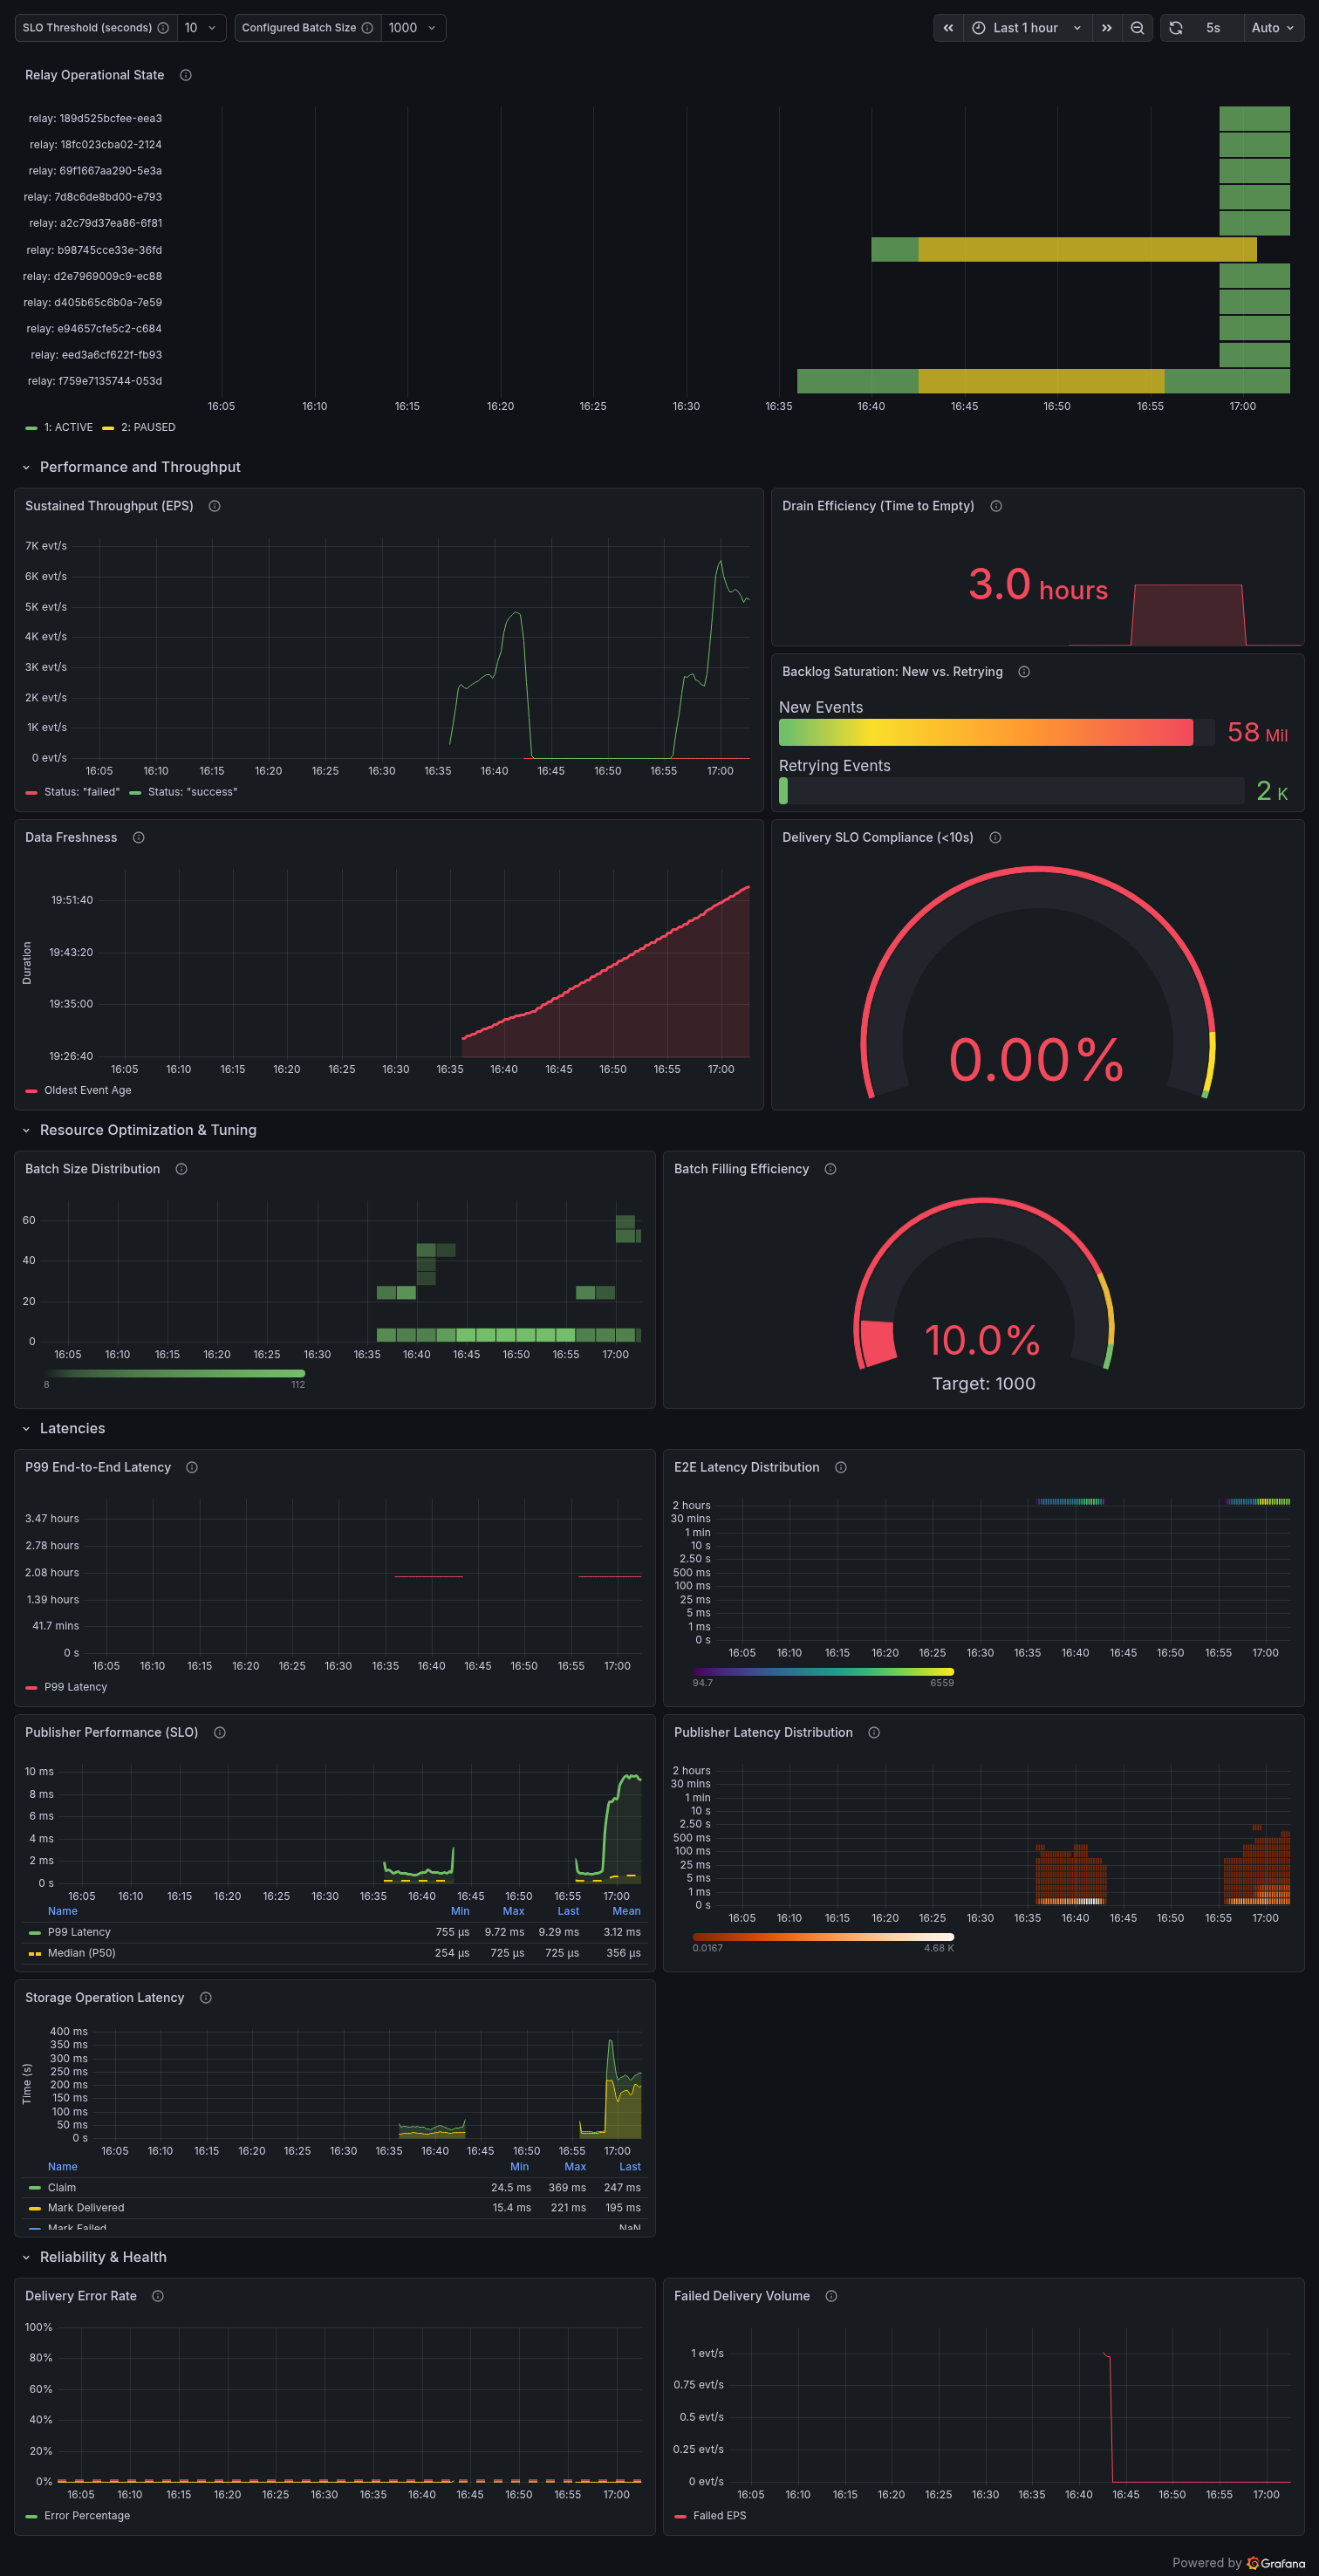
Open Outbox Relay Dashboard
This dashboard provides a real-time view of the Open Outbox Relay lifecycle. It is designed to help engineers move beyond simple "up/down" checks and instead focus on system efficiency, ingestion health, and strict Service Level Objective (SLO) tracking.
Dashboard Structure
The dashboard is organized into logical categories to help you quickly isolate whether a bottleneck resides in the Database (Storage), the Relay Logic, or the External Publisher.
Relay Operational State
- System Health: A high-level overview of the relay's current status, including active uptime and heartbeat monitoring to ensure the relay process is functioning correctly.
Performance and Throughput
- Sustained Throughput (EPS): Real-time measurement of events processed per second.
- Drain Efficiency (Time to Empty): A predictive metric showing how long it will take to clear the current backlog at the current processing rate.
- Backlog Saturation (New vs. Retrying): Displays the raw volume of fresh events alongside those stuck in retry loops. A climbing "Retrying" count is the primary indicator of "poison pill" messages.
- Data Freshness: Tracks the Age of the Oldest Event currently in the outbox to ensure no specific records are being "starved" or stuck.
- Delivery SLO Compliance (<(SLO variable)): Real-time tracking of the percentage of events delivered within the one-second target.
Resource Optimization & Tuning
- Batch Filling Efficiency: Measures how well the relay utilizes its maximum configured batch size versus the frequency of polling.
- Batch Size Distribution: A histogram showing the actual size of batches sent, used to tune throughput versus database load.
Latencies
- P99 End-to-End Latency: The upper bound of time (99th percentile) from the initial database insertion to successful delivery.
- E2E Latency Distribution: A heatmap visualizing the spread of delivery times to identify timing outliers.
- Publisher Performance & Latency Distribution: Dedicated tracking of the downstream system's responsiveness (e.g., Kafka, NATS) to isolate external delays.
- Storage Latency: Time taken to read from the outbox table—essential for identifying database contention or indexing issues.
Reliability & Health
- Delivery Error Rate: The percentage of total delivery attempts that resulted in an error (e.g., network timeouts or publisher rejection) relative to overall traffic.
- Failed Delivery Volume: The real-time rate of failed delivery attempts.
Note: This tracks all delivery failures including those that will be subsequently retried, providing a "noise level" for system stability.
Variables & Filtering
To get the most out of this dashboard, use the following filters at the top of the page:
Datasource: Select the Prometheus or compatible data source containing the Relay metrics.Batch Size: Dynamically adjust or filter the view based on the relay's configured batching capacity.SLO Target: Set the threshold for delivery time (e.g., 1s) to visualize compliance across all latency graphs.
Support
For technical details regarding the Open Outbox Relay implementation or to suggest dashboard improvements, please refer to the project repository at https://github.com/open-outbox/relay
Data source config
Collector config:
Upload an updated version of an exported dashboard.json file from Grafana
| Revision | Description | Created | |
|---|---|---|---|
| Download |