Caddy - Standalone Reverse Proxy
Monitors a standalone Caddy reverse proxy using Caddy's built-in Prometheus metrics. No exporter sidecar required.
Panels
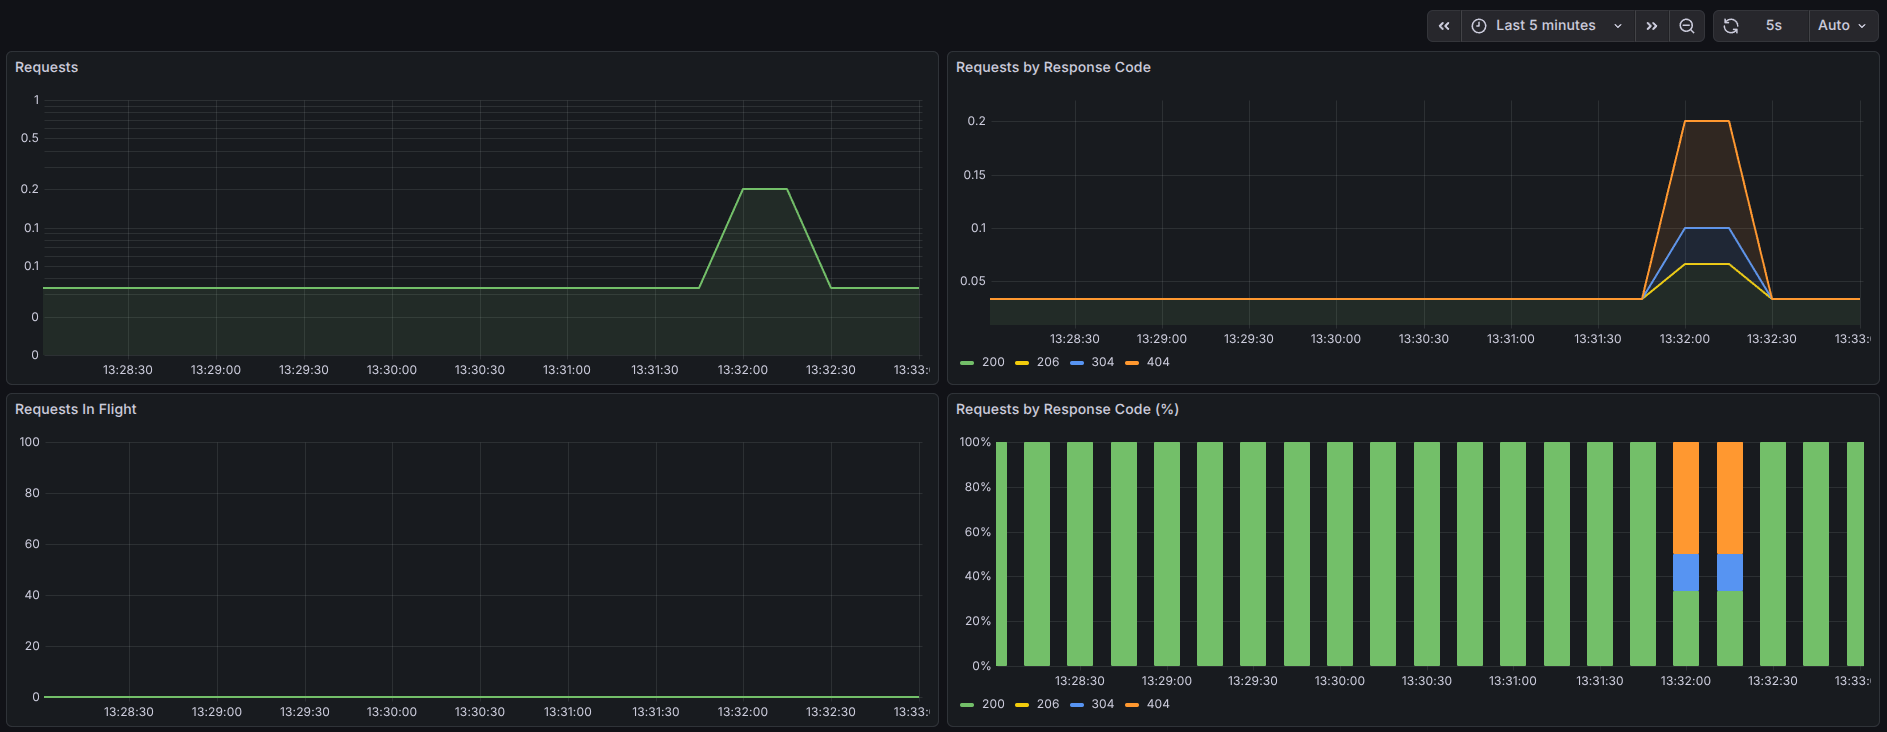
- Requests — total request rate over time
- Requests by Response Code — request rate broken down by HTTP status code
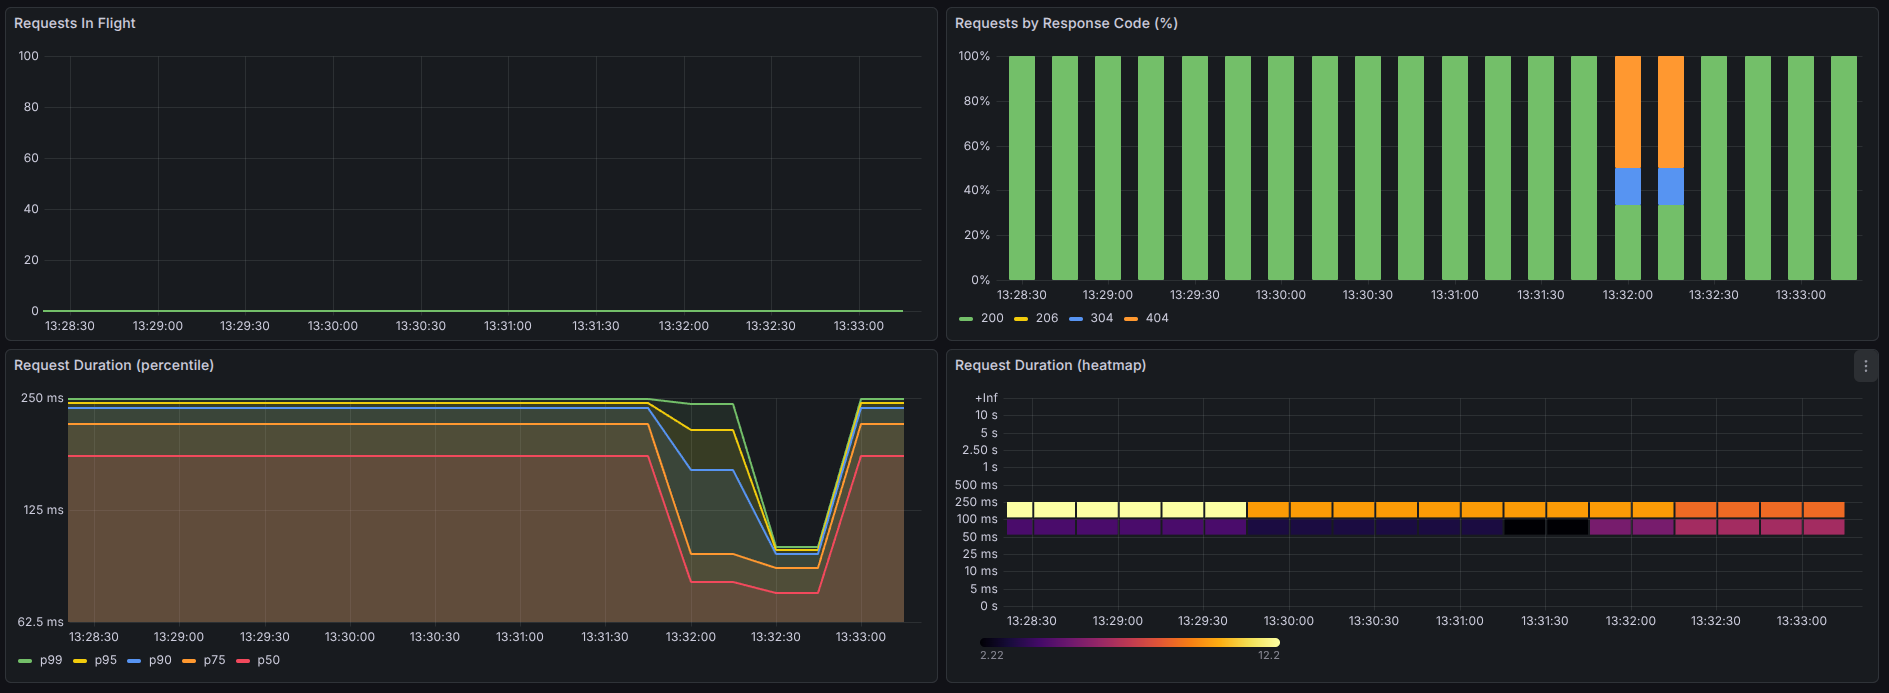
- Requests In Flight — average concurrent requests being handled
- Requests by Response Code (%) — response code distribution as a percentage
- Request Duration (percentile) — p50/p75/p90/p95/p99 latency over time
- Request Duration (heatmap) — latency distribution heatmap
Requirements
- Caddy 2.x with
metricsenabled in the global options block - Prometheus scraping Caddy's admin API (
/metricson port 2019)
Notes
This dashboard is designed for standalone Caddy instances (not in-cluster Kubernetes deployments). It uses the native caddy_ metrics exposed by Caddy itself. No third-party exporter needed.
Data source config
Collector type:
Collector plugins:
Collector config:
Revisions
Upload an updated version of an exported dashboard.json file from Grafana
| Revision | Description | Created | |
|---|---|---|---|
| Download |
Caddy
Easily monitor Caddy, an open source web server written in Go, with Grafana Cloud's out-of-the-box monitoring solution.
Learn more