RabbitMQ Per Object
Per-queue and per-exchange RabbitMQ metrics for debugging. Uses the /metrics/per-object endpoint of the rabbitmq_prometheus plugin (scraped by the `rabbitmq-per-object` Prometheus job).
RabbitMQ Per Object
Per-queue and per-exchange debugging dashboard for RabbitMQ, powered by the /metrics/per-object endpoint of the rabbitmq_prometheus plugin.
Built for on-call engineers and service owners who need to answer questions like "is this queue backed up?", "is this consumer keeping up?", or "is the message I published actually reaching its queue?". It is not a broker-health overview — pair it with the stock RabbitMQ-Overview dashboard for that.
Source: github.com/SonyCore/rabbitmq-per-object-dashboard — file issues and feature requests there.
Prerequisites
RabbitMQ with the
rabbitmq_prometheusplugin enabled:rabbitmq-plugins enable rabbitmq_prometheusThe per-object endpoint is exposed on port
15692at/metrics/per-object. See the RabbitMQ Prometheus docs.Prometheus scraping that endpoint under job name
rabbitmq-per-objectwith anenvlabel:scrape_configs: - job_name: rabbitmq-per-object metrics_path: /metrics/per-object scrape_interval: 30s static_configs: - targets: ['staging.local:15692'] labels: { env: staging } - targets: ['production.local:15692'] labels: { env: production }Every query in this dashboard is pinned to
job="rabbitmq-per-object". If you use a different job name, search-and-replace it in the JSON after import.Grafana 12.3+ with a Prometheus datasource.
How to use it
- Pick the env (e.g.
staging,production). - Narrow down the vhost (defaults to all).
- Set queue and/or exchange to the object(s) you're investigating.
- Walk top-to-bottom — rows are ordered to match a typical debug flow.
Template variables
| Variable | Notes |
|---|---|
env | Required. Sourced from the Prometheus job's env label. |
vhost | Multi-select, defaults to all. |
queue | Multi-select. Scoped by env, vhost, and exchange. |
exchange | Multi-select, defaults to all. |
Panels
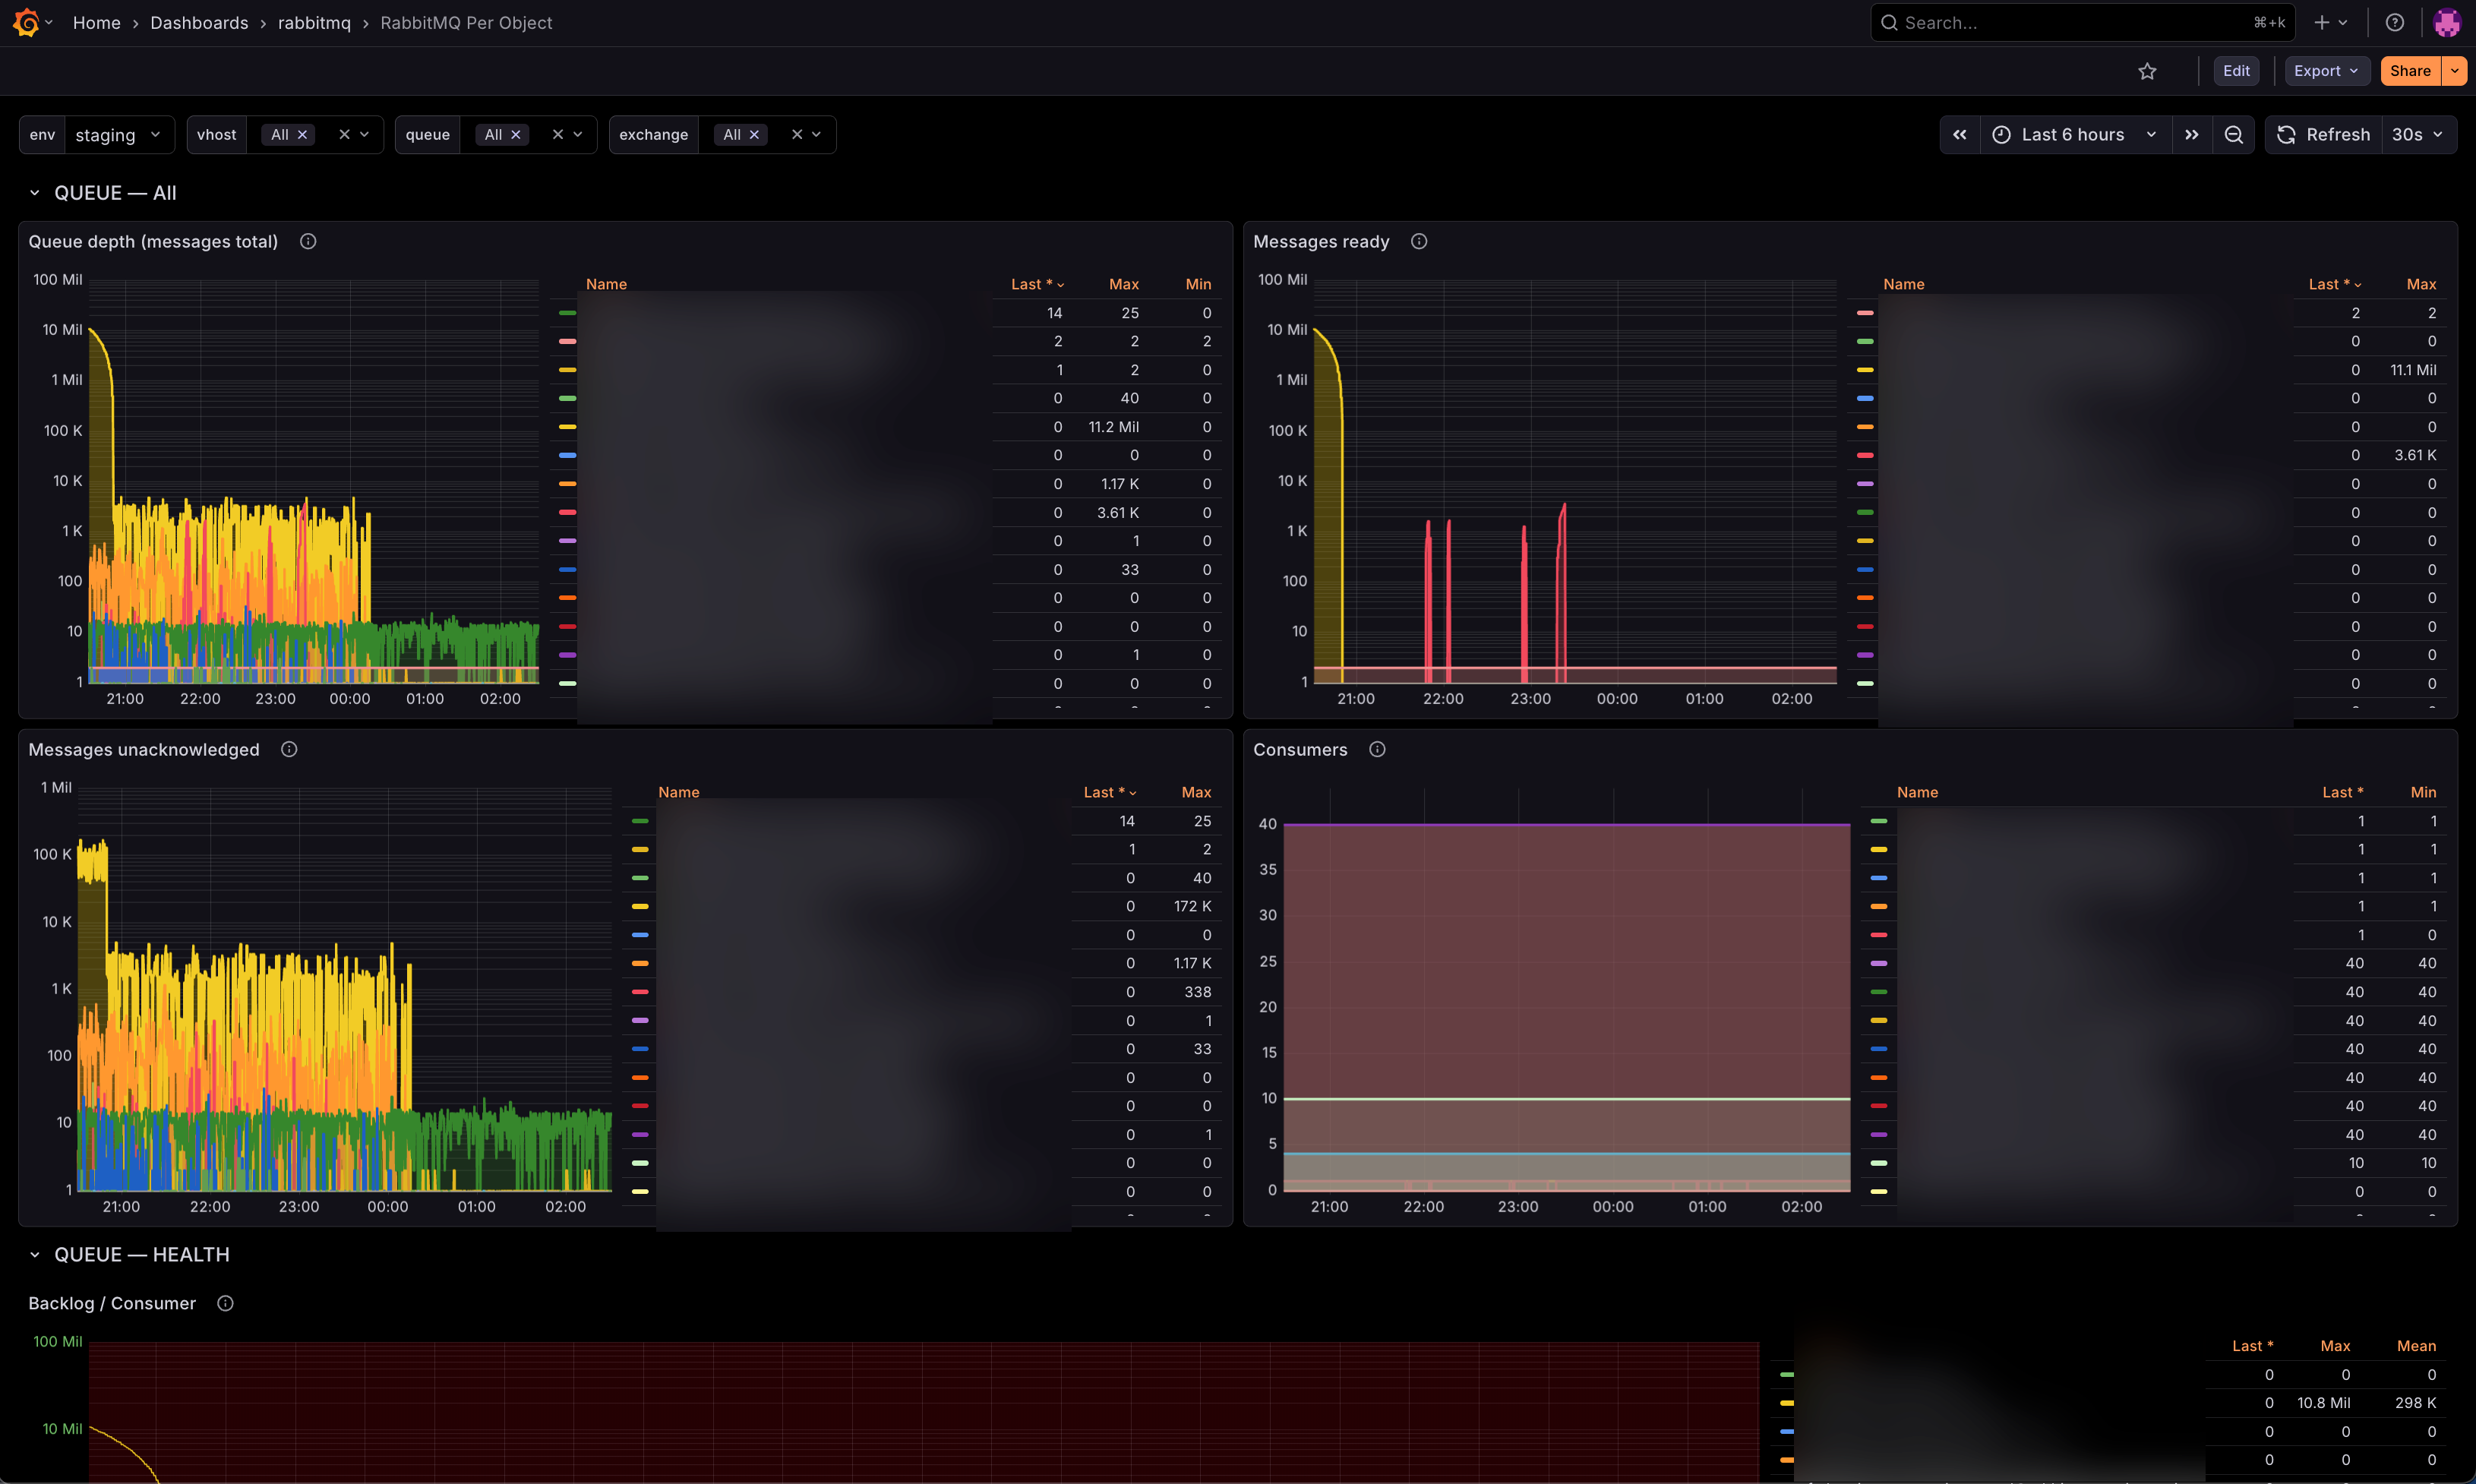
QUEUE — state Queue depth (ready + unacked) · Messages ready · Messages unacknowledged · Consumers.
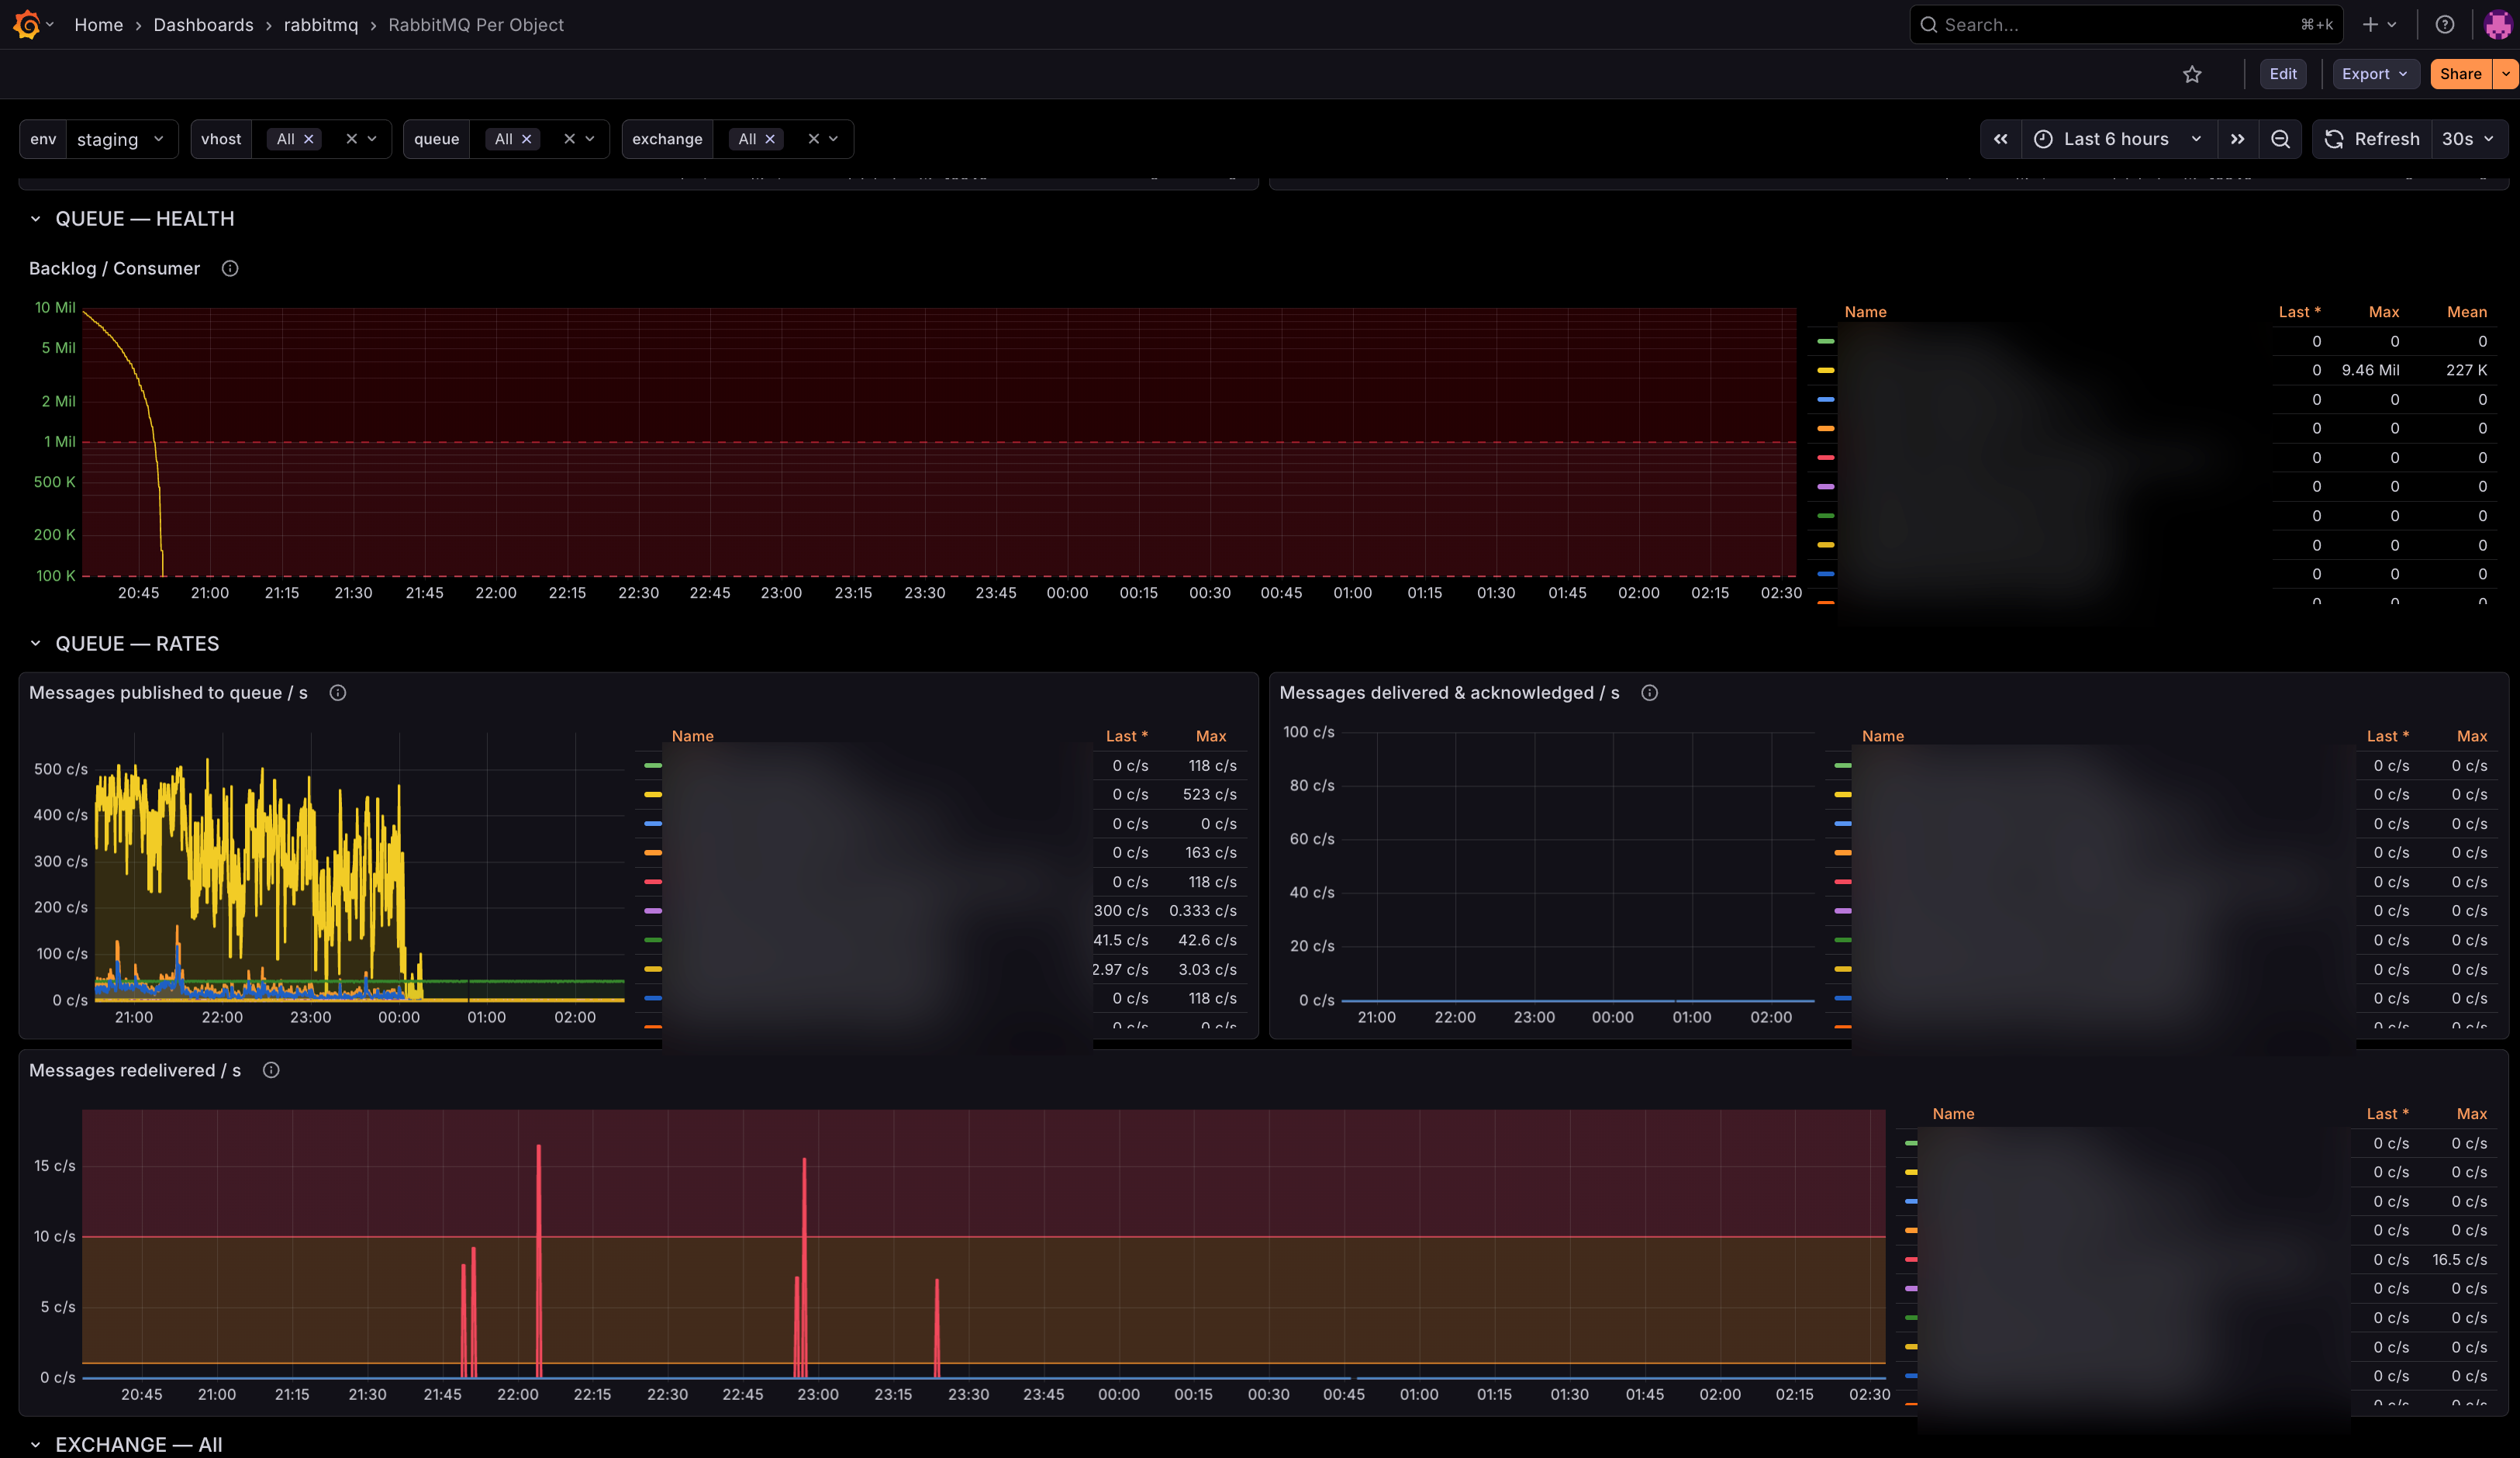
QUEUE — health
Backlog per consumer (messages_ready / consumers) as a rough drain-timer signal.
QUEUE — rates Publish rate into the queue · Delivered & acknowledged rate · Redelivery rate.
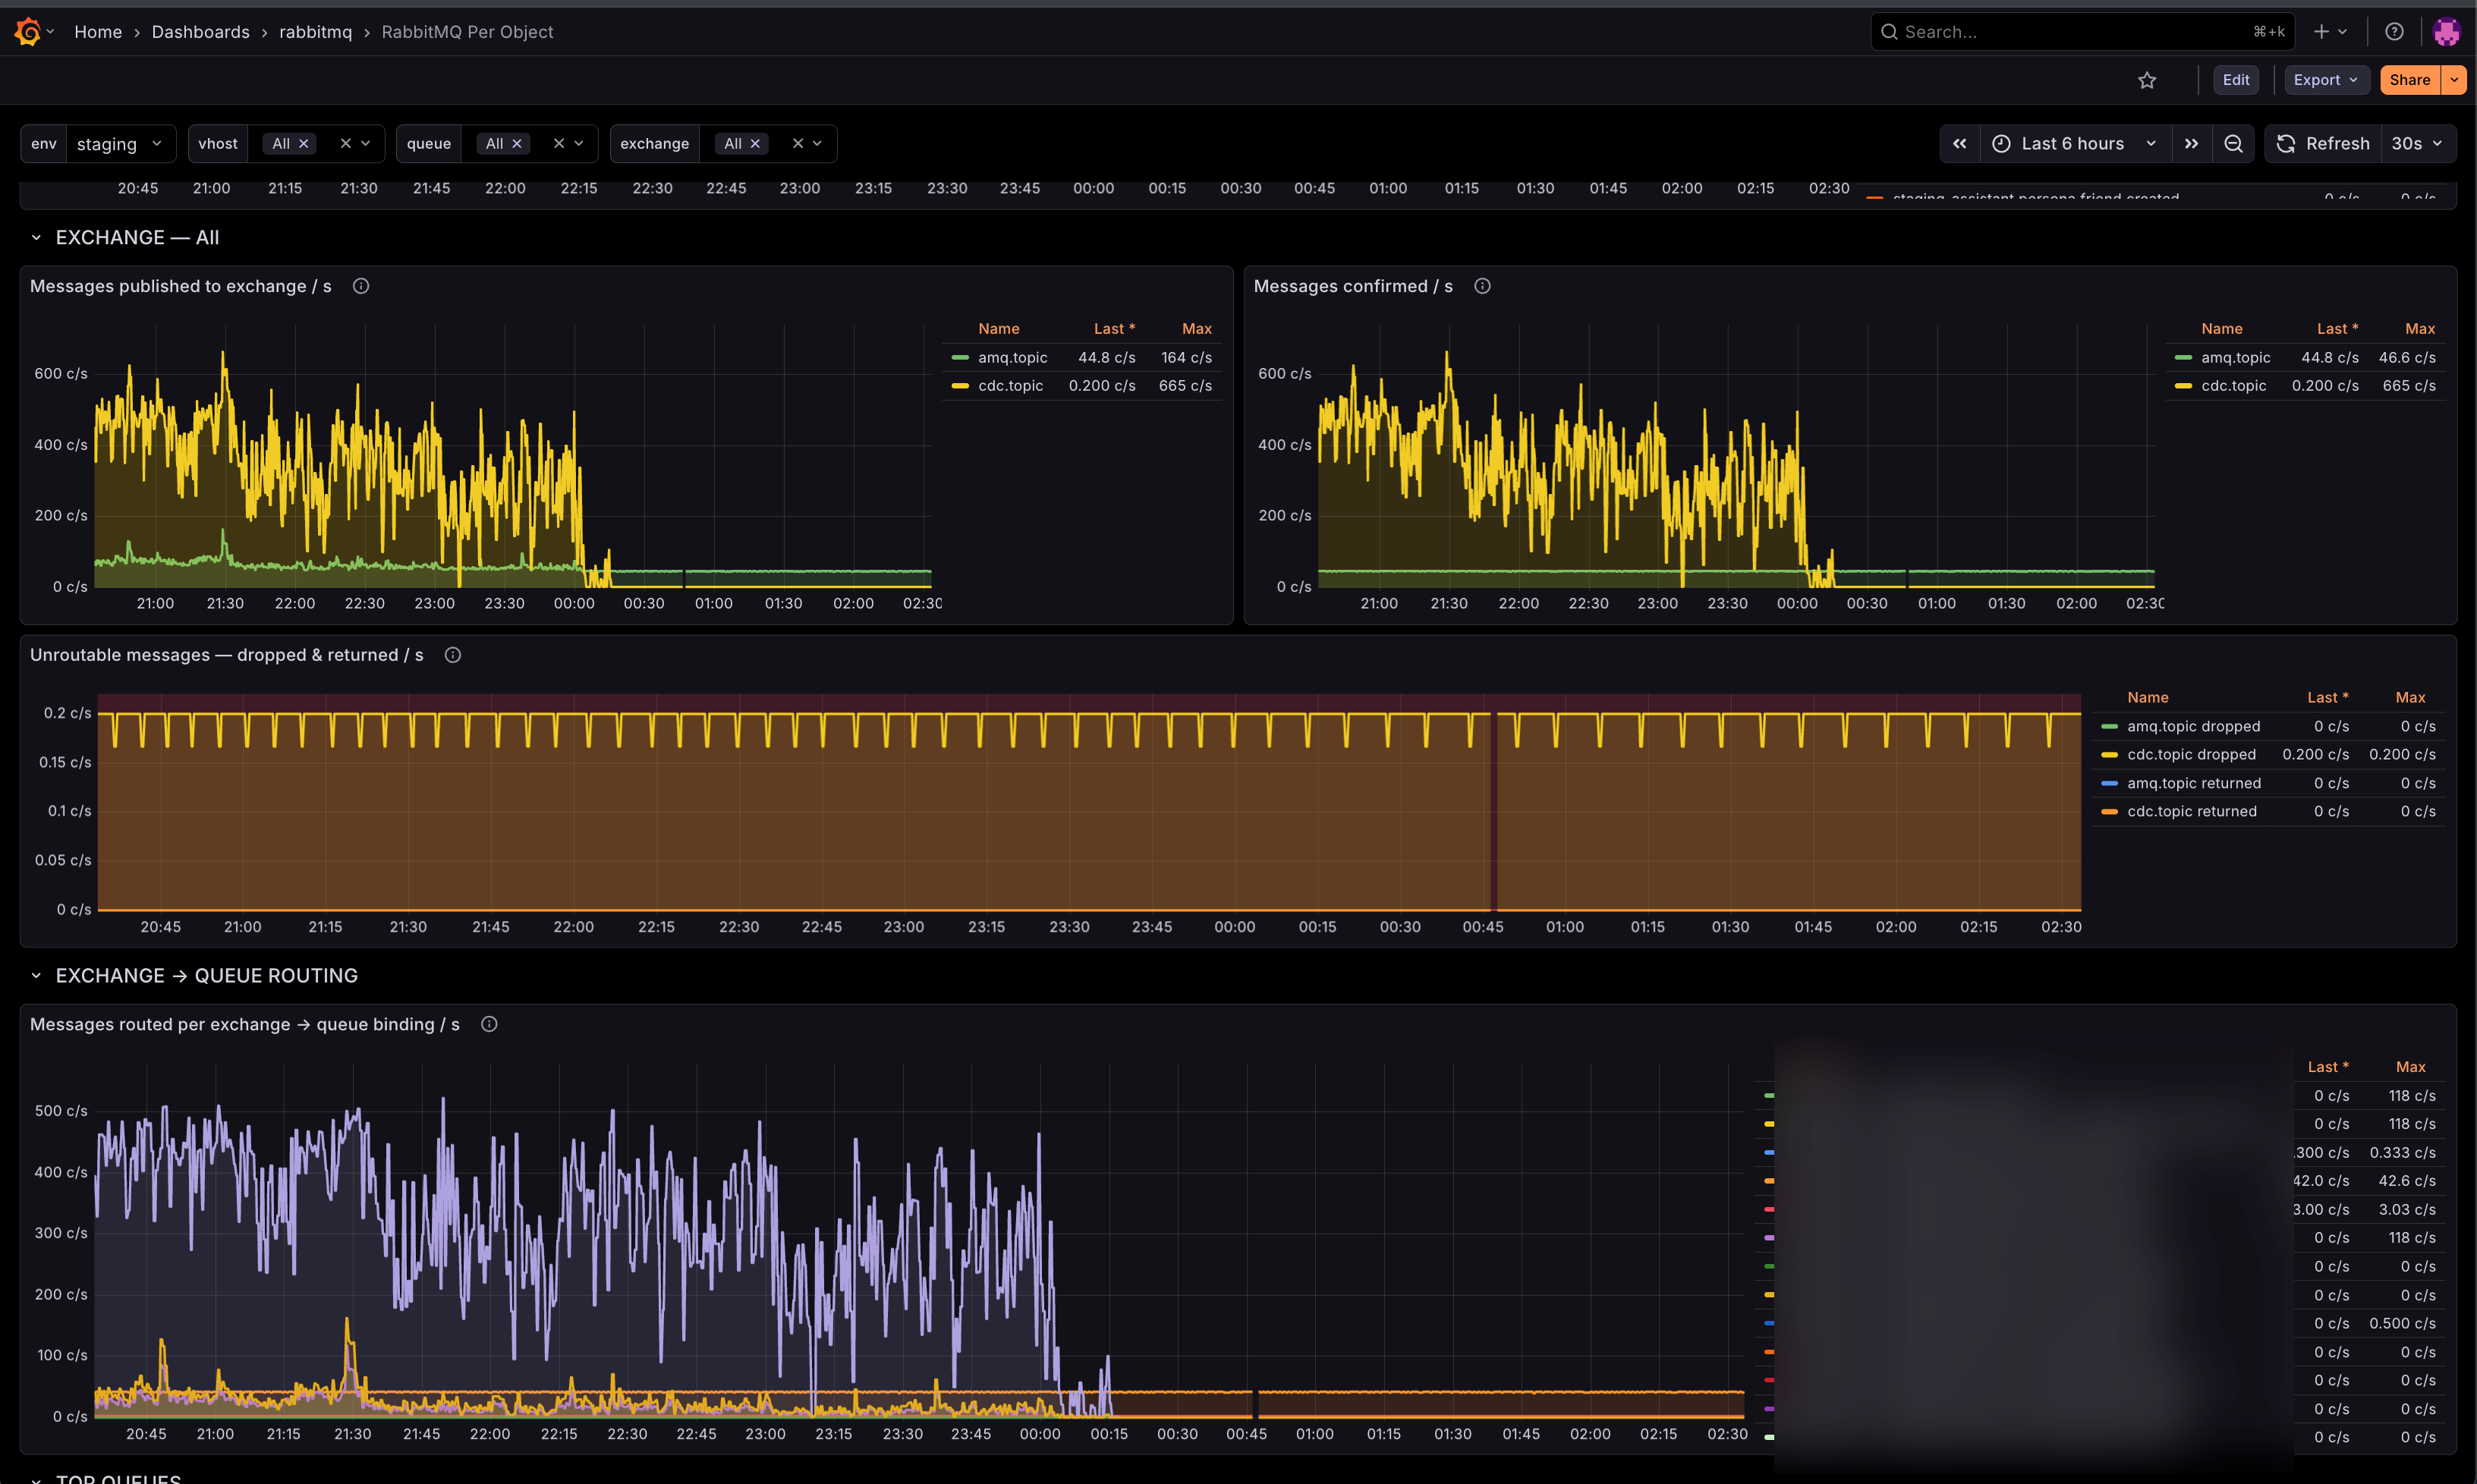
EXCHANGE Publish rate · Confirm rate · Unroutable (dropped & returned) — any sustained non-zero value on the last one means message loss or a routing/binding bug.
EXCHANGE → QUEUE ROUTING
Per-binding routing rate, grouped by (exchange, queue). Verifies that a message published to exchange X is actually landing in queue Y.
TOP QUEUES / TOP EXCHANGES Fleet-wide top 20 queues by depth and top 20 exchanges by publish rate. Ignores the queue/exchange filters so you always see the biggest offenders.
Metrics required
All from the RabbitMQ per-object endpoint:
rabbitmq_queue_messagesrabbitmq_queue_messages_readyrabbitmq_queue_messages_unackedrabbitmq_queue_consumersrabbitmq_queue_messages_published_totalrabbitmq_queue_messages_delivered_totalrabbitmq_queue_messages_acknowledged_totalrabbitmq_queue_messages_redelivered_totalrabbitmq_channel_messages_published_totalrabbitmq_channel_messages_confirmed_totalrabbitmq_channel_messages_unroutable_dropped_totalrabbitmq_channel_messages_unroutable_returned_total
License
MIT.
Data source config
Collector config:
Upload an updated version of an exported dashboard.json file from Grafana
| Revision | Description | Created | |
|---|---|---|---|
| Download |
RabbitMQ
Easily monitor RabbitMQ, the most widely deployed open source message broker, with Grafana Cloud's out-of-the-box monitoring solution.
Learn more