Qdrant Observatory
Per-collection, per-shard, cluster health and search performance for self-hosted Qdrant. Powered by qdrant-exporter.


Qdrant Observatory — Grafana Dashboard
A full observability dashboard for self-hosted Qdrant — surfaces per-collection, per-shard, cluster health, and search performance metrics that Qdrant's native /metrics endpoint doesn't expose.
Powered by qdrant-exporter, an open-source Prometheus exporter that reads from Qdrant's /telemetry and /cluster JSON endpoints and converts them into Prometheus metrics.
What's in this dashboard
29 panels across 4 rows:
| Row | What it shows |
|---|---|
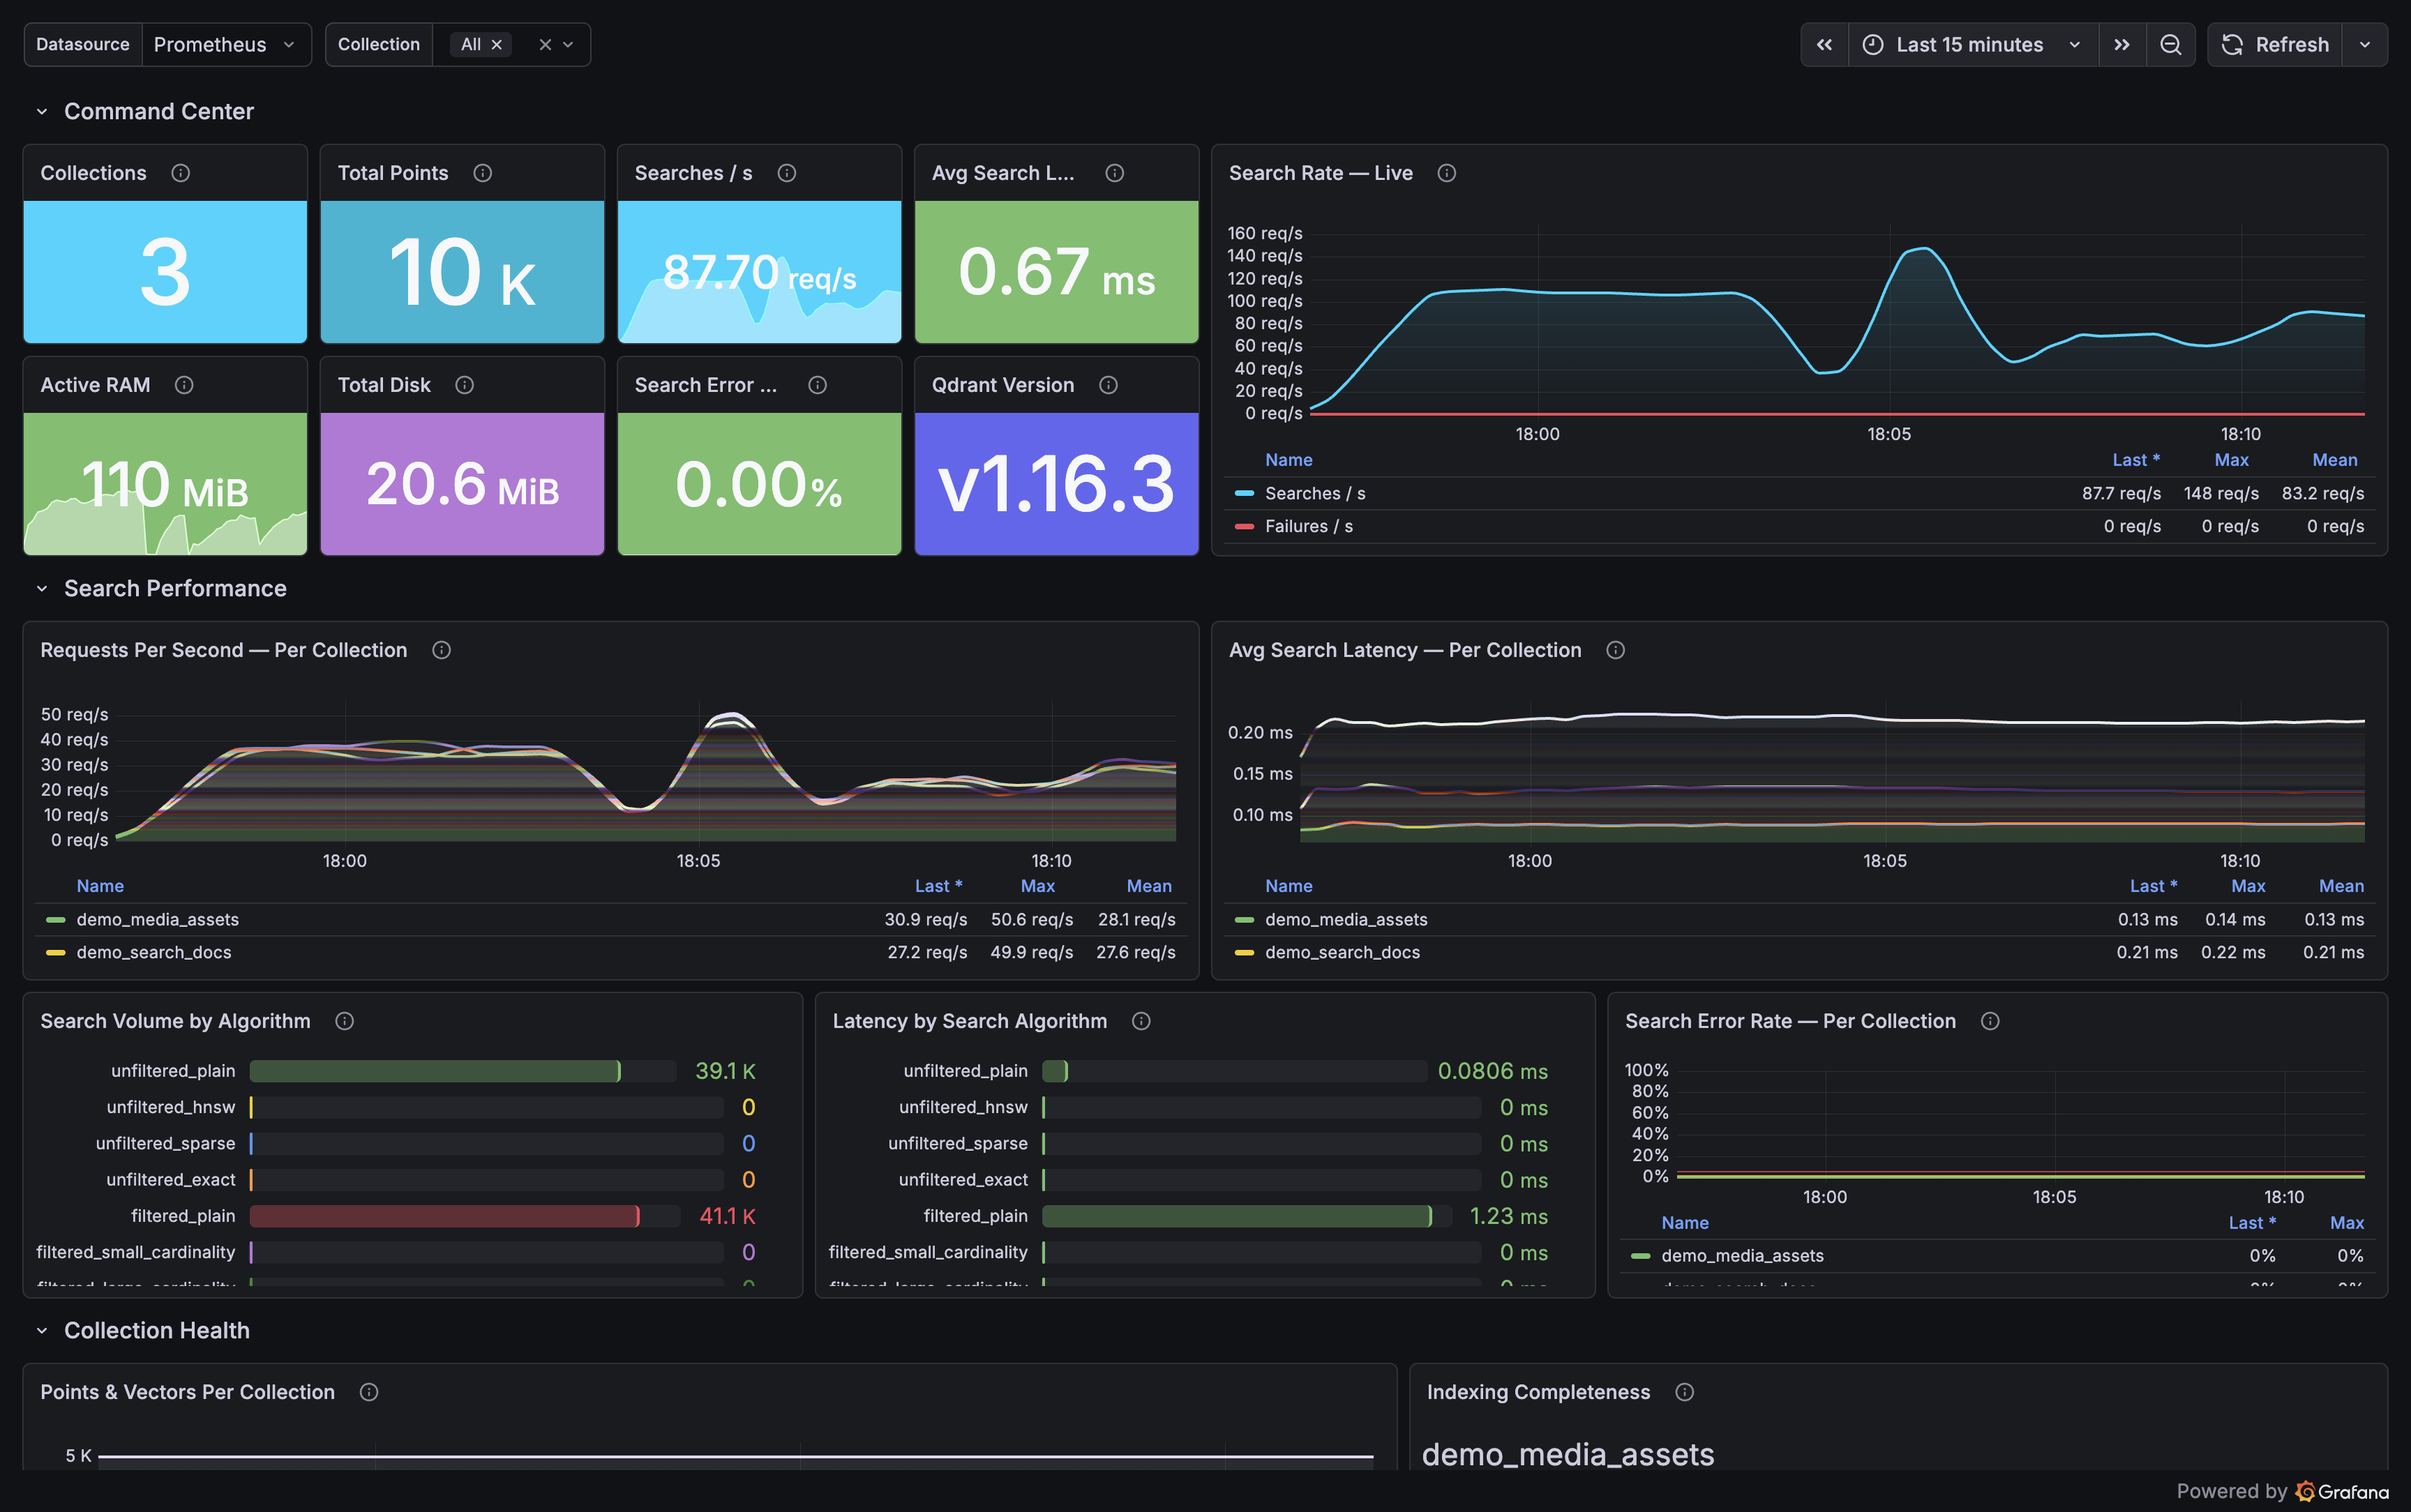
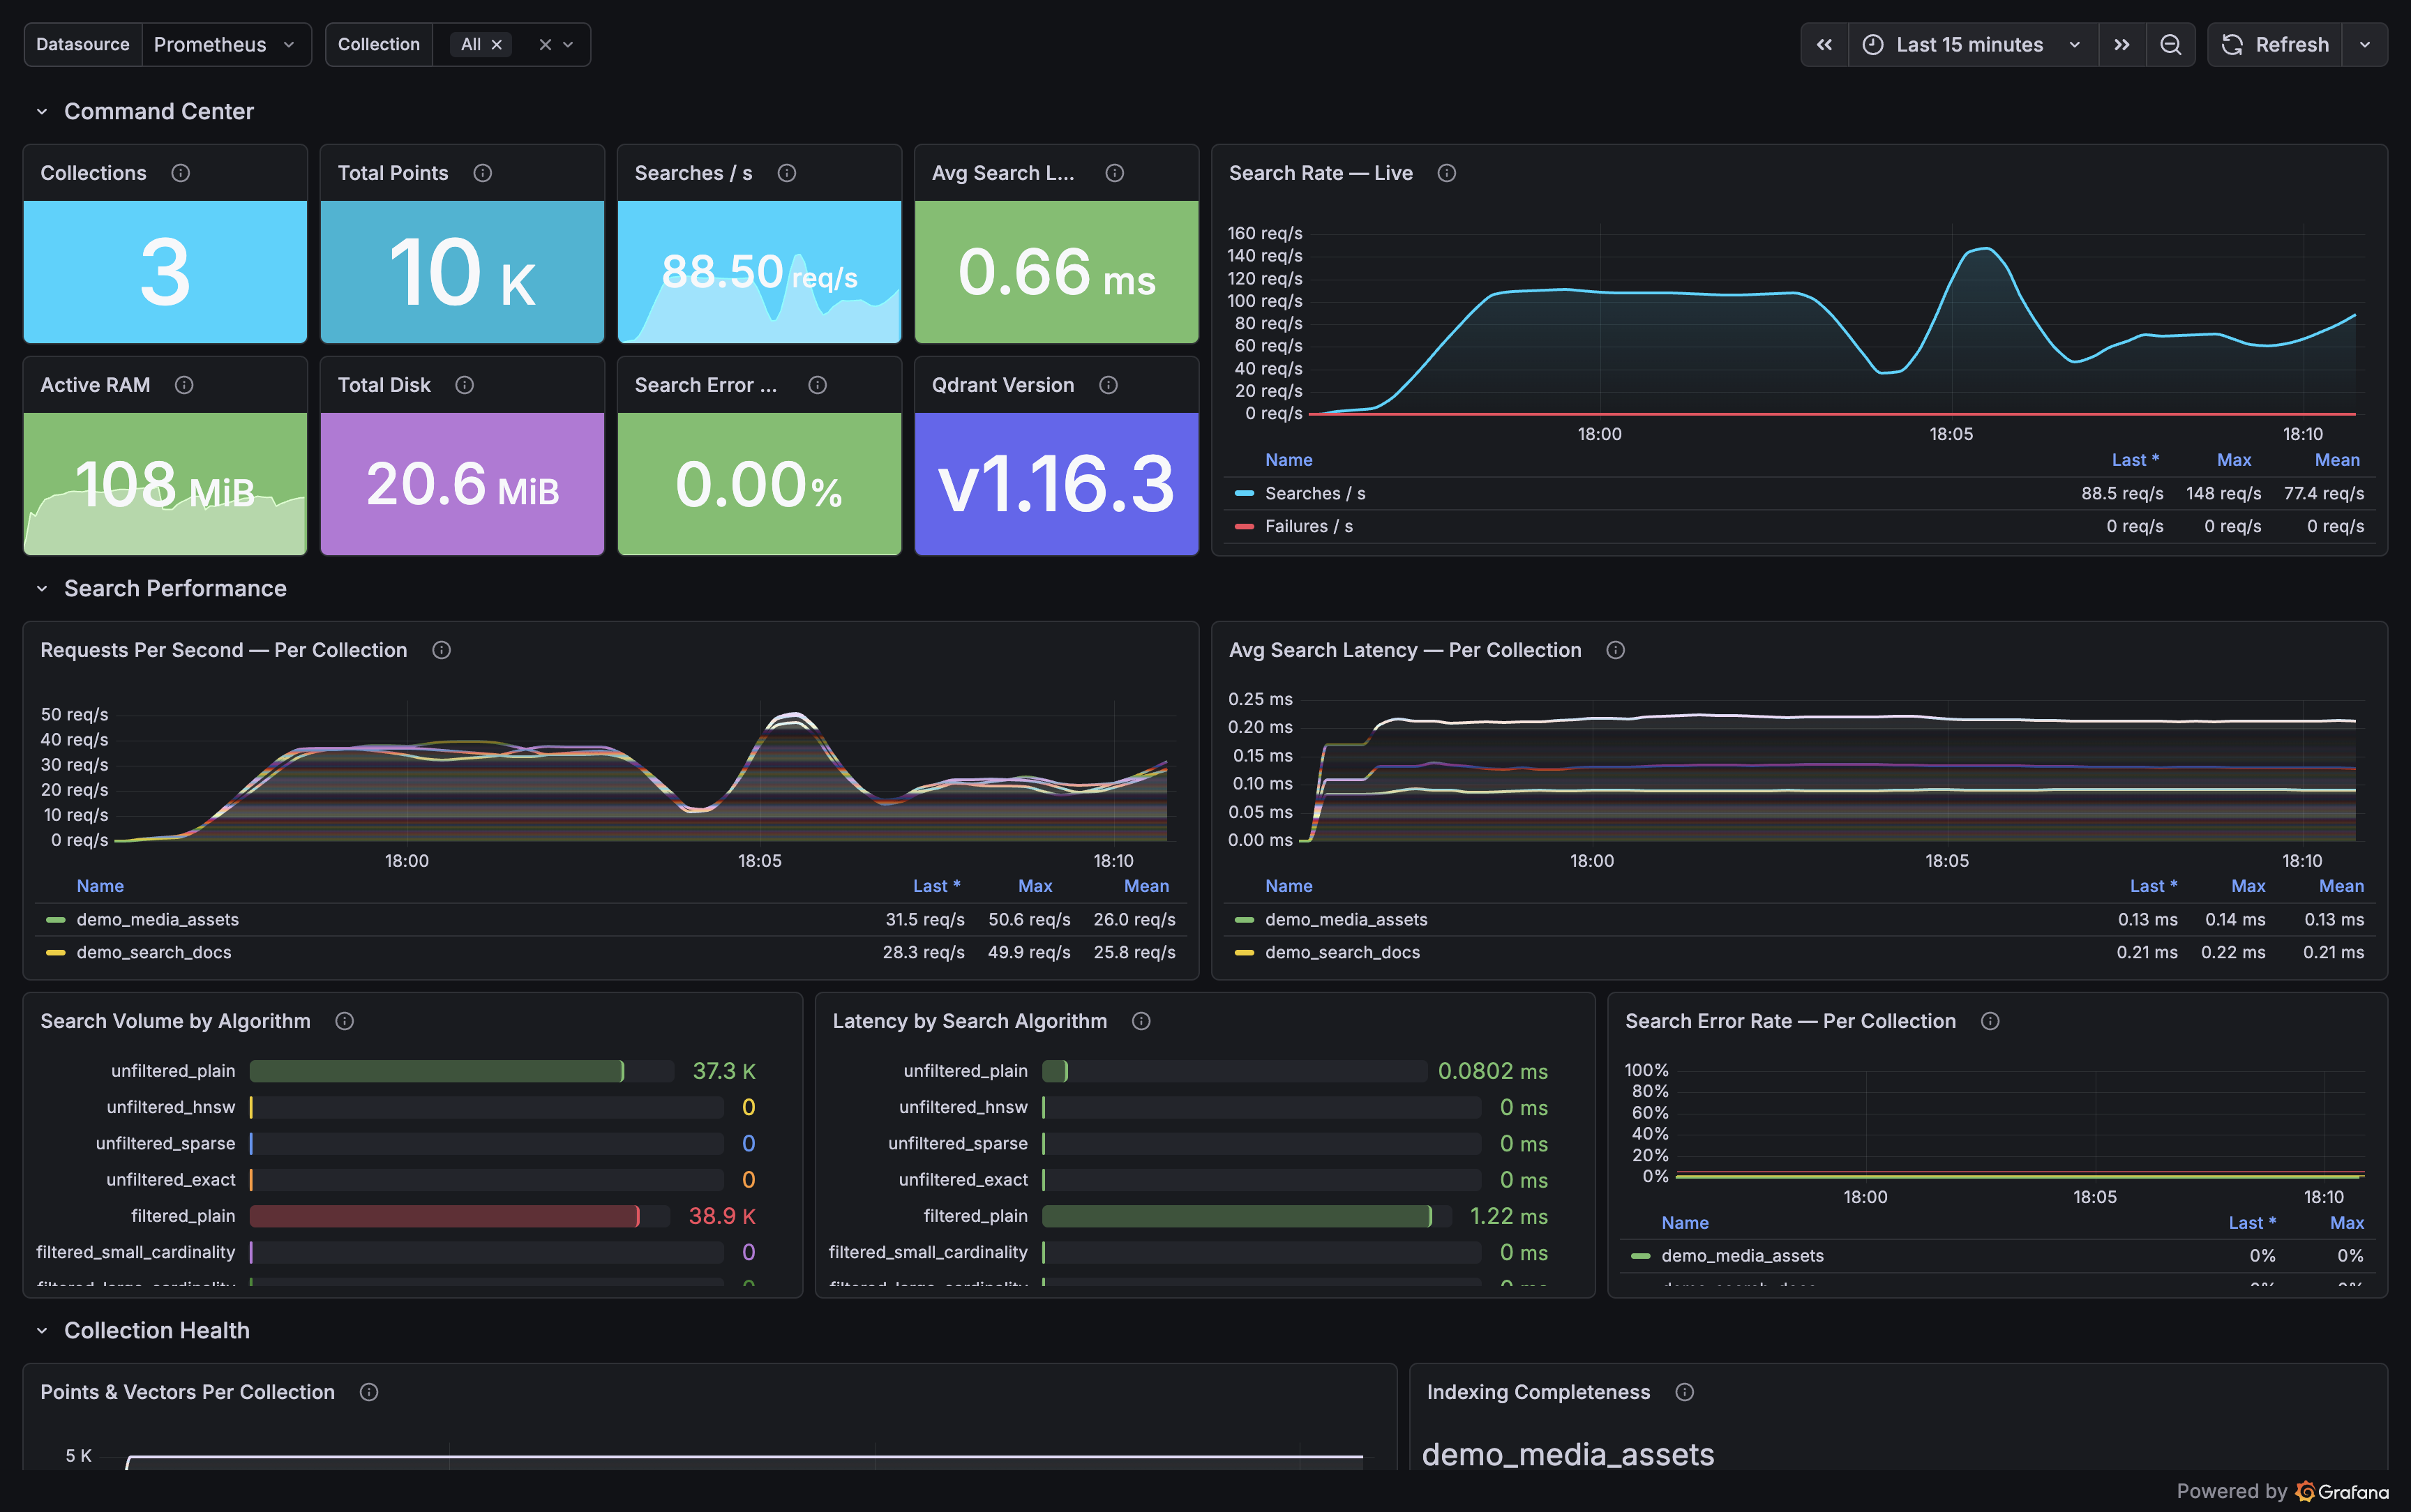
| Command Center | Total collections, vectors, points, memory usage, cluster status |
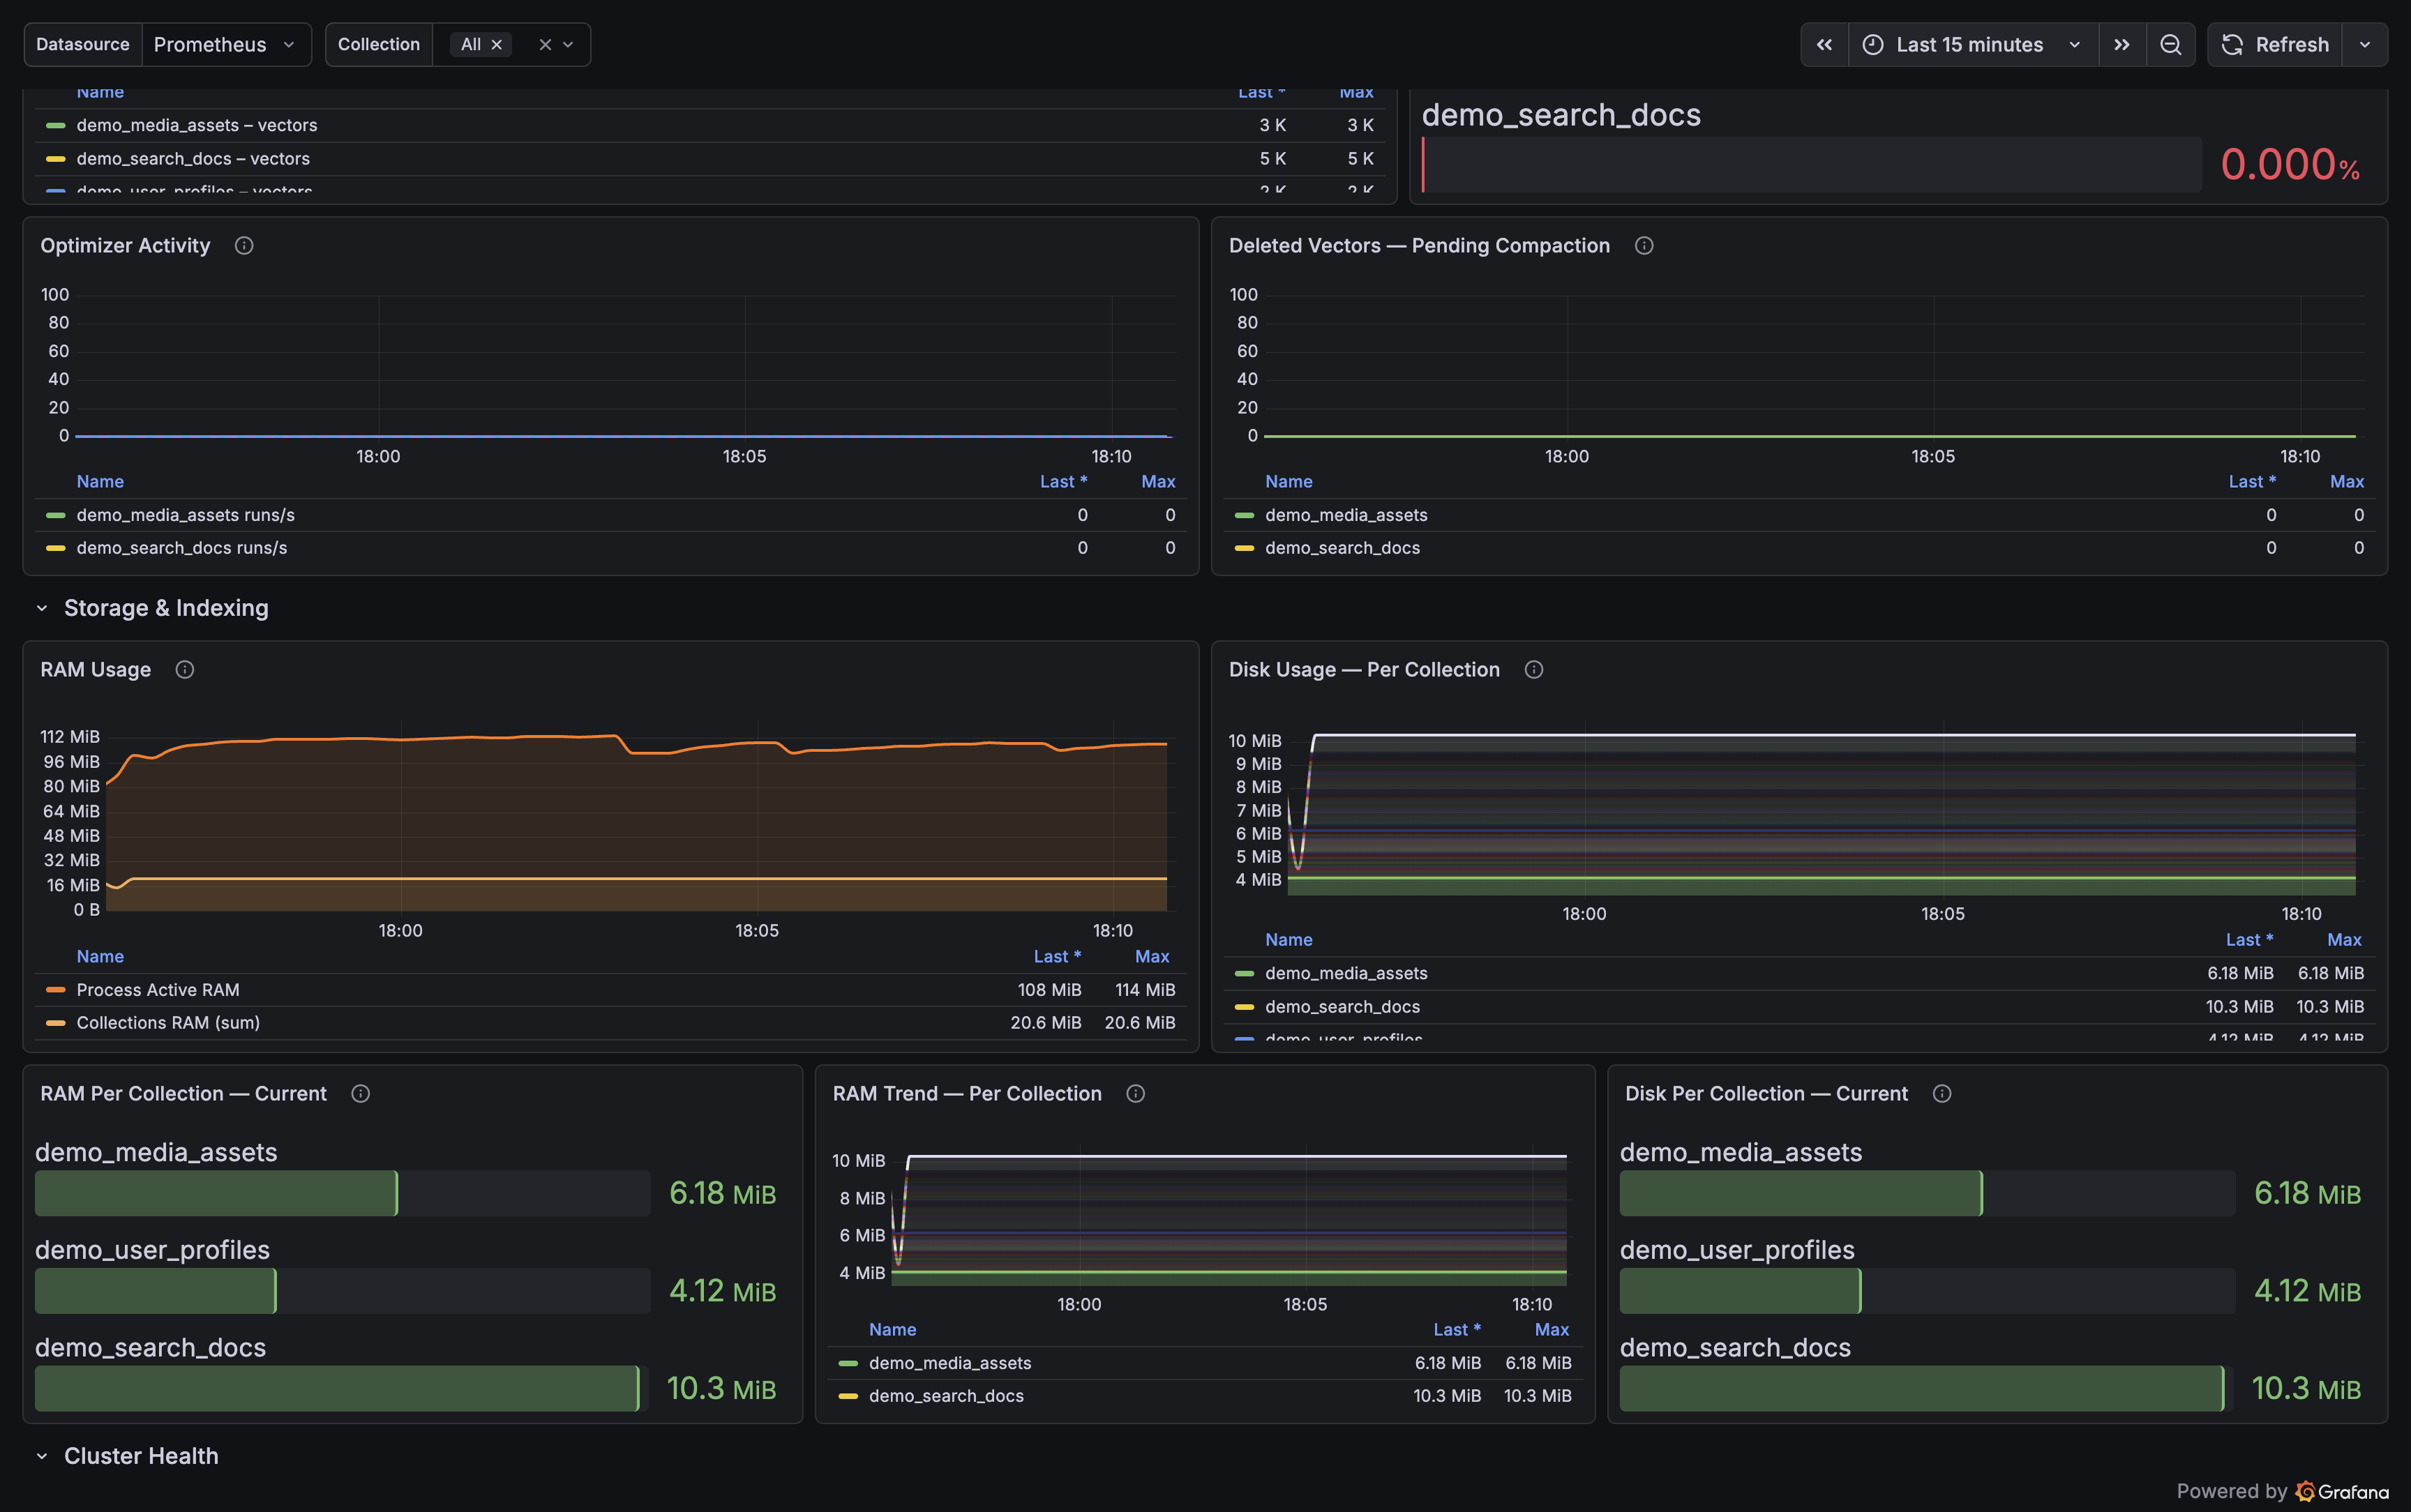
| Collections | Per-collection vector counts, indexed ratio, shard states, optimizer status |
| Performance | Search rate by type, average latency, optimizer activity, deleted vectors |
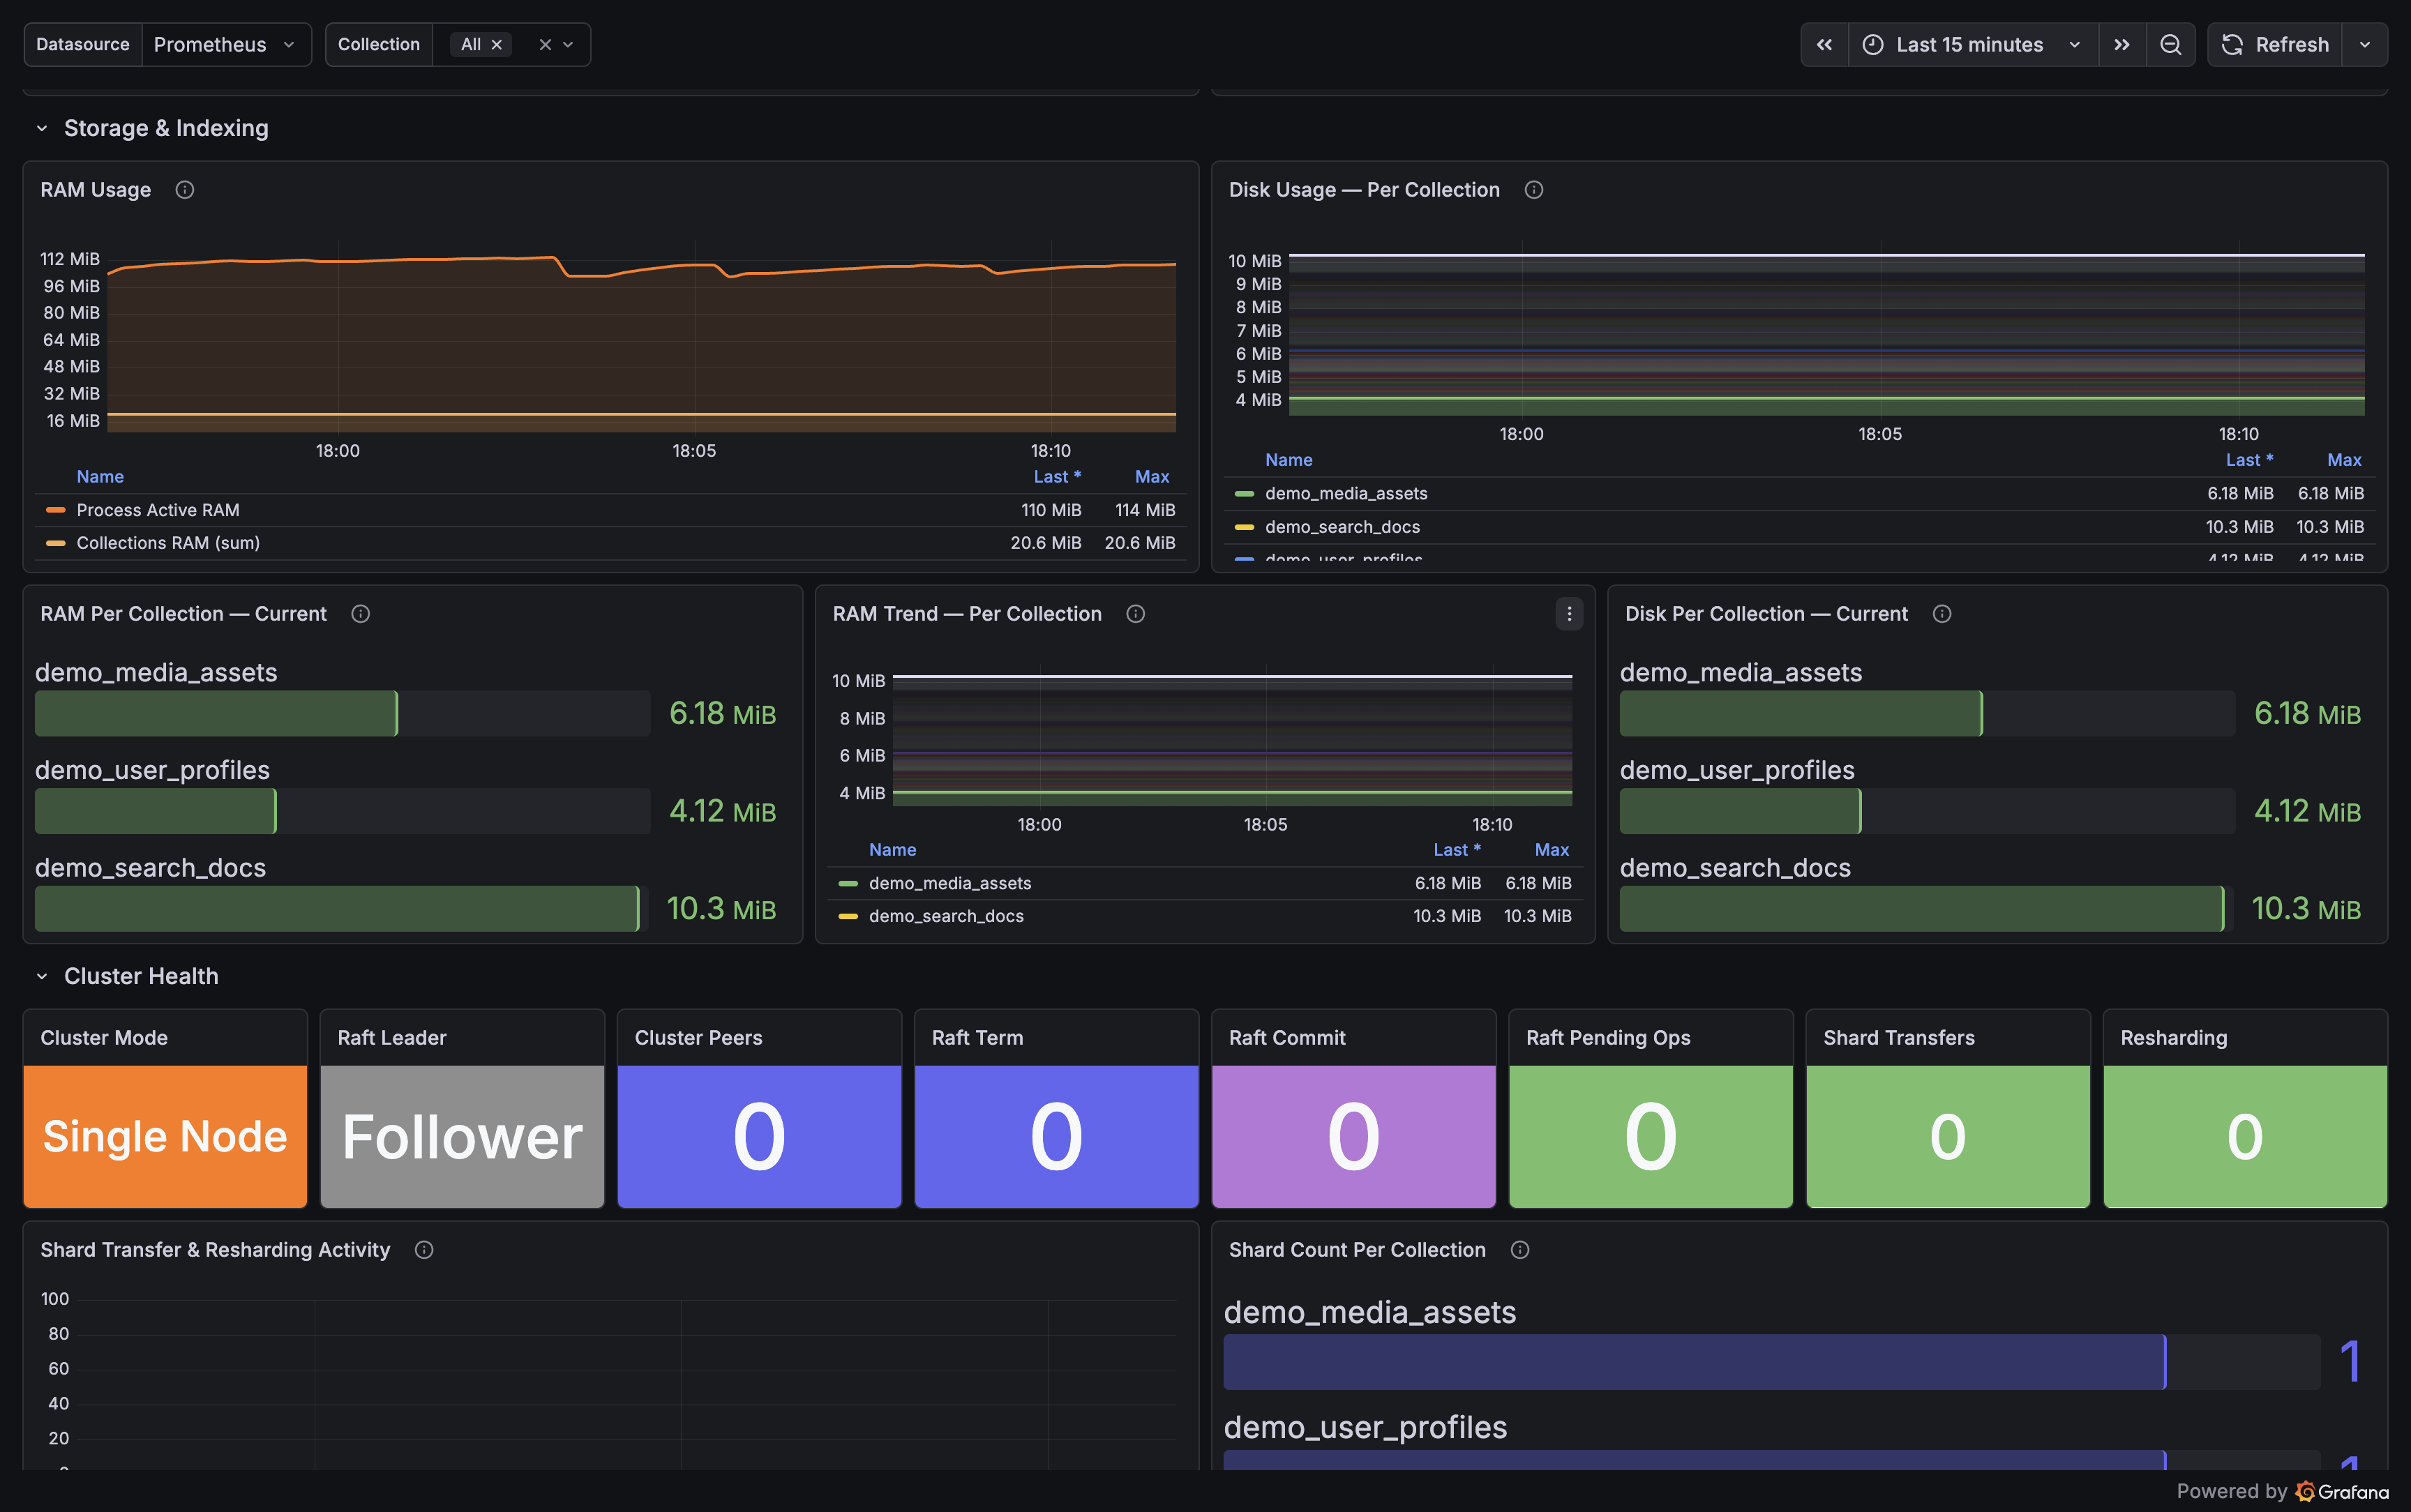
| Cluster | Raft term/commit, peer count, active shard transfers, resharding operations |
Key metrics not available in native Qdrant /metrics:
- Vectors and points per collection
- Indexed vectors ratio — below 1.0 means searches may fall back to brute force
- Live optimizer state per collection
- Search latency broken down by search path type (HNSW, plain, filtered, exact, sparse)
- Shard transfer progress
- Raft consensus health
Requirements
- Grafana 10+
- Prometheus scraping qdrant-exporter on port
9153 - Qdrant v1.7.0+ (fully tested on v1.13.0 – v1.17.1)
Setup
The easiest way is via the bundled Docker Compose in the exporter repo — one command gives you Qdrant, the exporter, Prometheus, and this dashboard fully wired:
# Full stack from scratch
docker compose --profile fullstack up -d
Or attach to an existing Qdrant on localhost:6333
docker compose –profile monitoring up -d
Grafana opens at http://localhost:3000 (admin / admin) with the dashboard auto-provisioned.
For manual setup, import qdrant-overview.json and point the DS_PROMETHEUS input at the Prometheus instance that scrapes qdrant-exporter.
Links
- Exporter repo: https://github.com/baselhusam/qdrant_exporter
- Qdrant docs: https://qdrant.tech/documentation
Data source config
Collector config:
Upload an updated version of an exported dashboard.json file from Grafana
| Revision | Description | Created | |
|---|---|---|---|
| Download |