Skywalking Root
SkyWalking General Root Dashboard is a comprehensive monitoring solution that provides real-time visibility into your application's performance and health metrics.
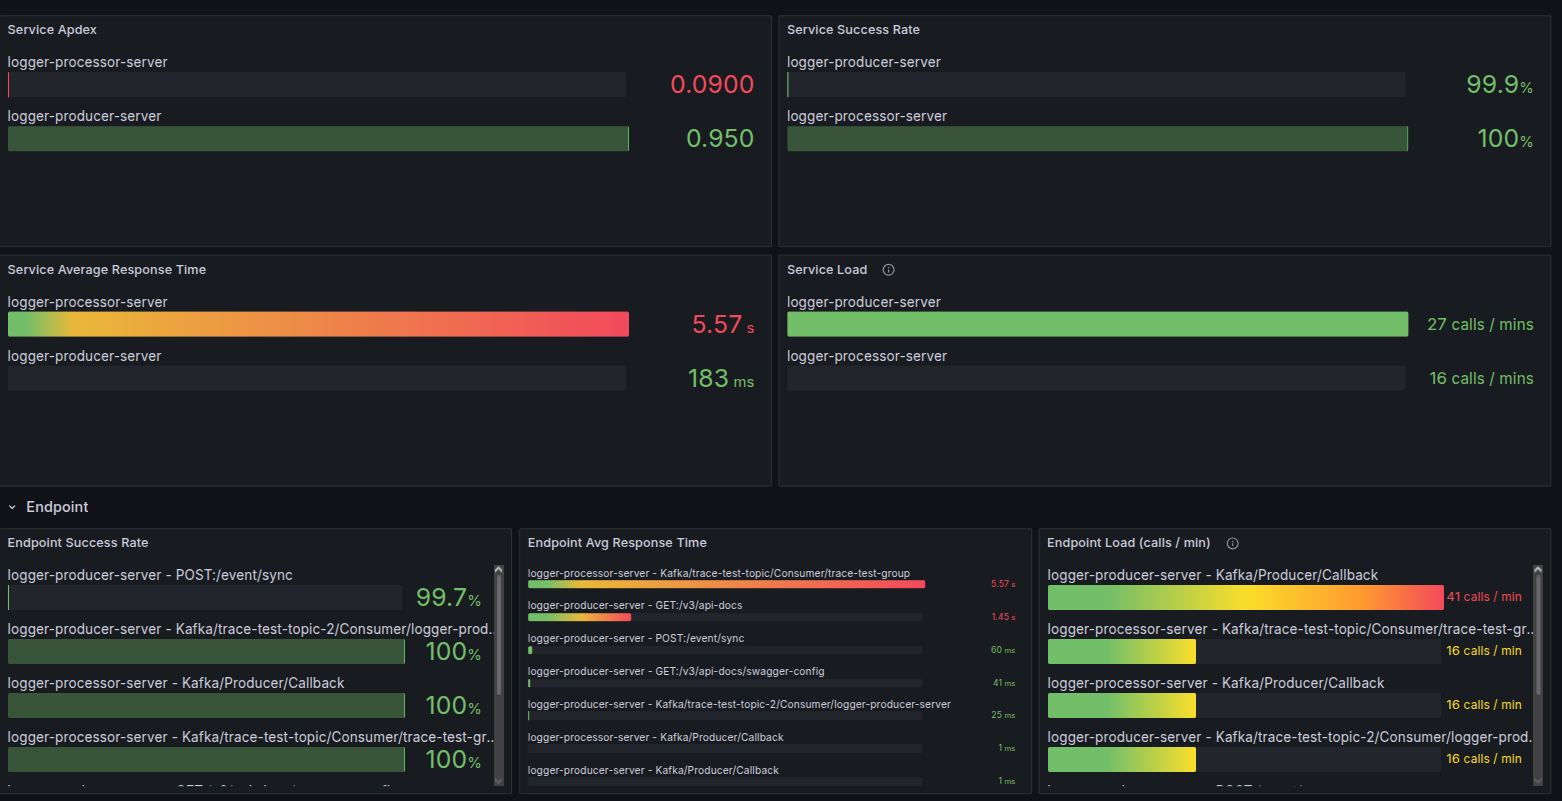
Dashboard Overview
SkyWalking General Root Dashboard is a comprehensive monitoring solution that provides real-time visibility into your application's performance and health metrics.
Key Features Real-time Metrics: Monitor application performance with up-to-date metrics and visualization Root Cause Analysis: Identify performance bottlenecks and system issues at a glance Service Health Monitoring: Track the health status of all services in your infrastructure Request Tracing: Visualize request flows and identify latency issues Error Rate Tracking: Monitor error rates and failure patterns across your application Resource Utilization: View CPU, memory, and other system resource consumption Dependency Mapping: Understand service dependencies and communication patterns
Use Cases This dashboard is ideal for: DevOps Teams: Monitor application infrastructure and performance in production Application Teams: Track application health and identify performance issues Operations: Detect anomalies and respond to incidents quickly Performance Analysis: Investigate slow transactions and optimize critical paths
Data Source All metrics are powered by Apache SkyWalking, an open-source observability platform that provides APM (Application Performance Monitoring), tracing, and diagnostics capabilities.
Dashboard Benefits ✅ Centralized monitoring and alerting ✅ Quick incident detection and response ✅ Data-driven performance optimization ✅ Improved system reliability and uptime
Feel free to customize this explanation based on your specific dashboard panels and metrics!
Data source config
Collector config:
Upload an updated version of an exported dashboard.json file from Grafana
| Revision | Description | Created | |
|---|---|---|---|
| Download |