Telemt Proxy Health
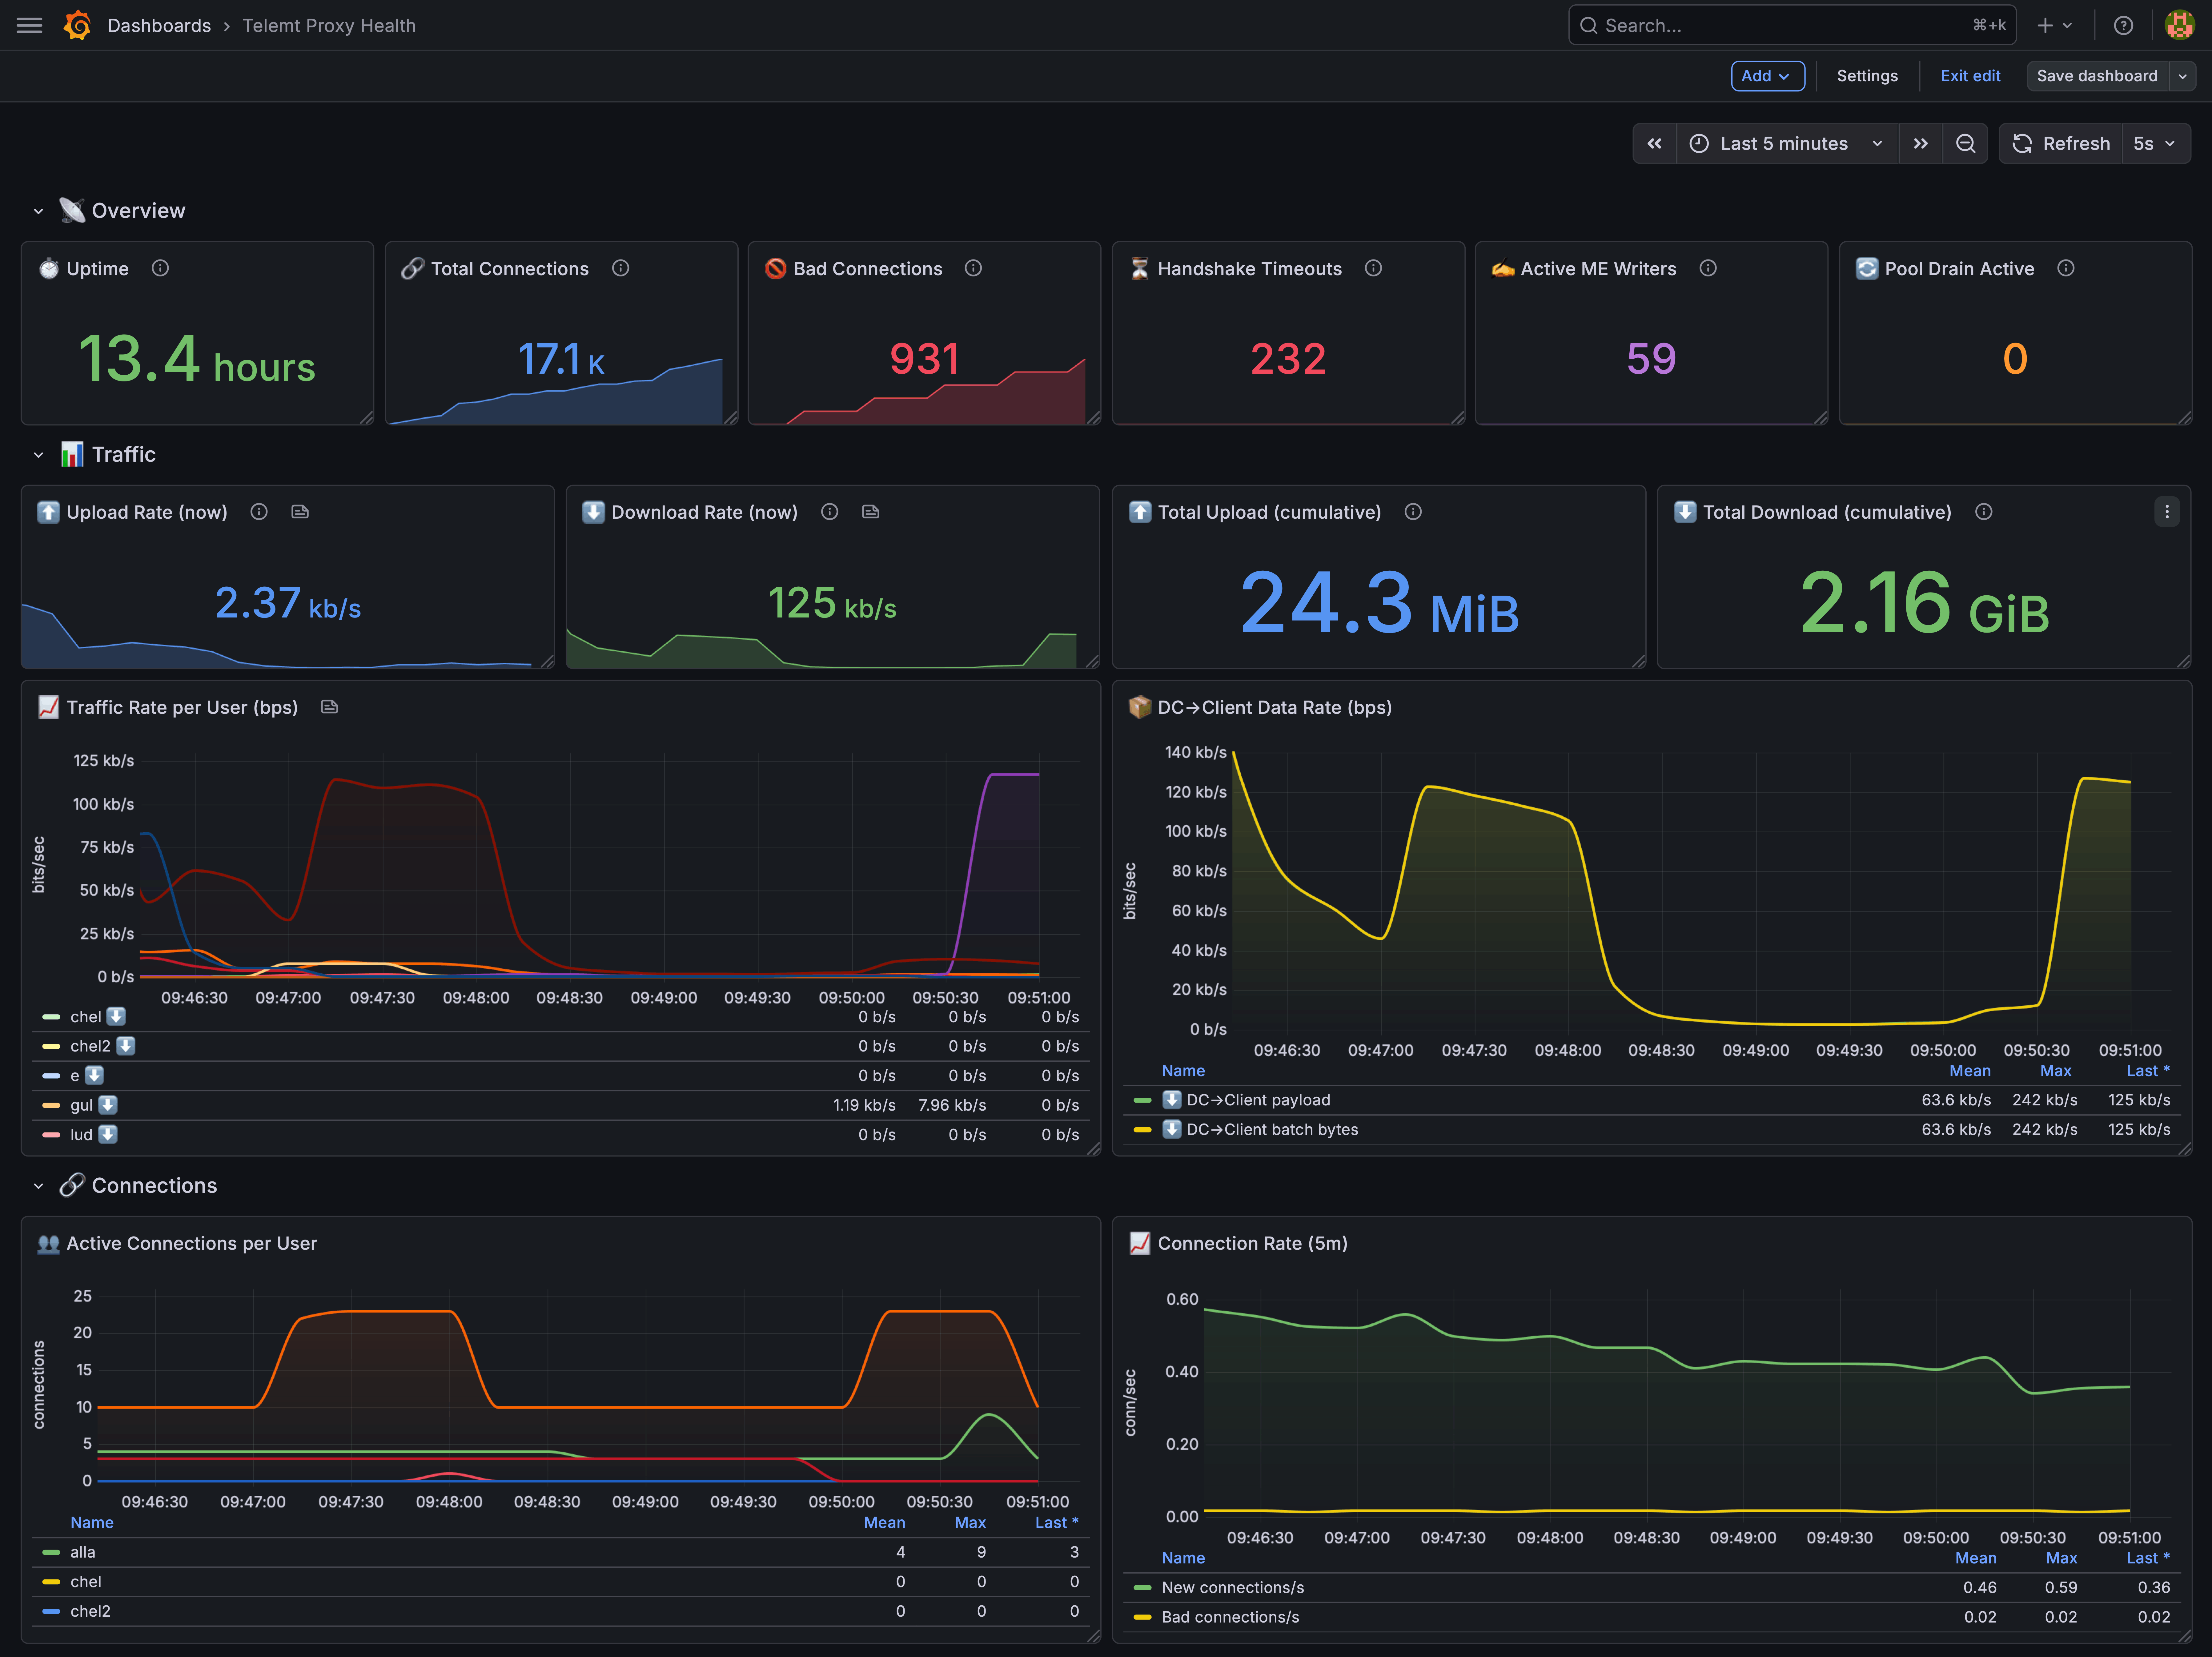
Overall health and availability of the Telemt MTProto proxy service.
📡 Telemt Proxy Health
Grafana dashboard for Telemt MTProto proxy monitoring.
Connections · Traffic · Upstream · Errors & security in one place.
📊 Panels
- Overview: Uptime, connections, handshake timeouts, ME writers
- Traffic: Upload/download rates, per-user bandwidth, DC↔Client throughput
- Connections: Active per user, new/bad connection rate
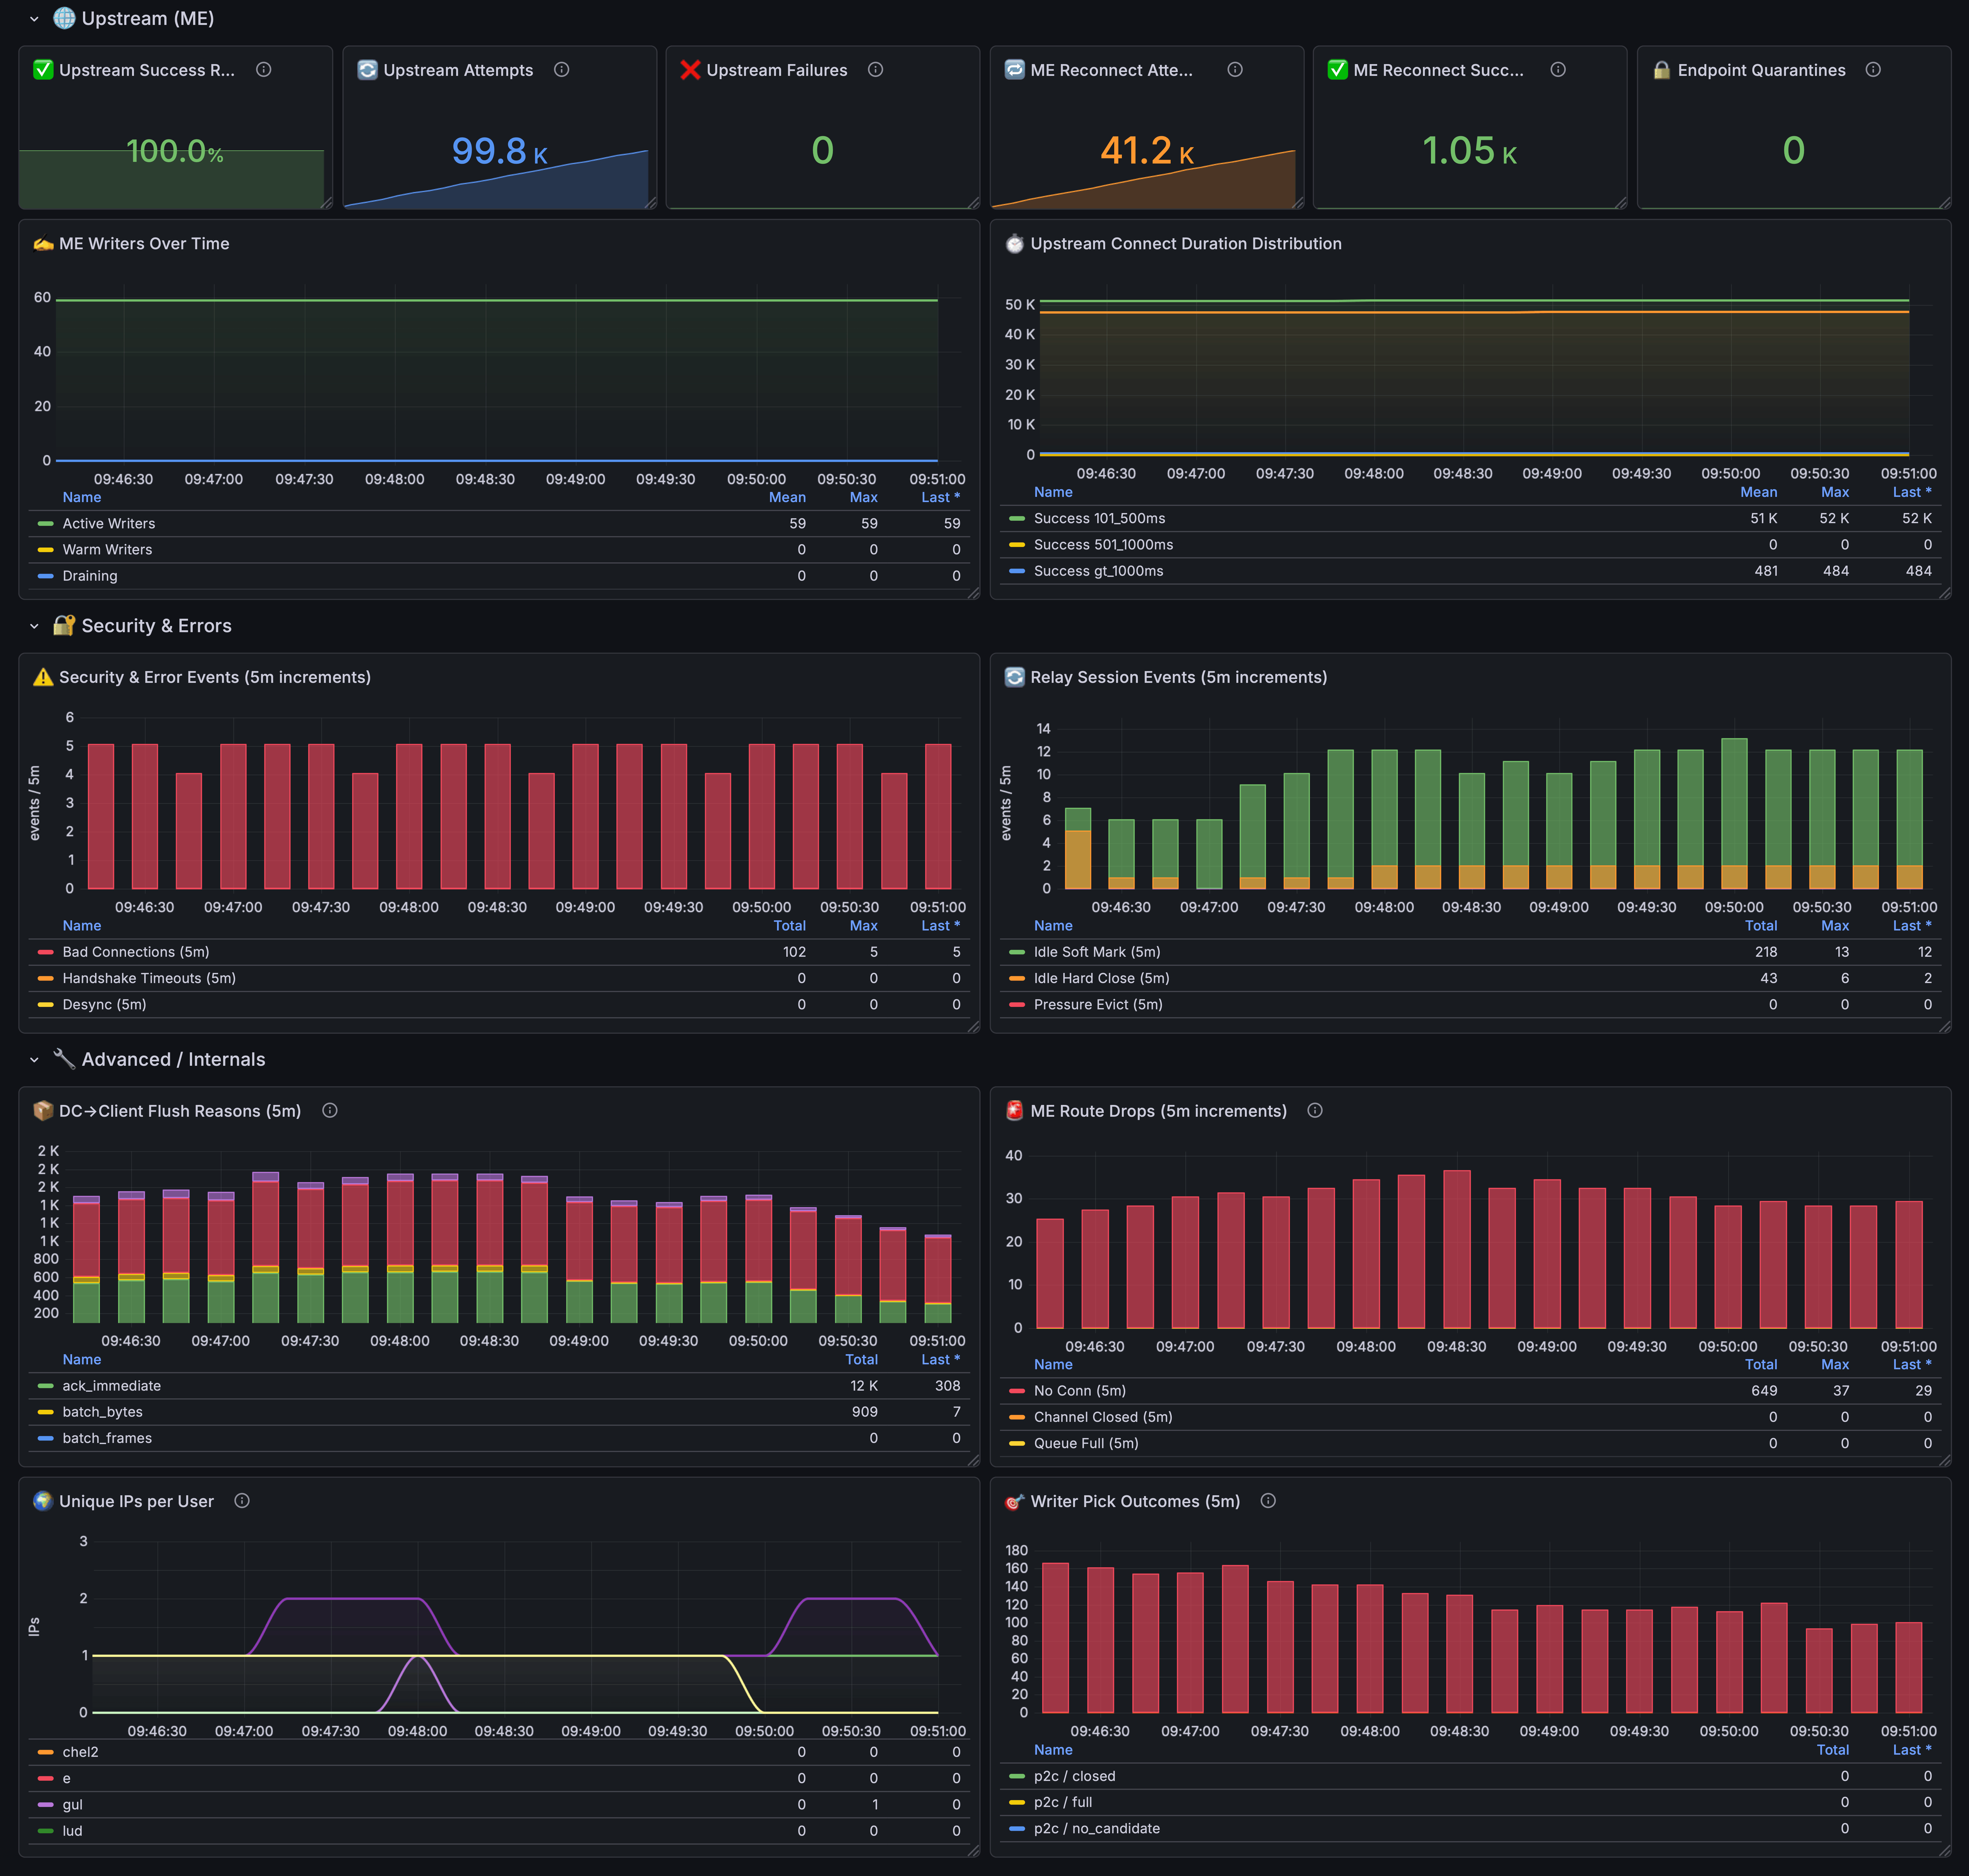
- Upstream: Success rate, reconnects, endpoint quarantines
- Security: Bad conns, desync, CRC mismatch, relay events
- Internals: Flush reasons, route drops, unique IPs, writer picks
Data source config
Collector type:
Collector plugins:
Collector config:
Revisions
Upload an updated version of an exported dashboard.json file from Grafana
| Revision | Description | Created | |
|---|---|---|---|
| Download |