Live Marine Weather for Boaters

Overview
A real-time marine weather dashboard for coastal fishing, boating, and offshore planning. Atmospheric data (conditions, wind, pressure, UV, swell, rain, visibility) comes from Open-Meteo — a free, no-key API. Tide predictions and water temperature come directly from NOAA CO-OPS.
The dashboard is fully location-configurable. Change your coordinates and station IDs at any time from the variable dropdowns at the top.
Prerequisites
This dashboard uses the Infinity plugin to call public REST APIs — no API keys or authentication required.
If you're on Grafana Cloud, Infinity is likely already installed. Check under Connections > Data Sources before proceeding.
To install manually:
- Go to Connections > Data Sources > Add new data source
- Search for Infinity and click Install
- Click Save & Test — no further configuration needed
Import & Configuration
When you import the dashboard, you'll be prompted to set six variables. You can update any of these later via Dashboard Settings > Variables.
| Variable | What to enter |
|---|---|
| Location Name | Display name shown in the title (e.g., West Palm Beach) |
| Latitude | Decimal latitude (e.g., 26.715) |
| Longitude | Decimal longitude (e.g., -80.053) |
| NOAA Tide Station ID | 7-digit station ID for tide predictions |
| NOAA Water Temp Station ID | 7-digit station ID for water temperature readings |
Finding Your Coordinates
Google Maps:
- Go to maps.google.com
- Right-click (or long-press on mobile) on the water near your fishing spot
- Click the coordinates that appear at the top of the menu — they copy to your clipboard
- The first number is latitude, the second is longitude (negative for west)
Example: Right-clicking Indian River Inlet, DE gives 38.611, -75.064
> Pick a point on the water close to where you actually fish, not inland. Open-Meteo uses these coordinates for marine and weather model data, so accuracy matters within a few miles.
Finding Your NOAA Station IDs
You need up to two NOAA station IDs — one for tides and one for water temperature. Often these are the same station, but not always.
Step by step:
- Open the NOAA CO-OPS Station Map
- Zoom to your area and click a station marker near your spot
- The 7-digit number in the popup header is the station ID (e.g.,
8558690)
Tide Station: Pick the station closest to your inlet or fishing area. Tide timing shifts significantly even across short distances, so closer is better.
Water Temp Station: On the station detail page, check if Water Temperature is listed under Available Data. If it is, use the same station ID for both. If not, find the nearest station that does measure water temp — it may be 10-20 miles away, which is fine for temperature.
> Quick lookup: tidesandcurrents.noaa.gov/stations.html lets you search by state and filter by data type.
How It Works
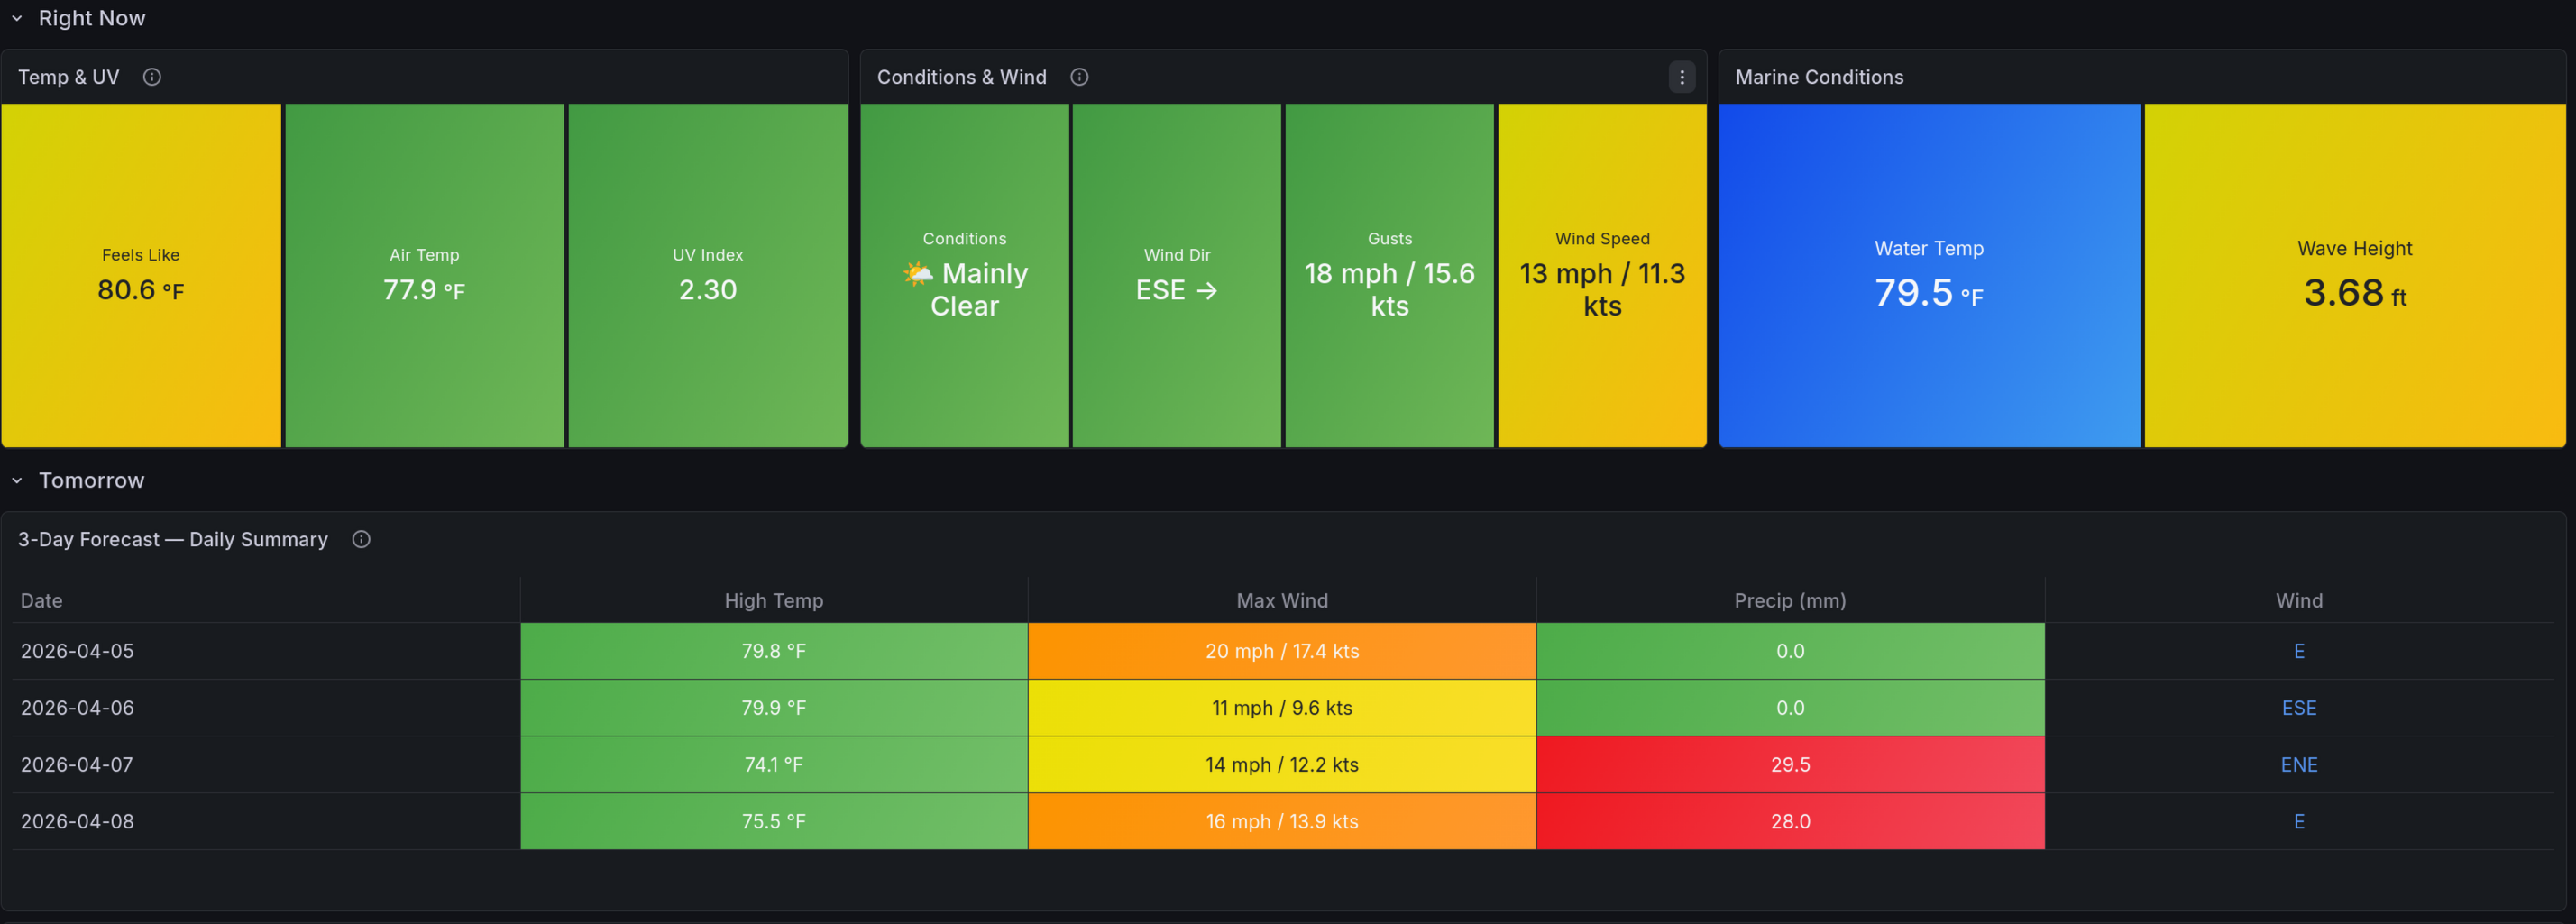
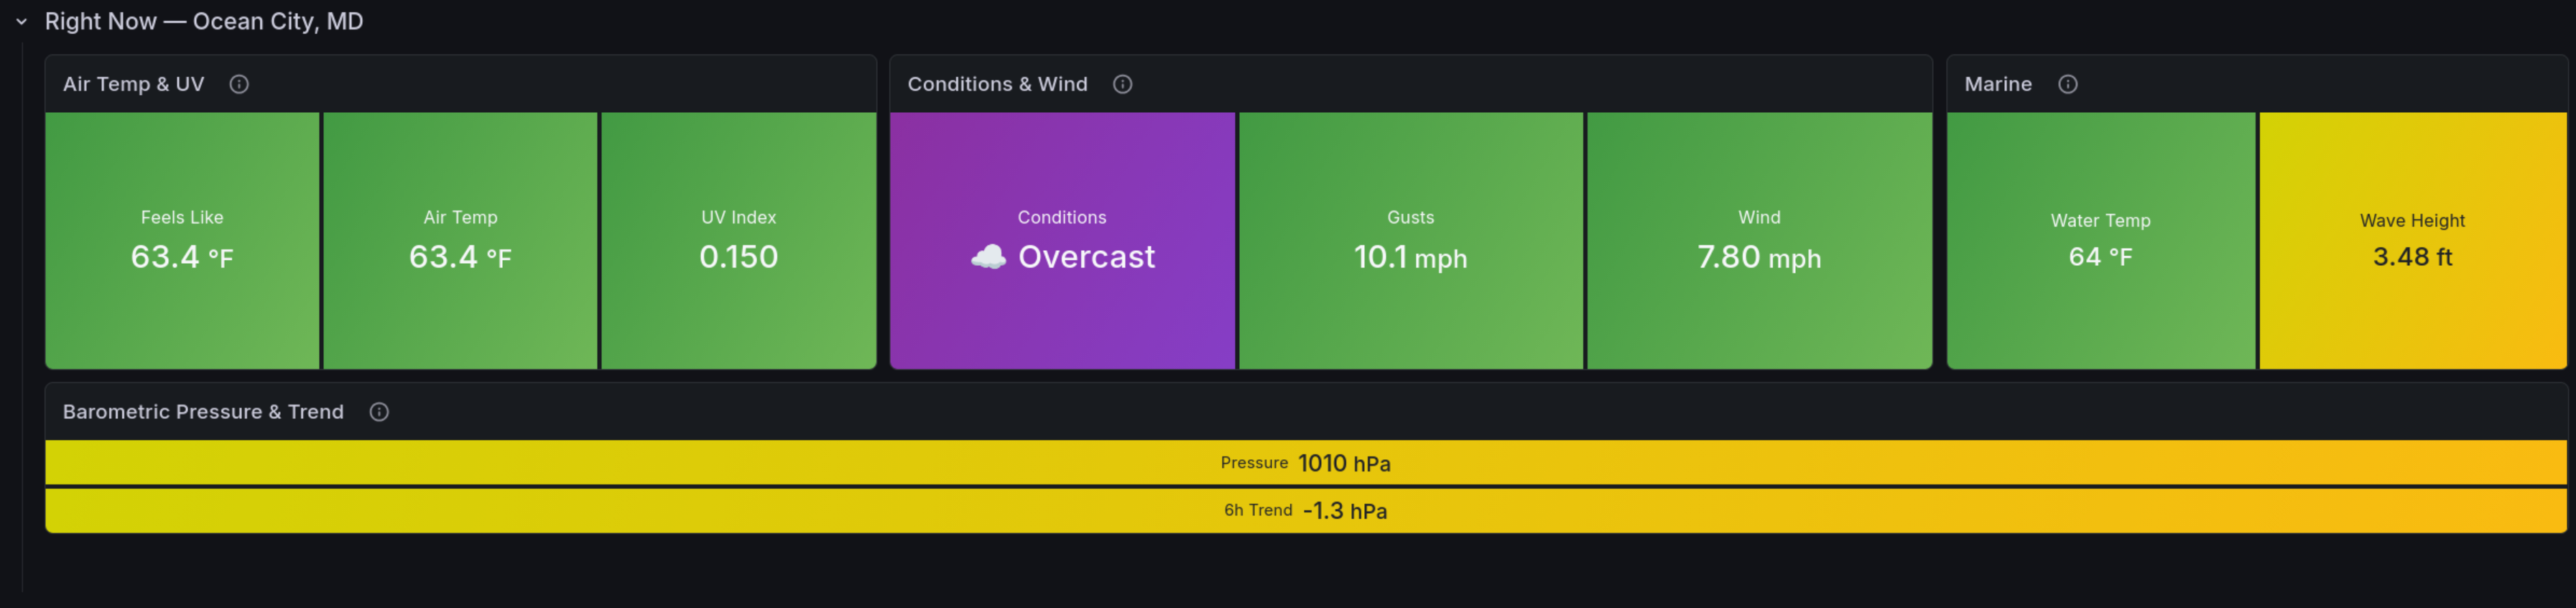
Right Now — Current air temp, feels-like, UV, wind speed/direction, conditions, water temp, and wave height. All pulled from the latest observation or model snapshot.
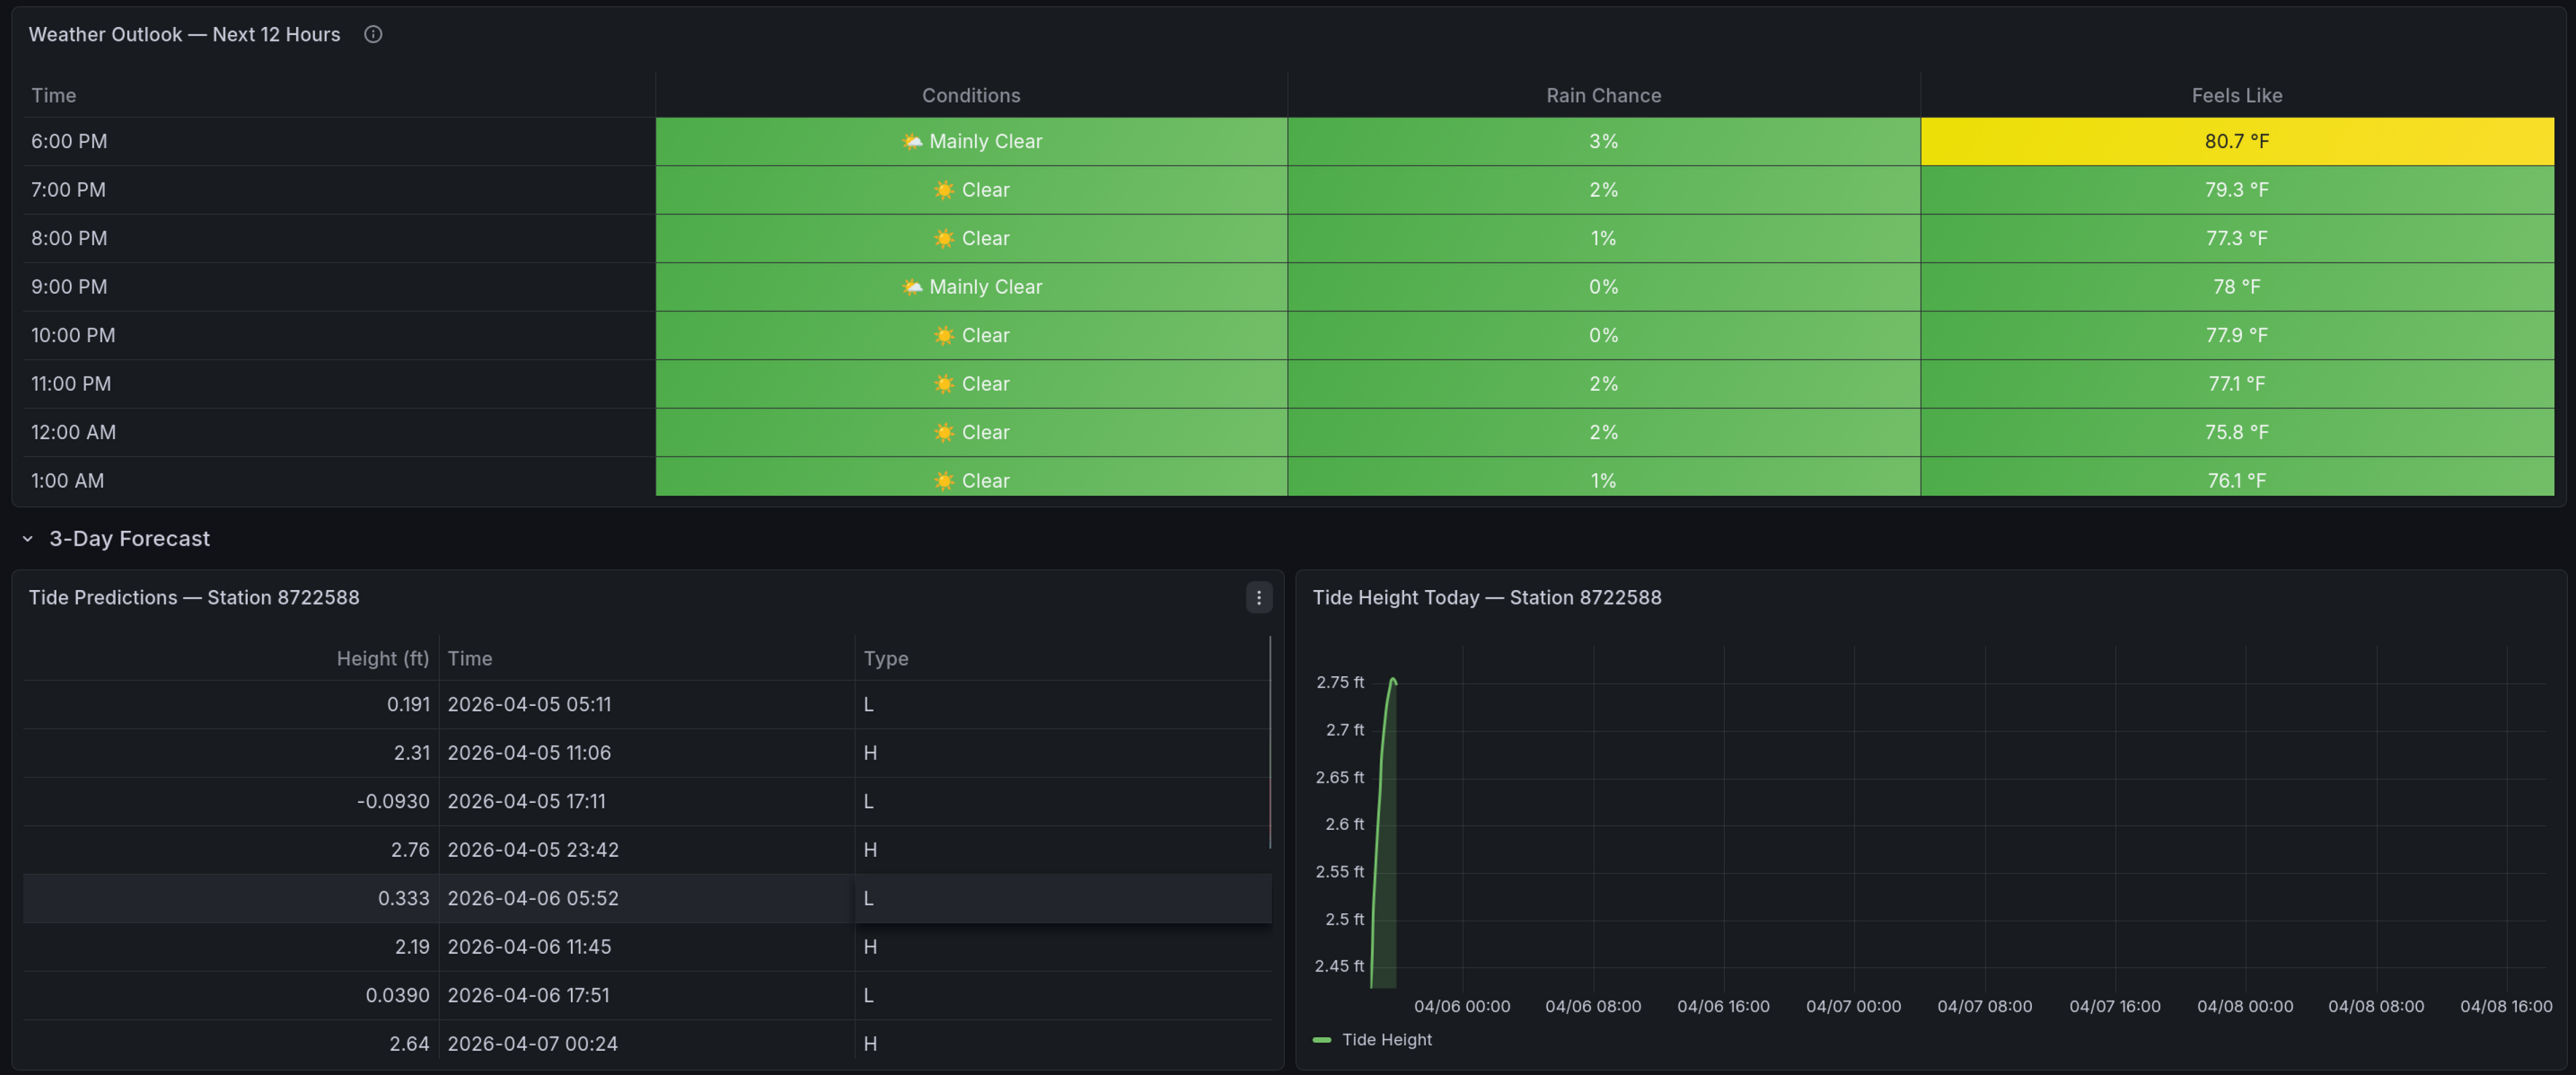
Tomorrow — Daily summary table and 12-hour weather outlook so you can plan ahead.
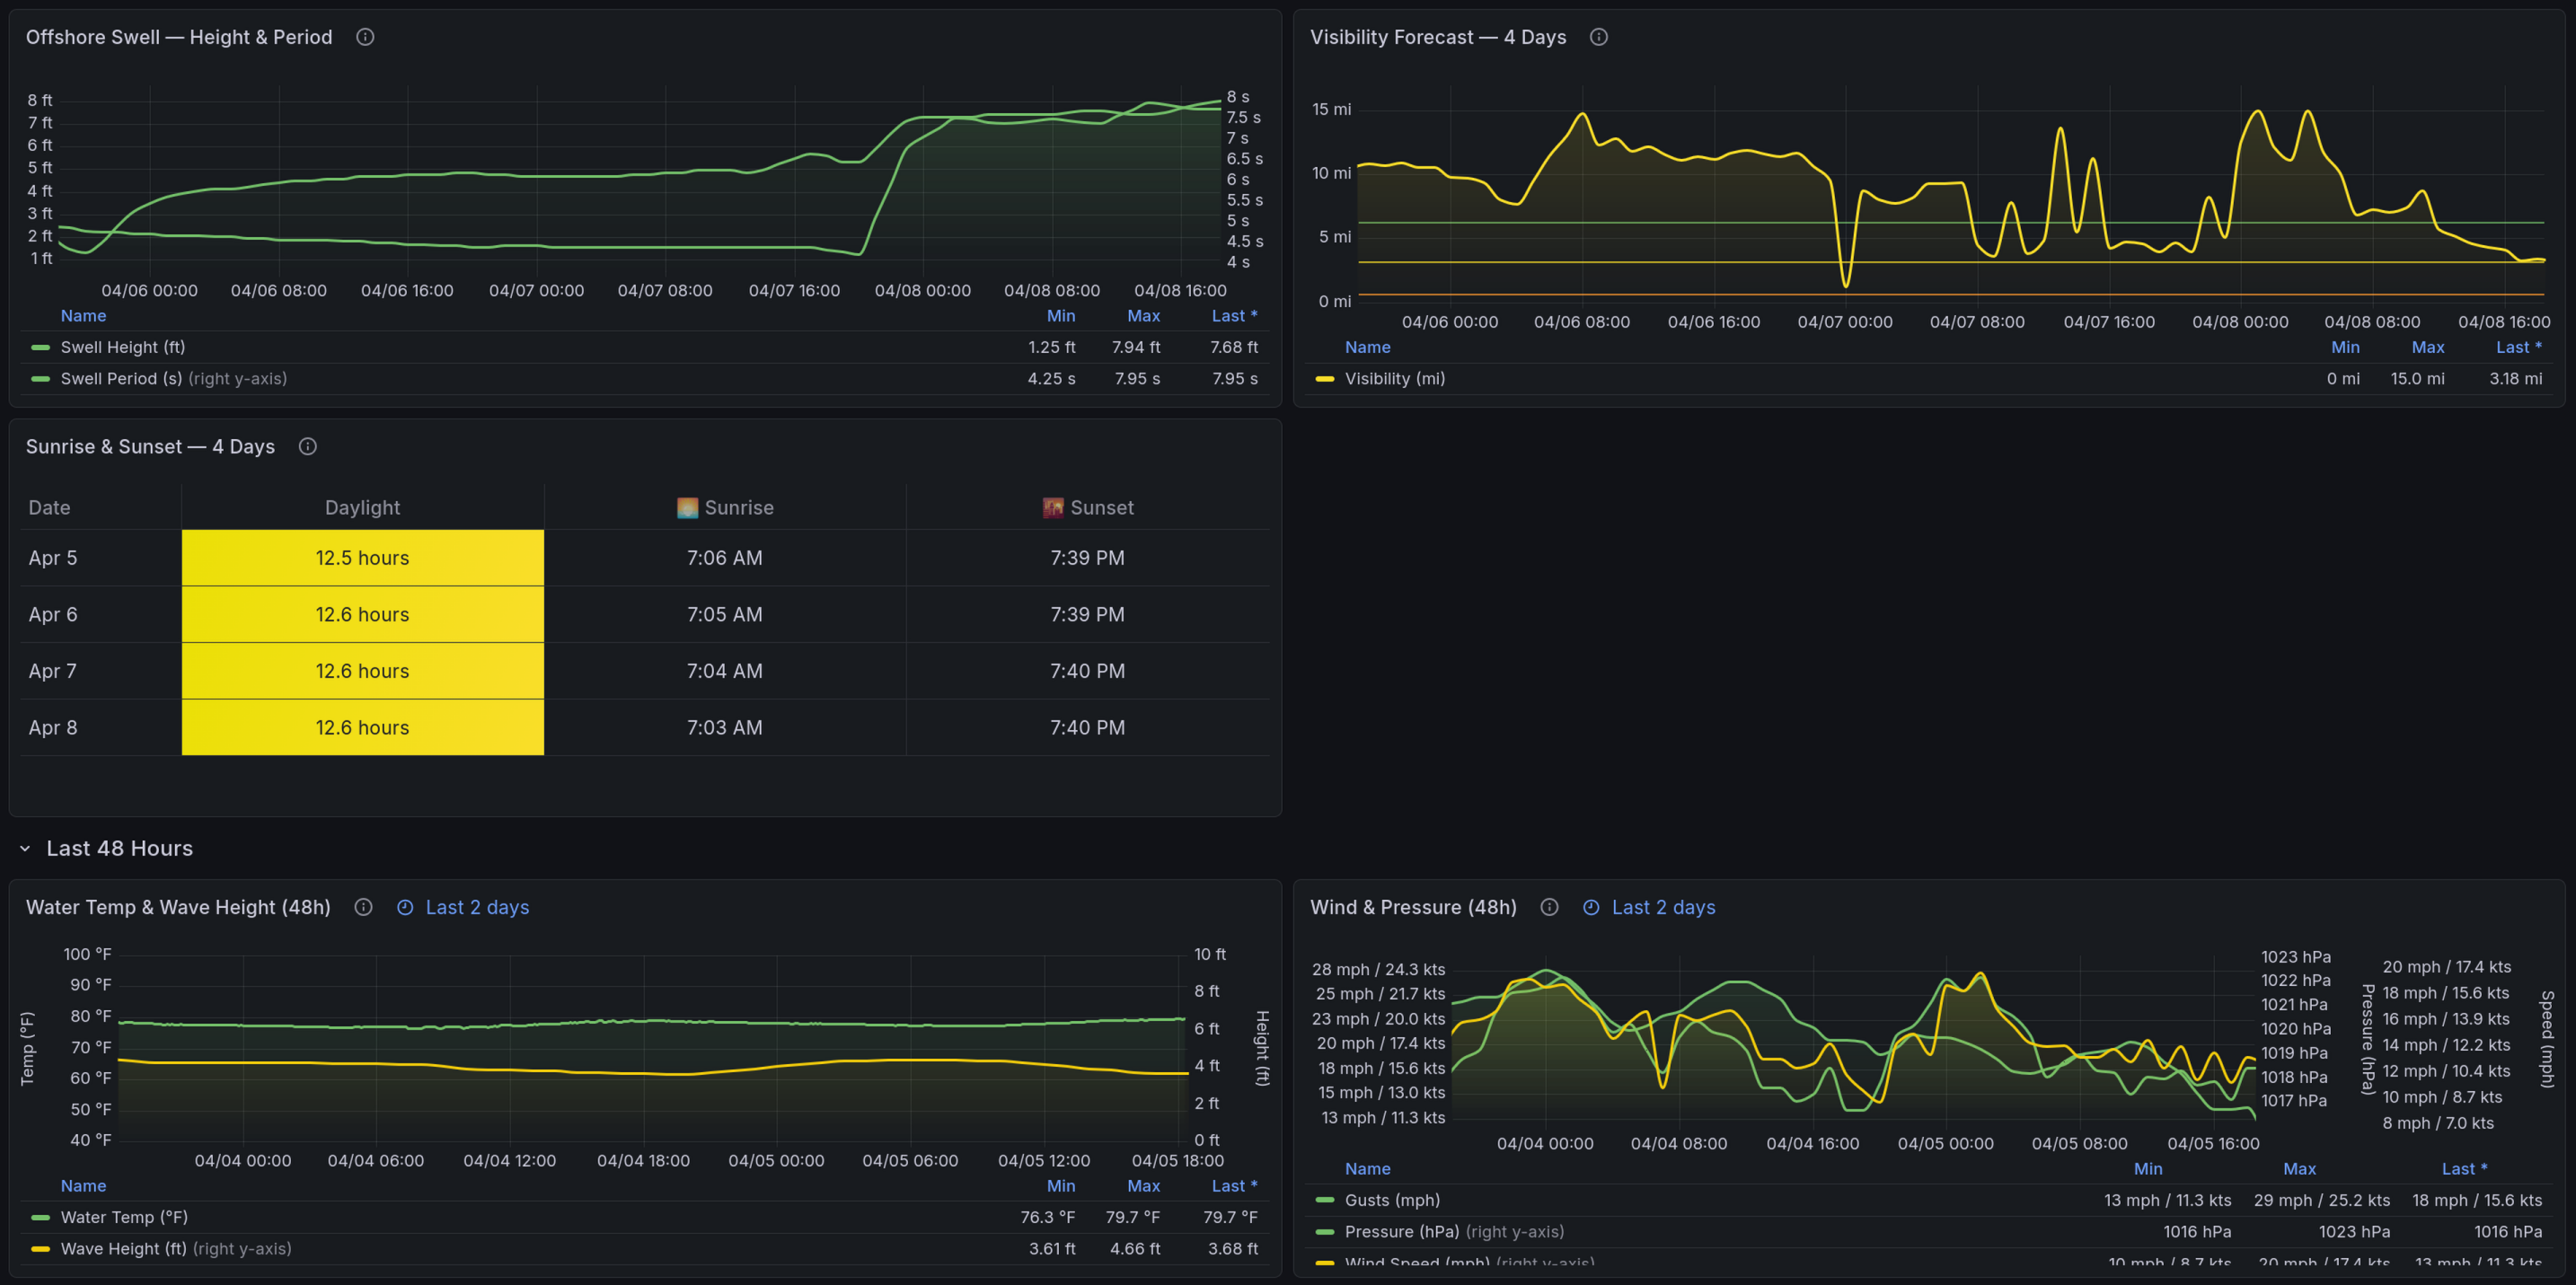
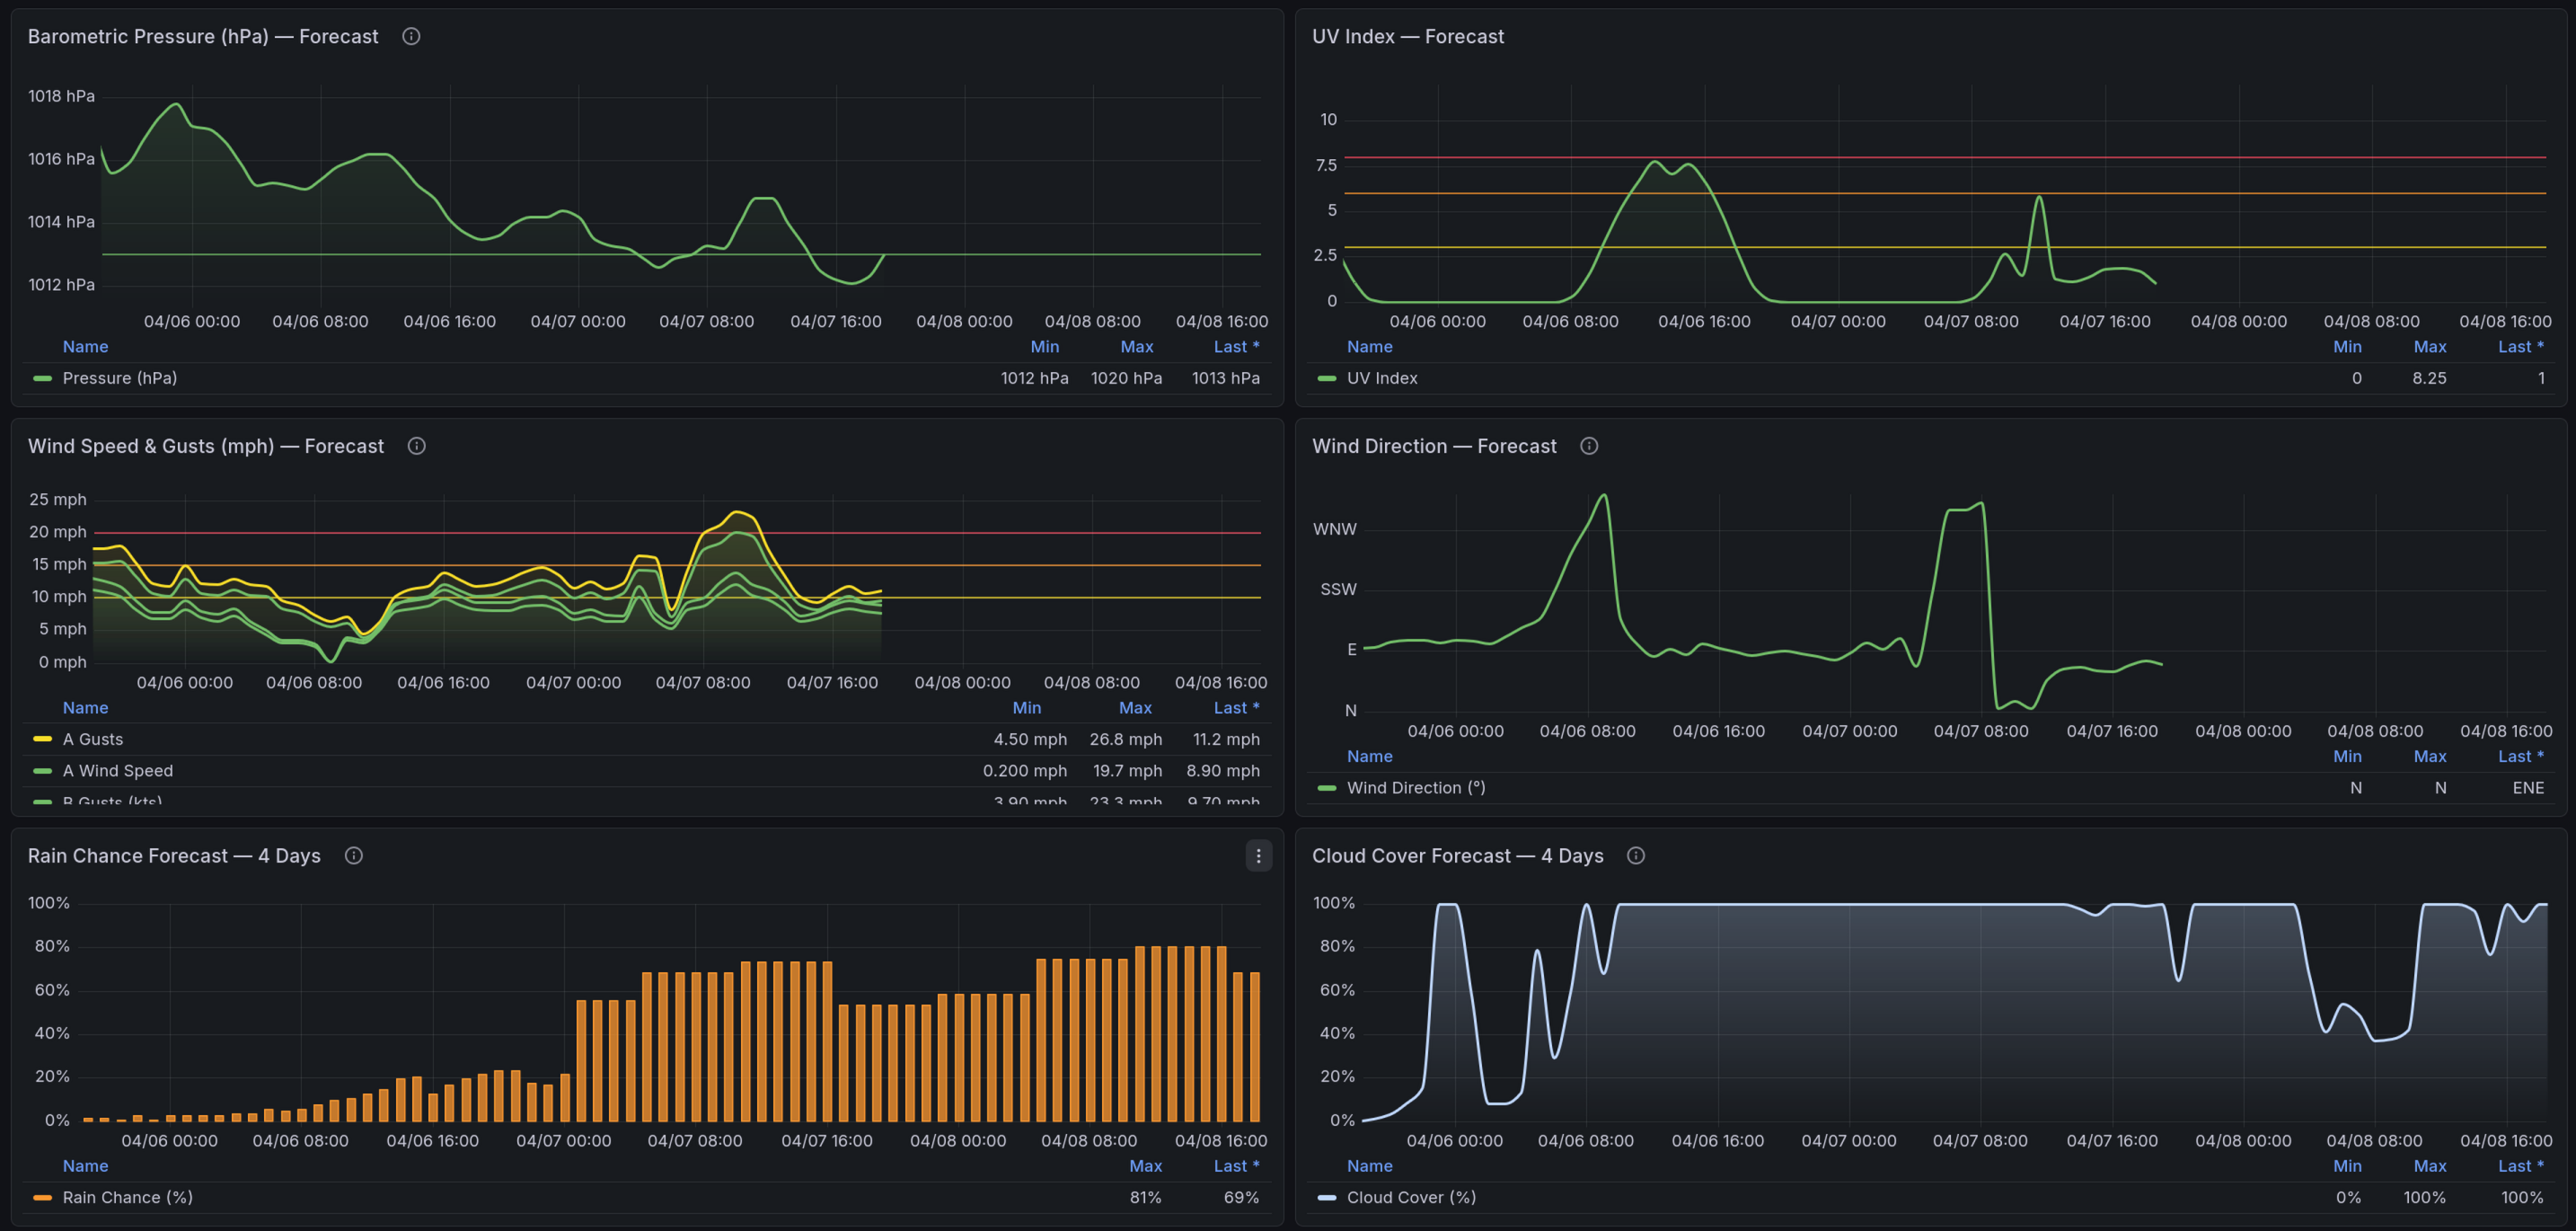
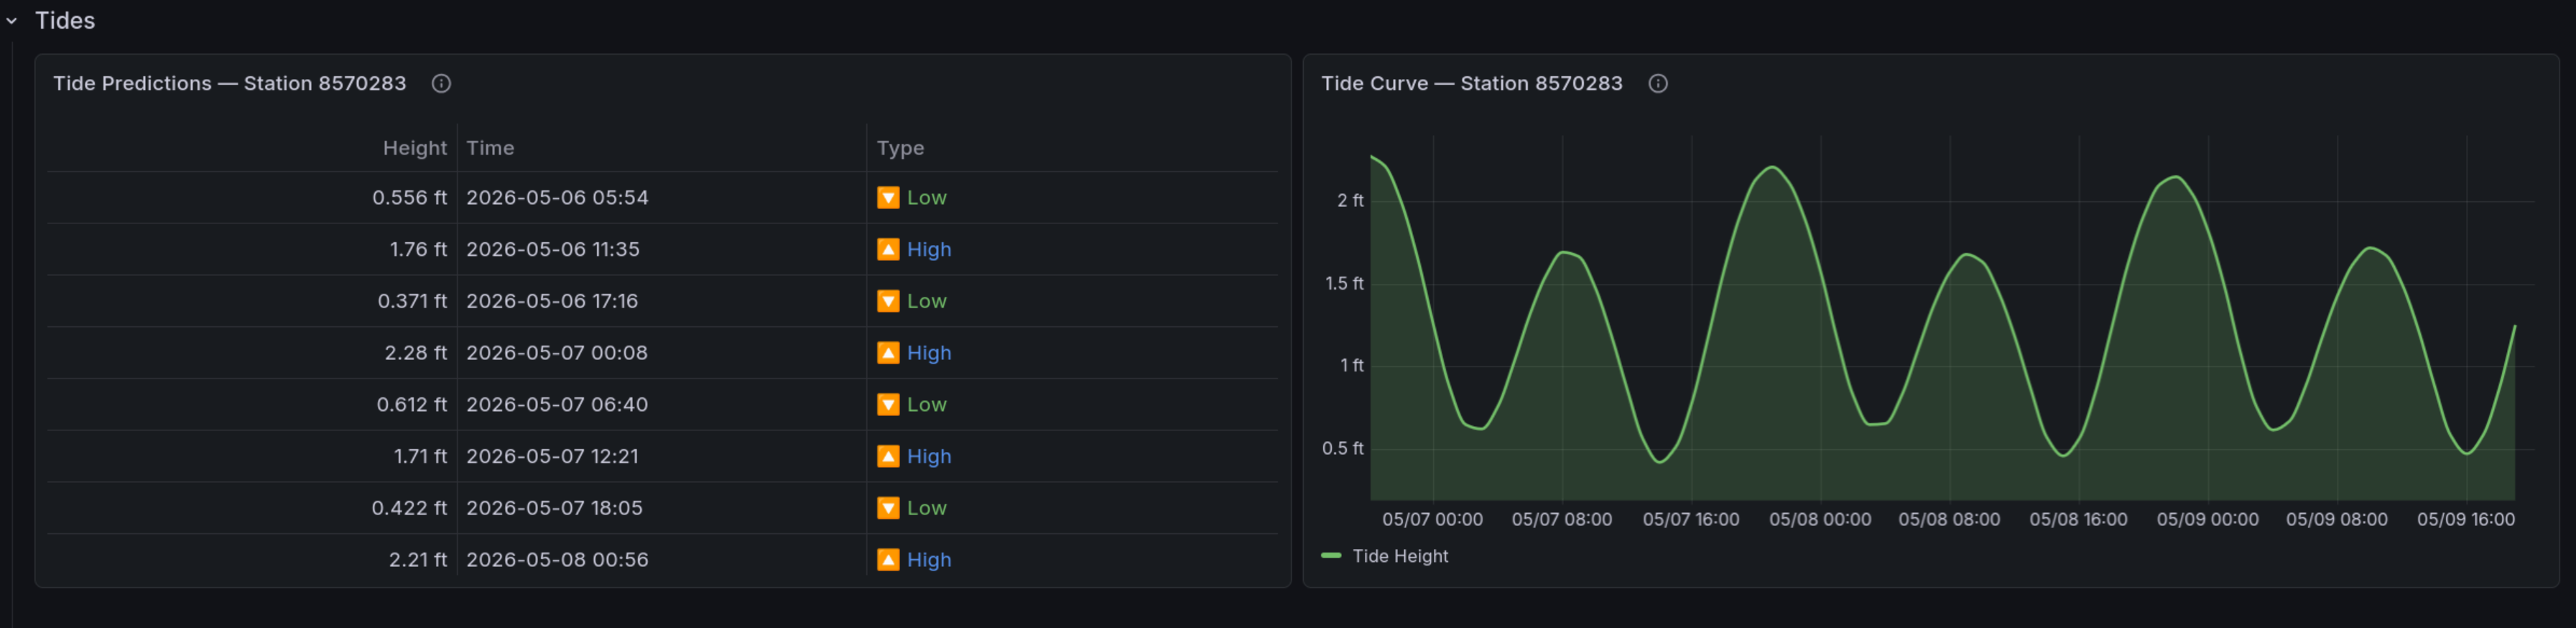
3-Day Forecast — Hourly timeseries charts for tides, pressure, UV, wind, rain chance, cloud cover, offshore swell, and visibility. Tides come from NOAA predictions; everything else is Open-Meteo forecast data.
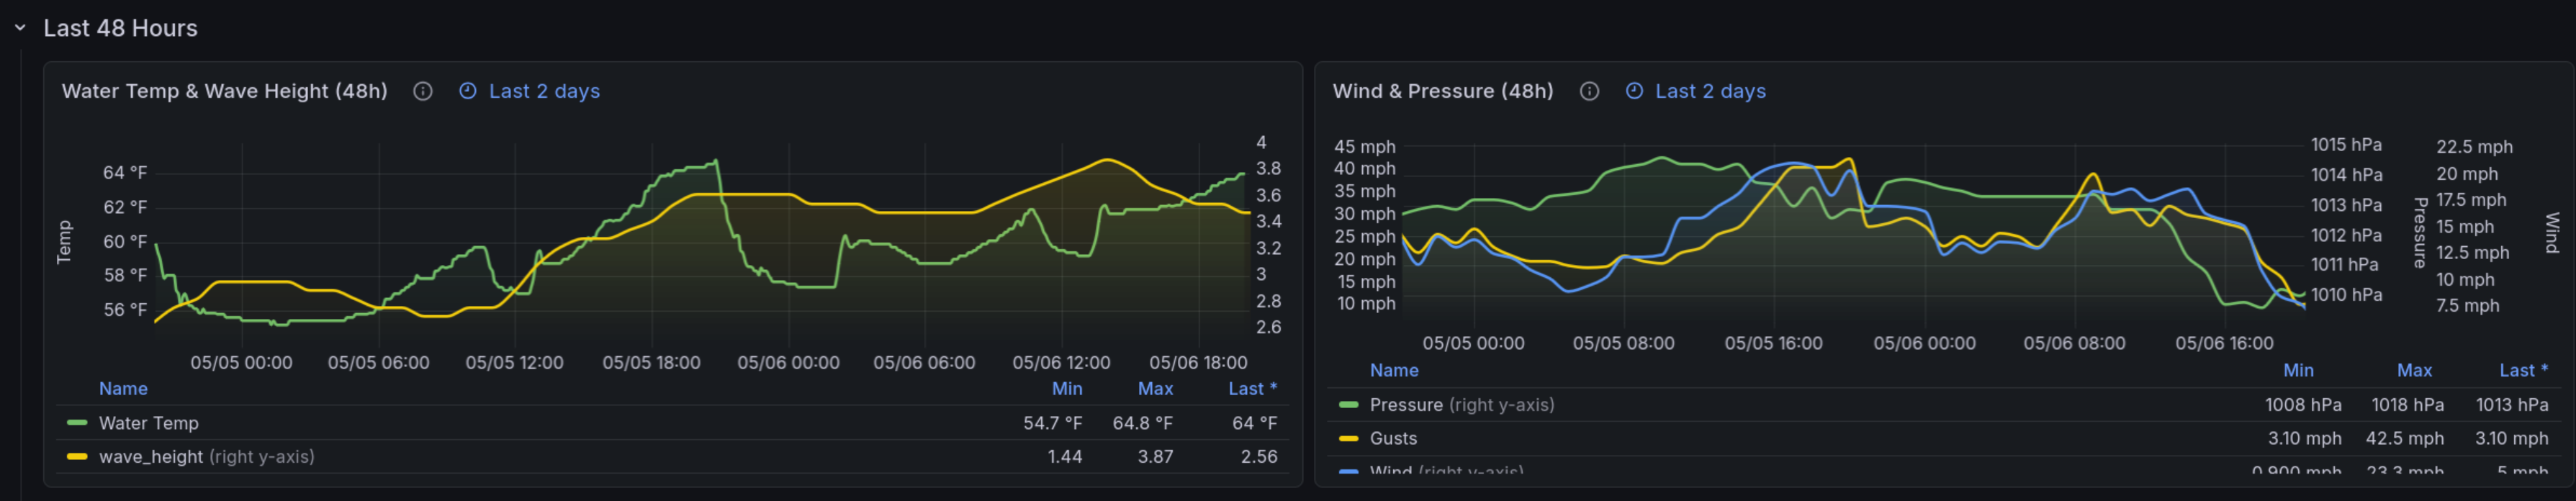
Last 48 Hours — Historical water temperature, wave height, wind, and pressure to see how conditions have been trending.
Reading the Colors — Reference guide explaining what the color thresholds mean for each metric (temperature, wind, pressure, wave height) in a fishing context.
Data Sources
| Source | What it provides | Update frequency |
|---|---|---|
| Open-Meteo Forecast API | Wind, pressure, UV, rain, cloud cover, visibility, air temp | Hourly model updates |
| Open-Meteo Marine API | Wave height, swell period | Hourly model updates |
| NOAA CO-OPS API | Tide predictions, water temperature | 6-min intervals (real-time) |
Wind Speed
Wind values are displayed in mph with the equivalent in knots shown alongside (e.g., 13 mph / 11.3 kts). Color thresholds are calibrated for small-boat fishing:
| Color | Speed | Conditions |
|---|---|---|
| Green | < 10 mph / 9 kts | Calm |
| Yellow | 10-15 mph / 9-13 kts | Comfortable |
| Orange | 15-20 mph / 13-17 kts | Choppy |
| Red | 20+ mph / 17+ kts | Rough |
Time Range
The dashboard defaults to Now to Now + 3 days to show current conditions alongside the short-term forecast. You can extend the window using the time picker in the top-right corner — forecast panels adjust automatically.
Troubleshooting
Panels show "No data" — Verify your latitude/longitude and station IDs are correct. Test the station ID by visiting https://tidesandcurrents.noaa.gov/stationhome.html?id=YOUR_ID.
Water temp is blank — Your station may not measure water temperature. Find a nearby station that does using the station map filtered by data type.
Tide predictions seem off — Make sure you're using a station close to your actual location. Tide timing can differ by 30+ minutes between stations just a few miles apart.
Data source config
Collector config:
Upload an updated version of an exported dashboard.json file from Grafana
| Revision | Description | Created | |
|---|---|---|---|
| Download |