Kafka Connect
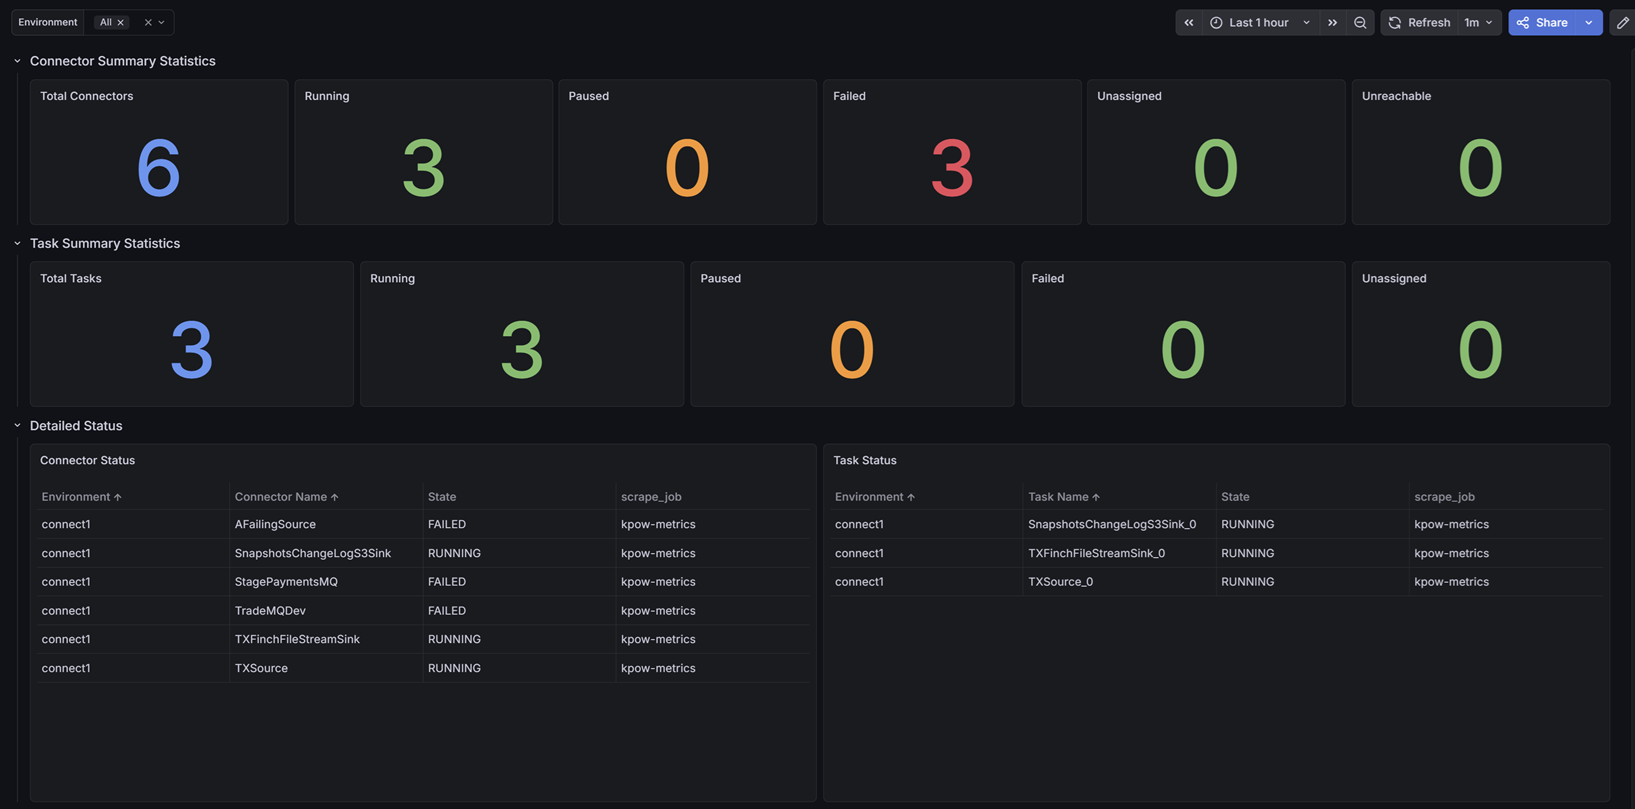
Instant visual feedback for Kafka Connect integration health, tracking individual Connector and Task states using Kpow's telemetry.
Factor House is a leader in real-time data tooling, empowering engineers with innovative solutions for Apache Kafka® and Apache Flink®.
Our flagship product, Kpow for Apache Kafka, is the market-leading enterprise solution for Kafka management and monitoring.
Kafka Connect Operations
Data pipeline reliability depends heavily on integration health. This dashboard targets Kafka Connect deployments, replacing tedious API queries with instant visual feedback.
It tracks aggregate summary statistics alongside individual Connector and Task states. By mapping state labels directly to distinct visual alerts (RUNNING, PAUSED, FAILED, UNASSIGNED, UNREACHABLE), teams can immediately detect stalled integrations and isolate whether the failure exists at the connector or task level.
Getting Started
This dashboard relies on Kpow's Prometheus integration. It does not require JMX sidecars or complex Exporters.
To use this dashboard:
- Ensure your Prometheus instance (or Grafana Cloud Metrics Endpoint) is configured to scrape your Kpow telemetry endpoints (e.g.,
/metrics/v1). - Import this dashboard template.
- Select your Prometheus data source from the dropdown when prompted.
For full setup instructions and to explore our other Kafka dashboards, visit the Factor Telemetry GitHub Repository.
Data source config
Collector config:
Upload an updated version of an exported dashboard.json file from Grafana
| Revision | Description | Created | |
|---|---|---|---|
| Download |
Kafka
Easily monitor your Kafka deployment with Grafana Cloud's out-of-the-box monitoring solution.
Learn more