Kafka Consumer Group
Micro-level SLA monitoring for Apache Kafka consumer groups, tracking exact lag and real-time consumption rates using Kpow's telemetry.
Factor House is a leader in real-time data tooling, empowering engineers with innovative solutions for Apache Kafka® and Apache Flink®.
Our flagship product, Kpow for Apache Kafka, is the market-leading enterprise solution for Kafka management and monitoring.
Kafka Consumer Group Deep Dive
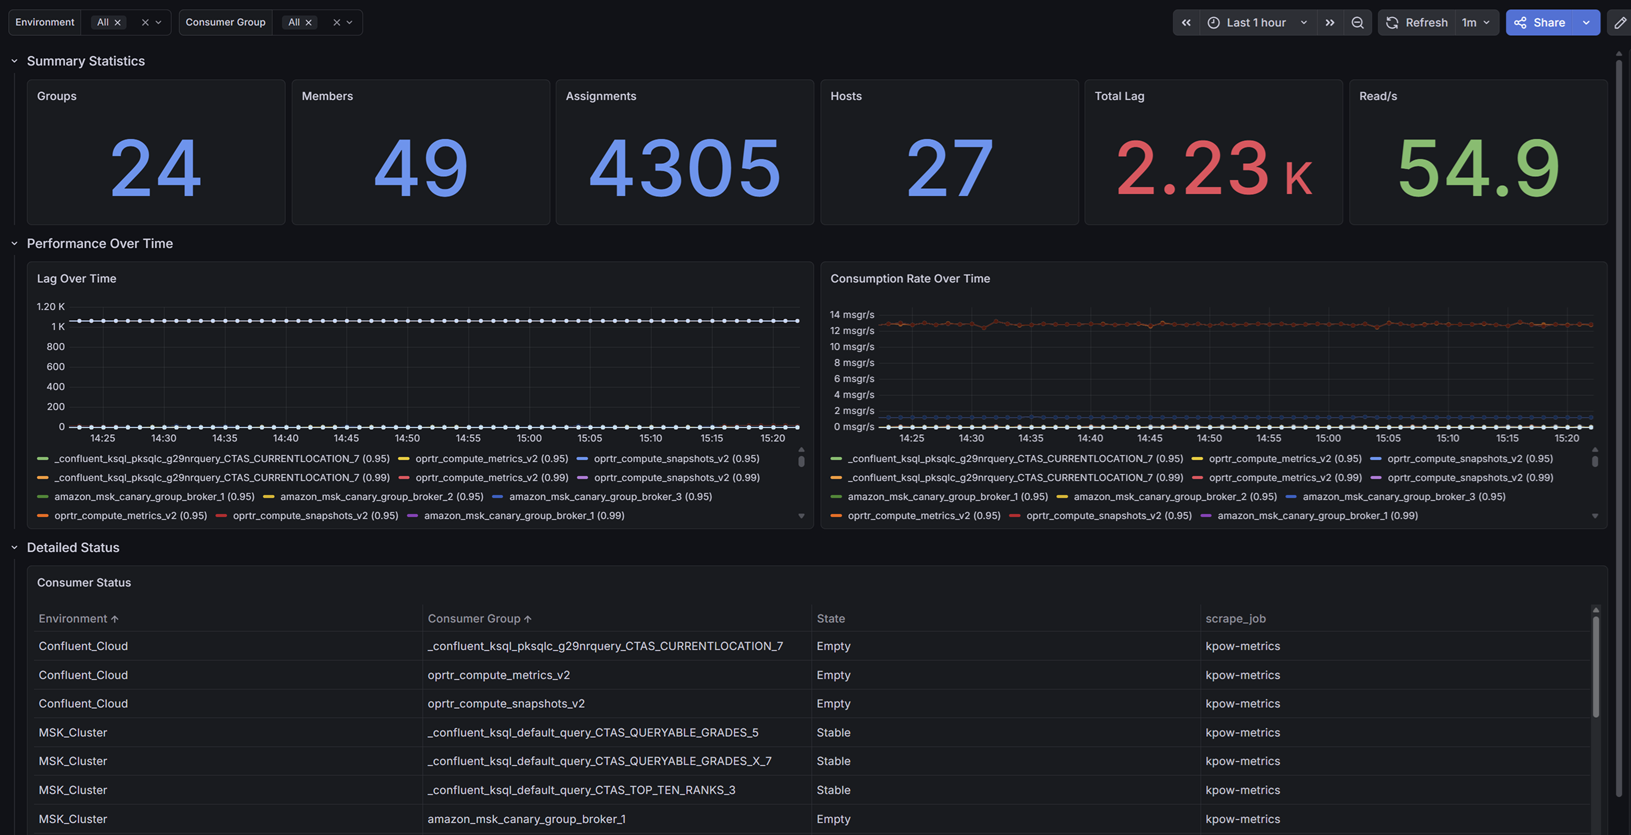
Designed for Application Teams, this dashboard focuses on micro-level Service Level Agreement (SLA) monitoring.
Instead of generic host metrics, it visualizes the exact state of your data consumption. Key metrics include precise total lag (group_offset_lag) and real-time consumption rates (group_offset_delta). It details total assigned members and hosts, and features a clear status table tracking the exact state of every consumer group to help engineers spot stalling applications before downstream users are impacted.
Getting Started
This dashboard relies on Kpow's Prometheus integration. It does not require JMX sidecars or complex Exporters.
To use this dashboard:
- Ensure your Prometheus instance (or Grafana Cloud Metrics Endpoint) is configured to scrape your Kpow telemetry endpoints (e.g.,
/metrics/v1). - Import this dashboard template.
- Select your Prometheus data source from the dropdown when prompted.
For full setup instructions and to explore our other Kafka dashboards, visit the Factor Telemetry GitHub Repository.
Data source config
Collector config:
Upload an updated version of an exported dashboard.json file from Grafana
| Revision | Description | Created | |
|---|---|---|---|
| Download |
Kafka
Easily monitor your Kafka deployment with Grafana Cloud's out-of-the-box monitoring solution.
Learn more