Kafka Topic
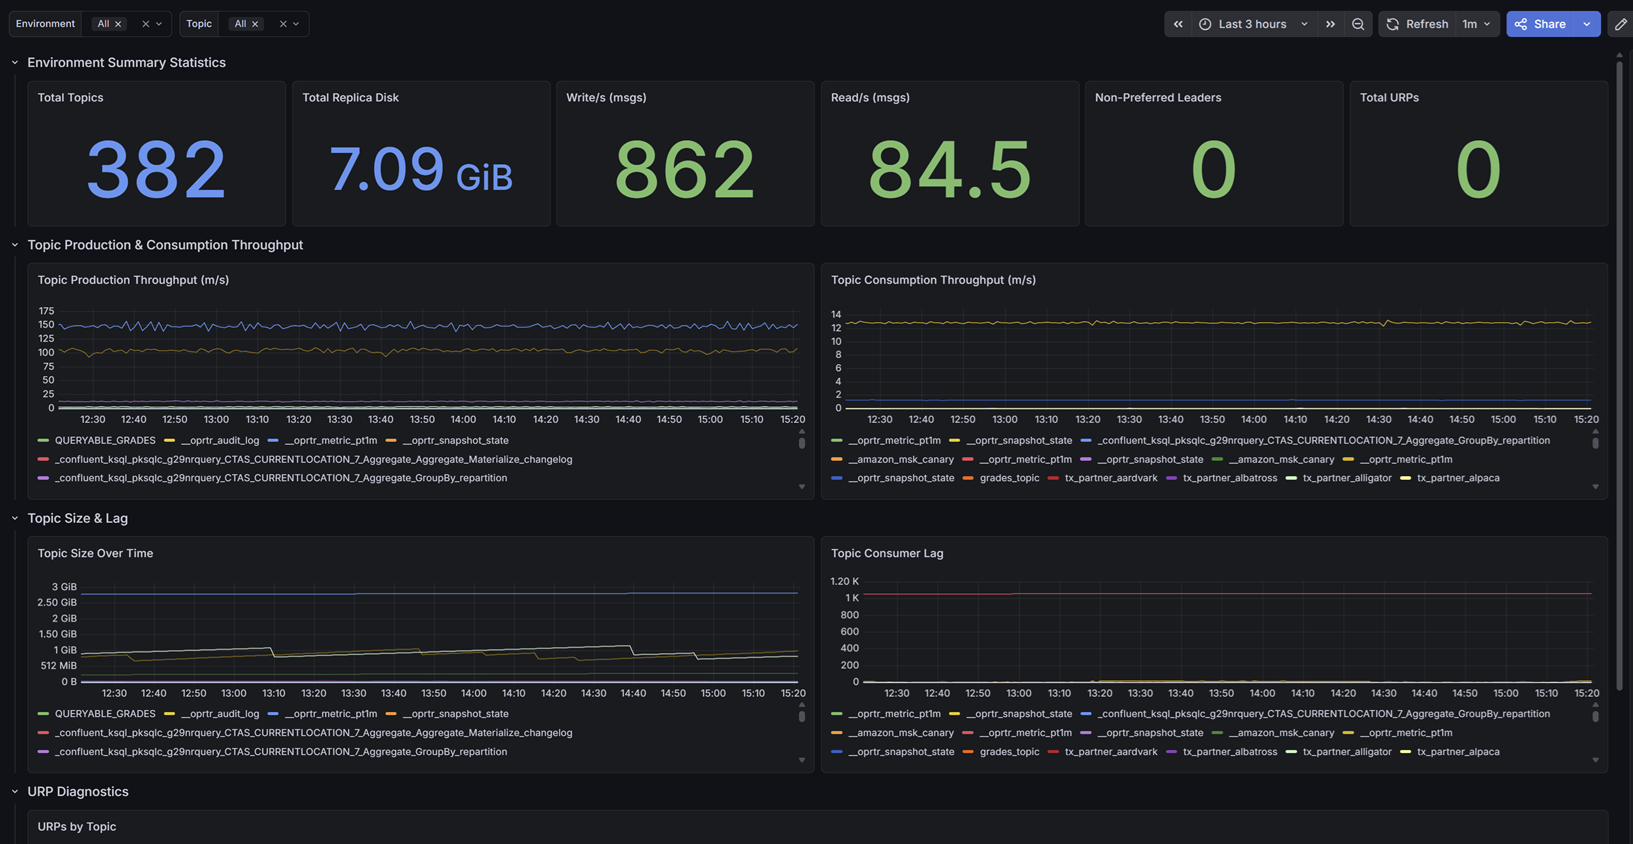
Granular visibility into Apache Kafka topics, tracking throughput, consumer lag, and URPs using Kpow's high-fidelity telemetry.
Factor House is a leader in real-time data tooling, empowering engineers with innovative solutions for Apache Kafka® and Apache Flink®.
Our flagship product, Kpow for Apache Kafka, is the market-leading enterprise solution for Kafka management and monitoring.
Kafka Topic Diagnostics
Designed for data engineers and platform administrators, this dashboard provides granular visibility into the data layer.
It tracks aggregate metrics like total topics, total replica disk usage, cluster-wide read/write throughput, and non-preferred leaders. Most importantly, it visualizes per-topic production and consumption rates over time, topic size growth, and isolates the exact topics experiencing consumer lag or Under Replicated Partitions (URPs) through detailed diagnostic tables.
Getting Started
This dashboard relies on Kpow's Prometheus integration. It does not require JMX sidecars or complex Exporters.
To use this dashboard:
- Ensure your Prometheus instance (or Grafana Cloud Metrics Endpoint) is configured to scrape your Kpow telemetry endpoints (e.g.,
/metrics/v1). - Import this dashboard template.
- Select your Prometheus data source from the dropdown when prompted.
For full setup instructions and to explore our other Kafka dashboards, visit the Factor Telemetry GitHub Repository.
Data source config
Collector config:
Upload an updated version of an exported dashboard.json file from Grafana
| Revision | Description | Created | |
|---|---|---|---|
| Download |
Kafka
Easily monitor your Kafka deployment with Grafana Cloud's out-of-the-box monitoring solution.
Learn more