Kafka Environment Health
A high-level macro view of Apache Kafka cluster stability, capacity, and operational health using Kpow's high-fidelity telemetry.
Factor House is a leader in real-time data tooling, empowering engineers with innovative solutions for Apache Kafka® and Apache Flink®.
Our flagship product, Kpow for Apache Kafka, is the market-leading enterprise solution for Kafka management and monitoring.
Kafka Environment Health
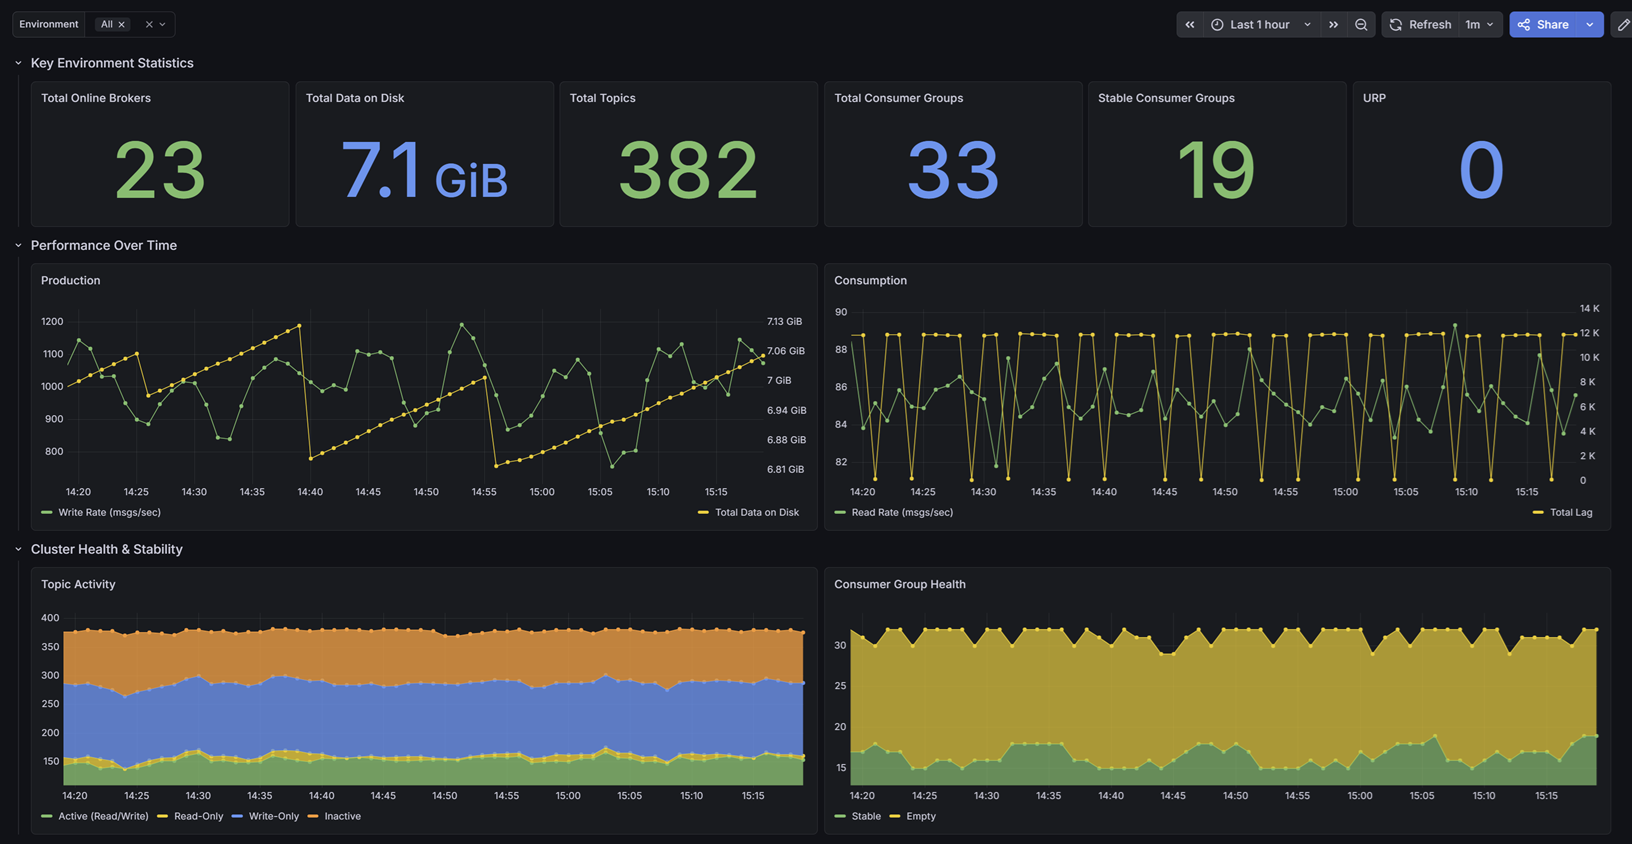
Designed for Platform Teams, this dashboard provides a high-level macro view of overall cluster stability and capacity.
Rather than relying on raw byte counts, it surfaces derived operational health indicators. It tracks total online brokers, overall data on disk, total topics, and total consumer groups. It also visualizes cluster-wide production and consumption rates, and provides a detailed breakdown of topic activity and consumer group health (Stable, Rebalancing, Empty) to give you an instant read on the environment's status.
Getting Started
This dashboard relies on Kpow's Prometheus integration. It does not require JMX sidecars or complex Exporters.
To use this dashboard:
- Ensure your Prometheus instance (or Grafana Cloud Metrics Endpoint) is configured to scrape your Kpow telemetry endpoints (e.g.,
/metrics/v1). - Import this dashboard template.
- Select your Prometheus data source from the dropdown when prompted.
For full setup instructions and to explore our other Kafka dashboards, visit the Factor Telemetry GitHub Repository.
Data source config
Collector config:
Upload an updated version of an exported dashboard.json file from Grafana
| Revision | Description | Created | |
|---|---|---|---|
| Download |
Kafka
Easily monitor your Kafka deployment with Grafana Cloud's out-of-the-box monitoring solution.
Learn more