TrueNAS - Operations Center
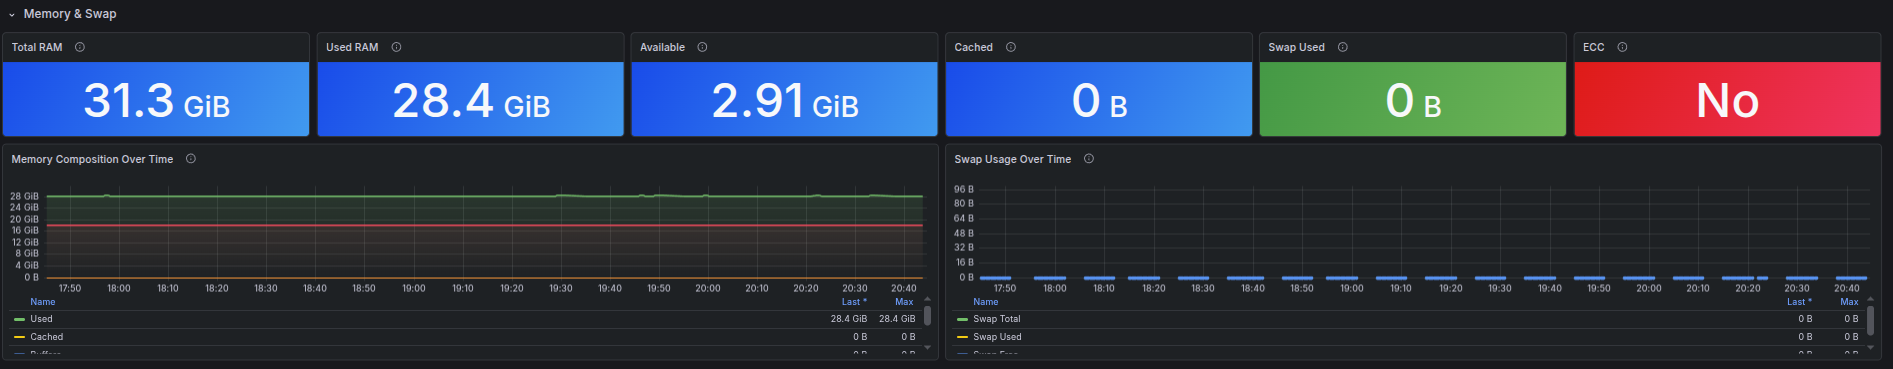
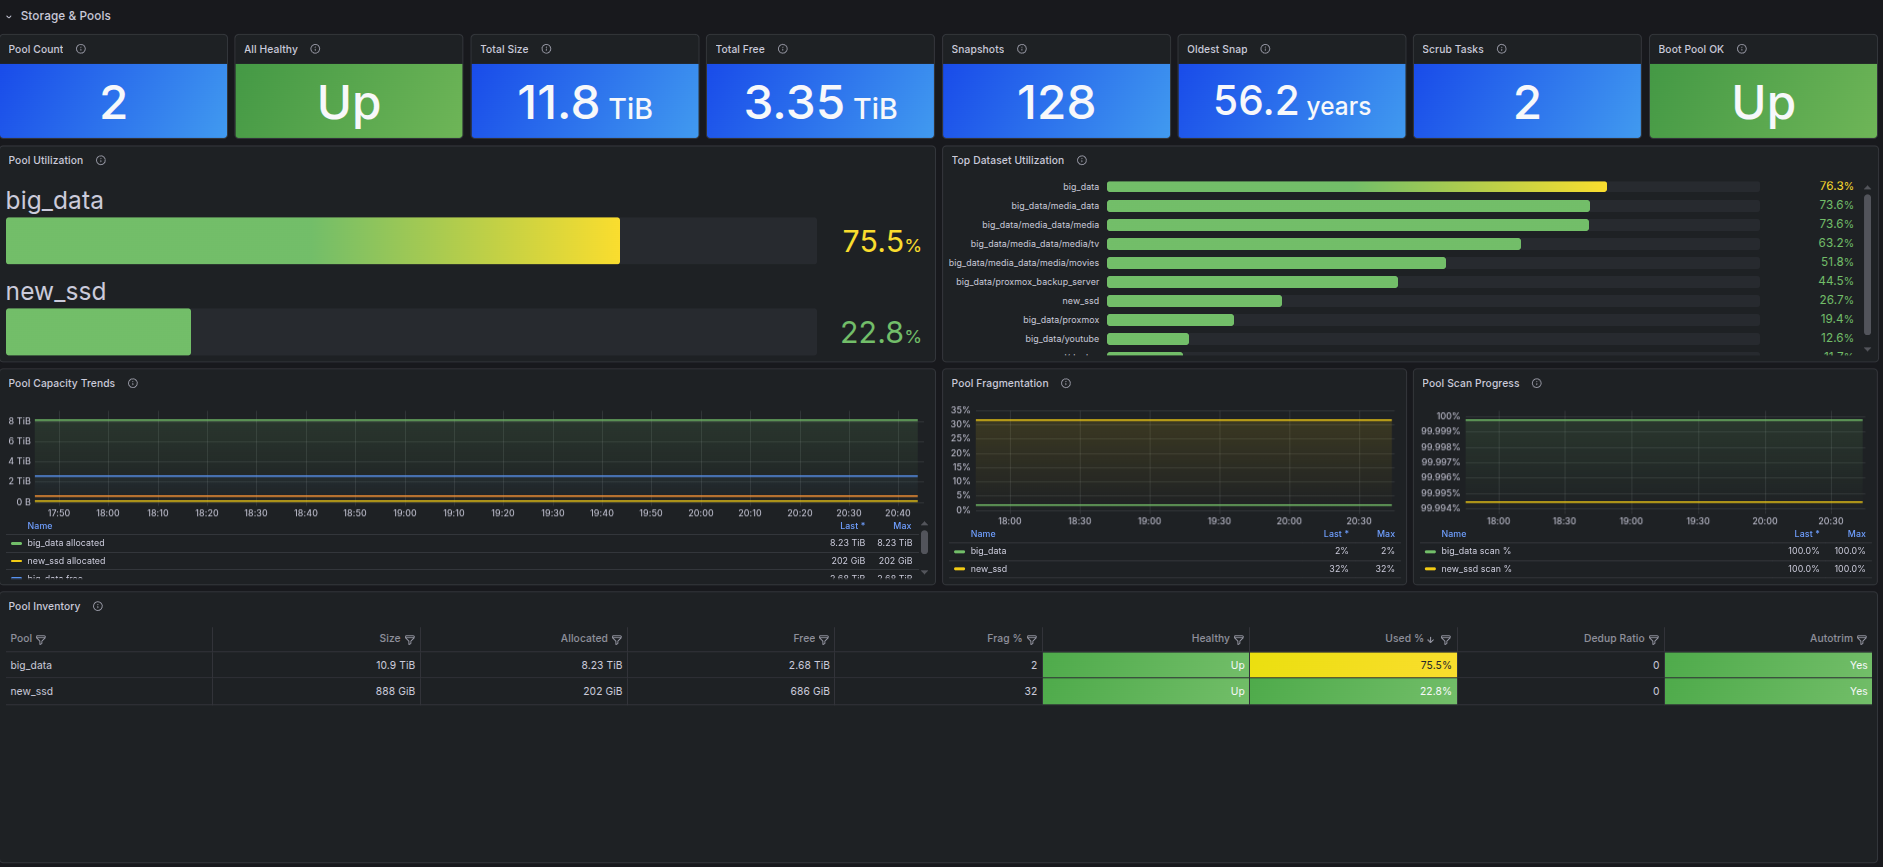
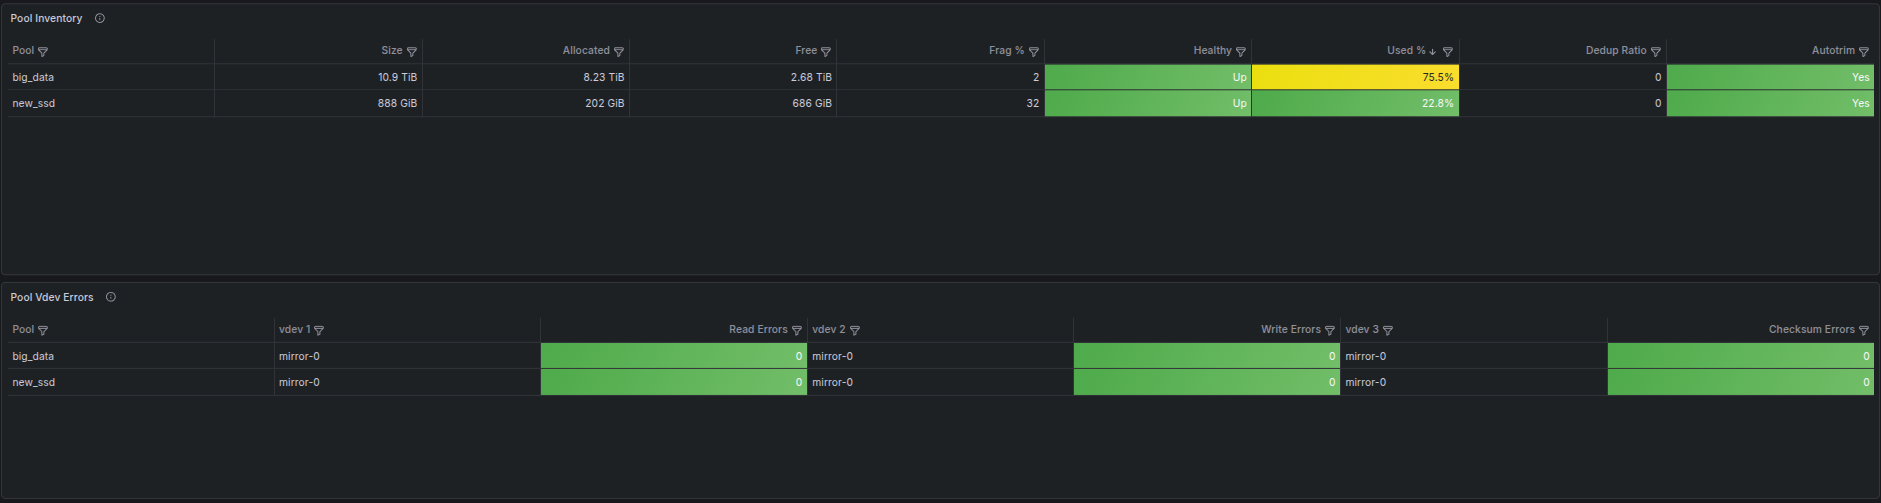
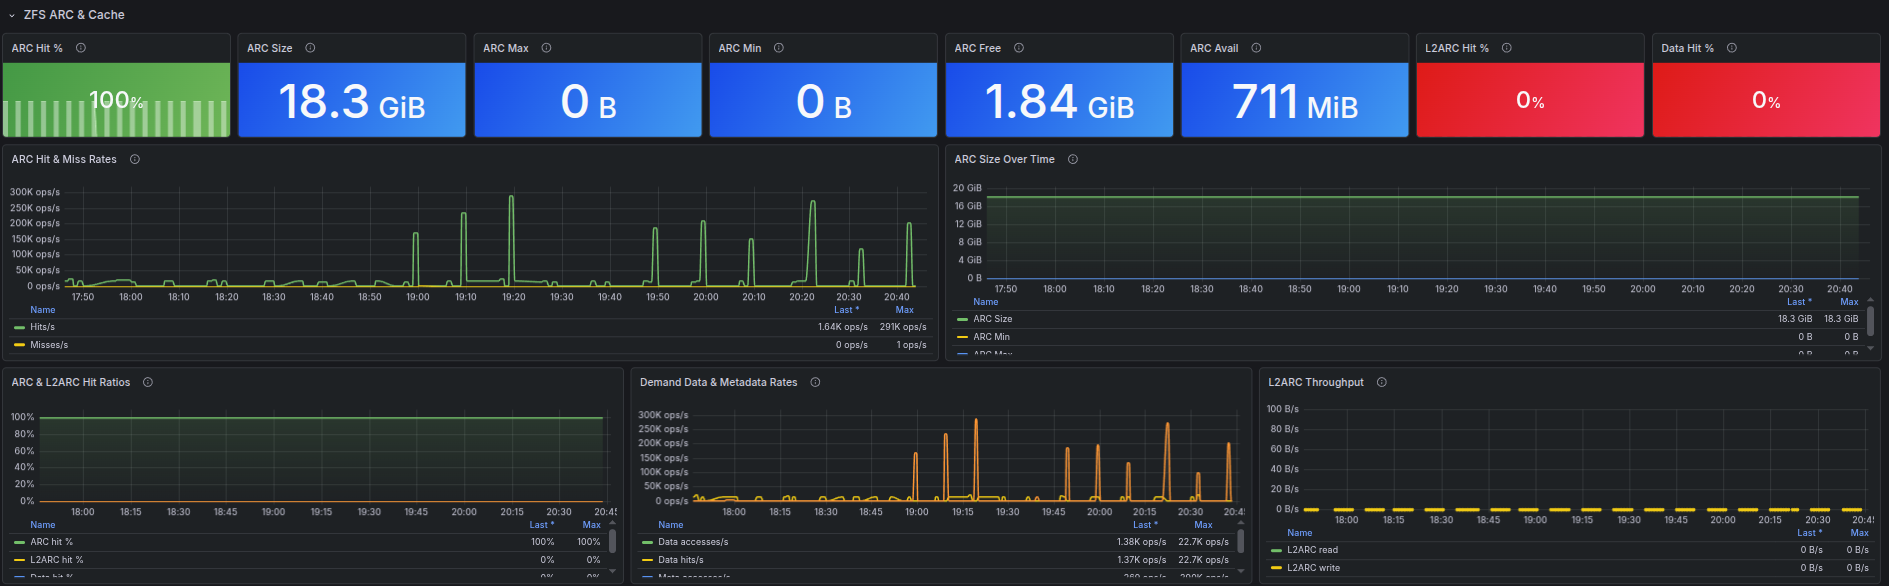
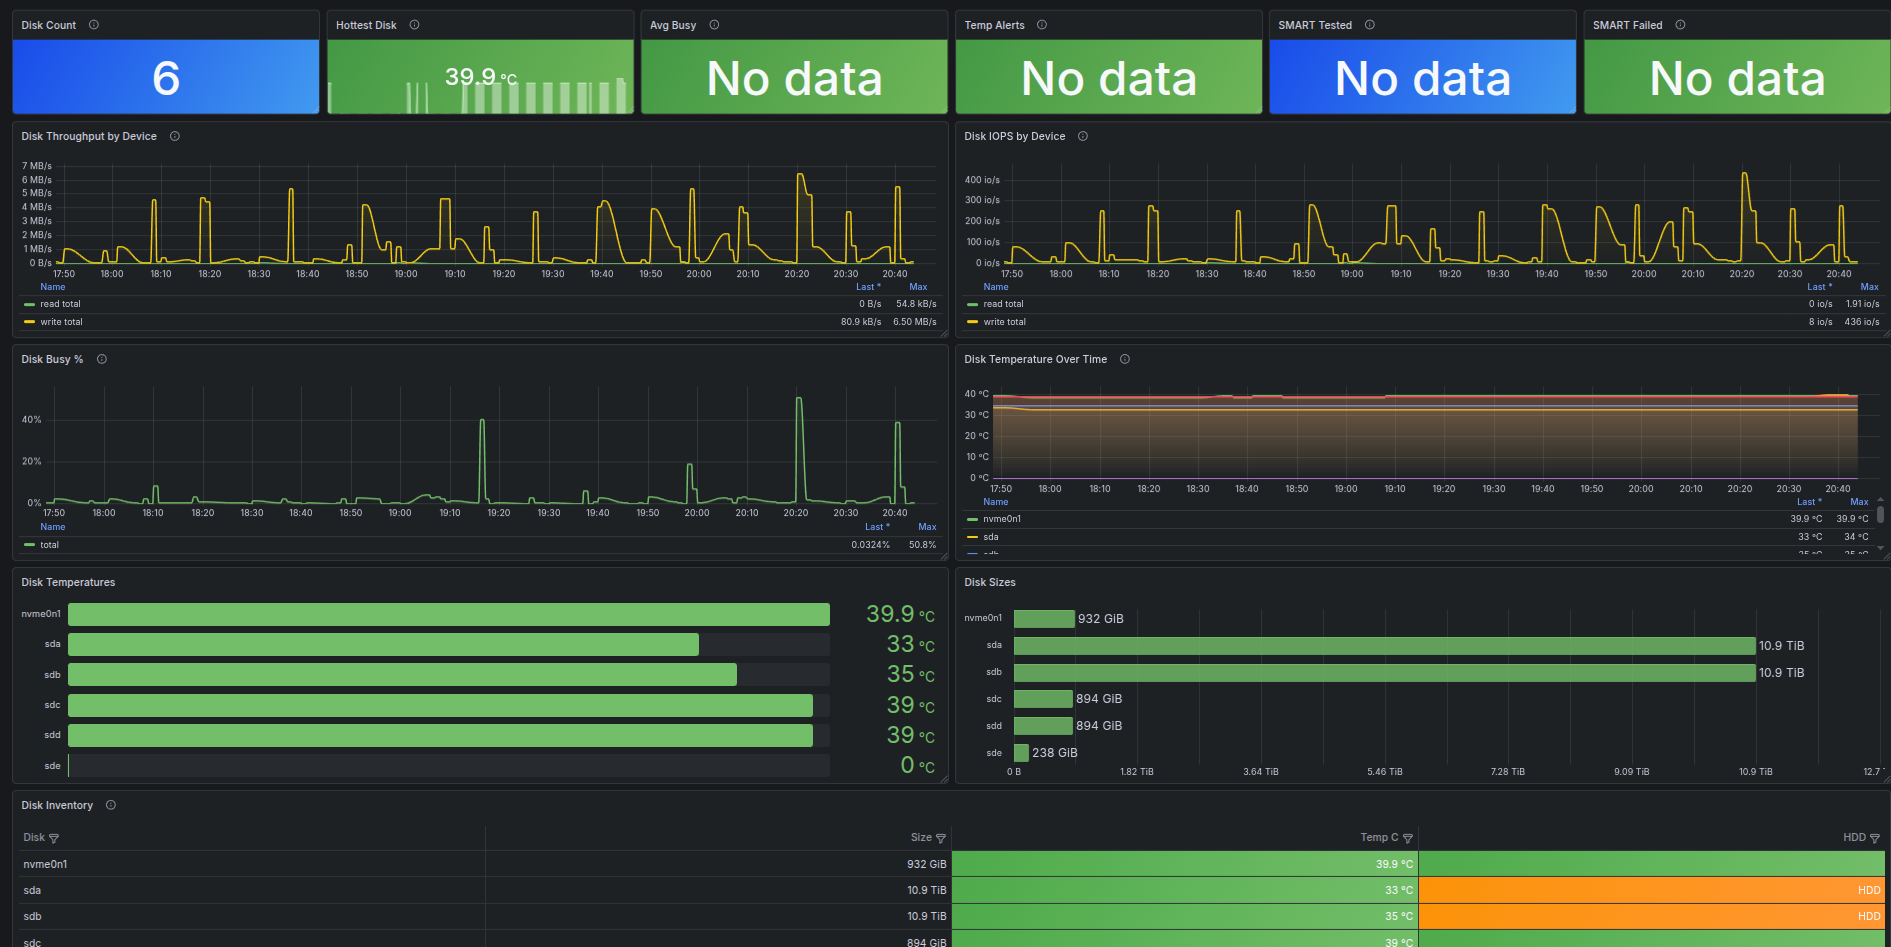
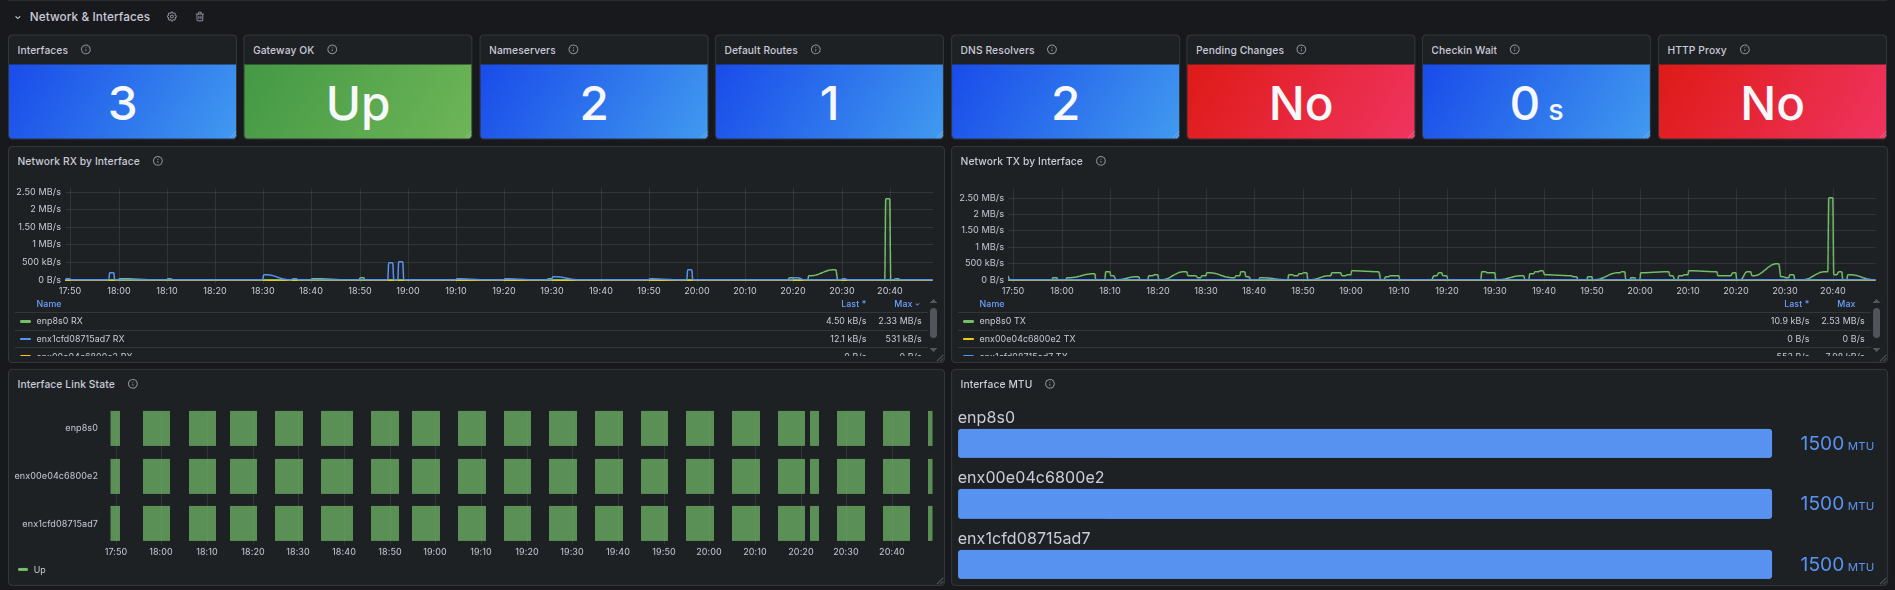
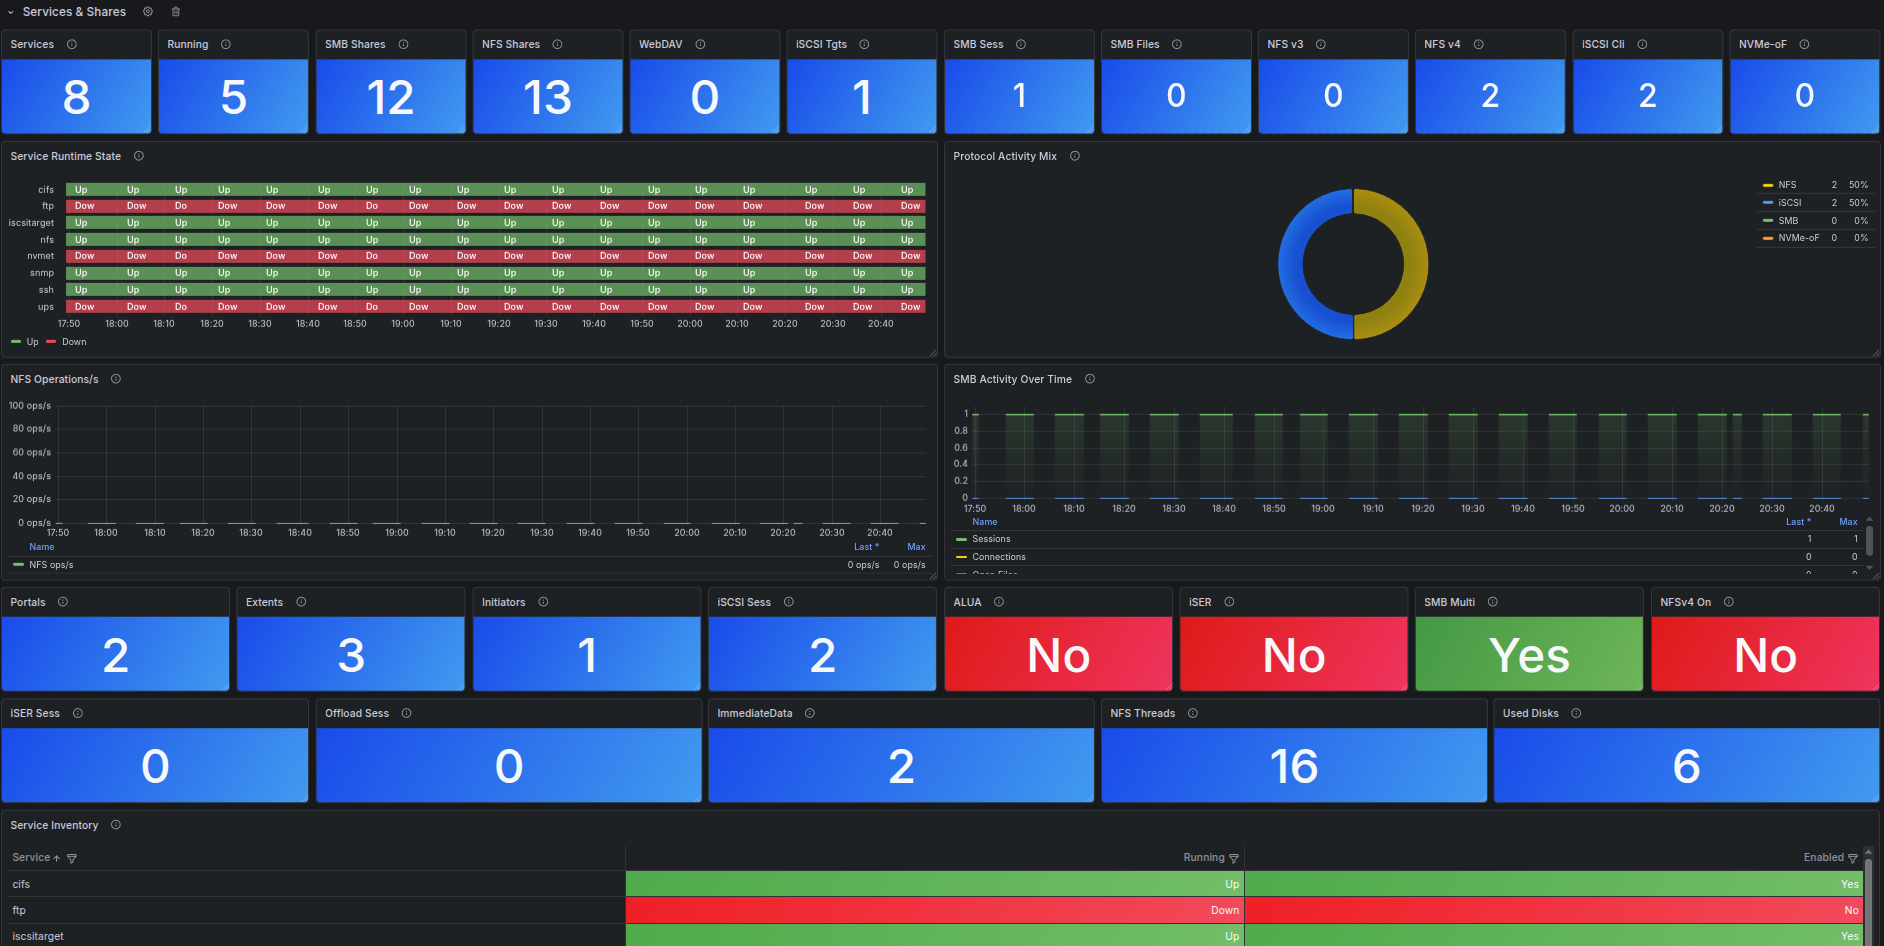
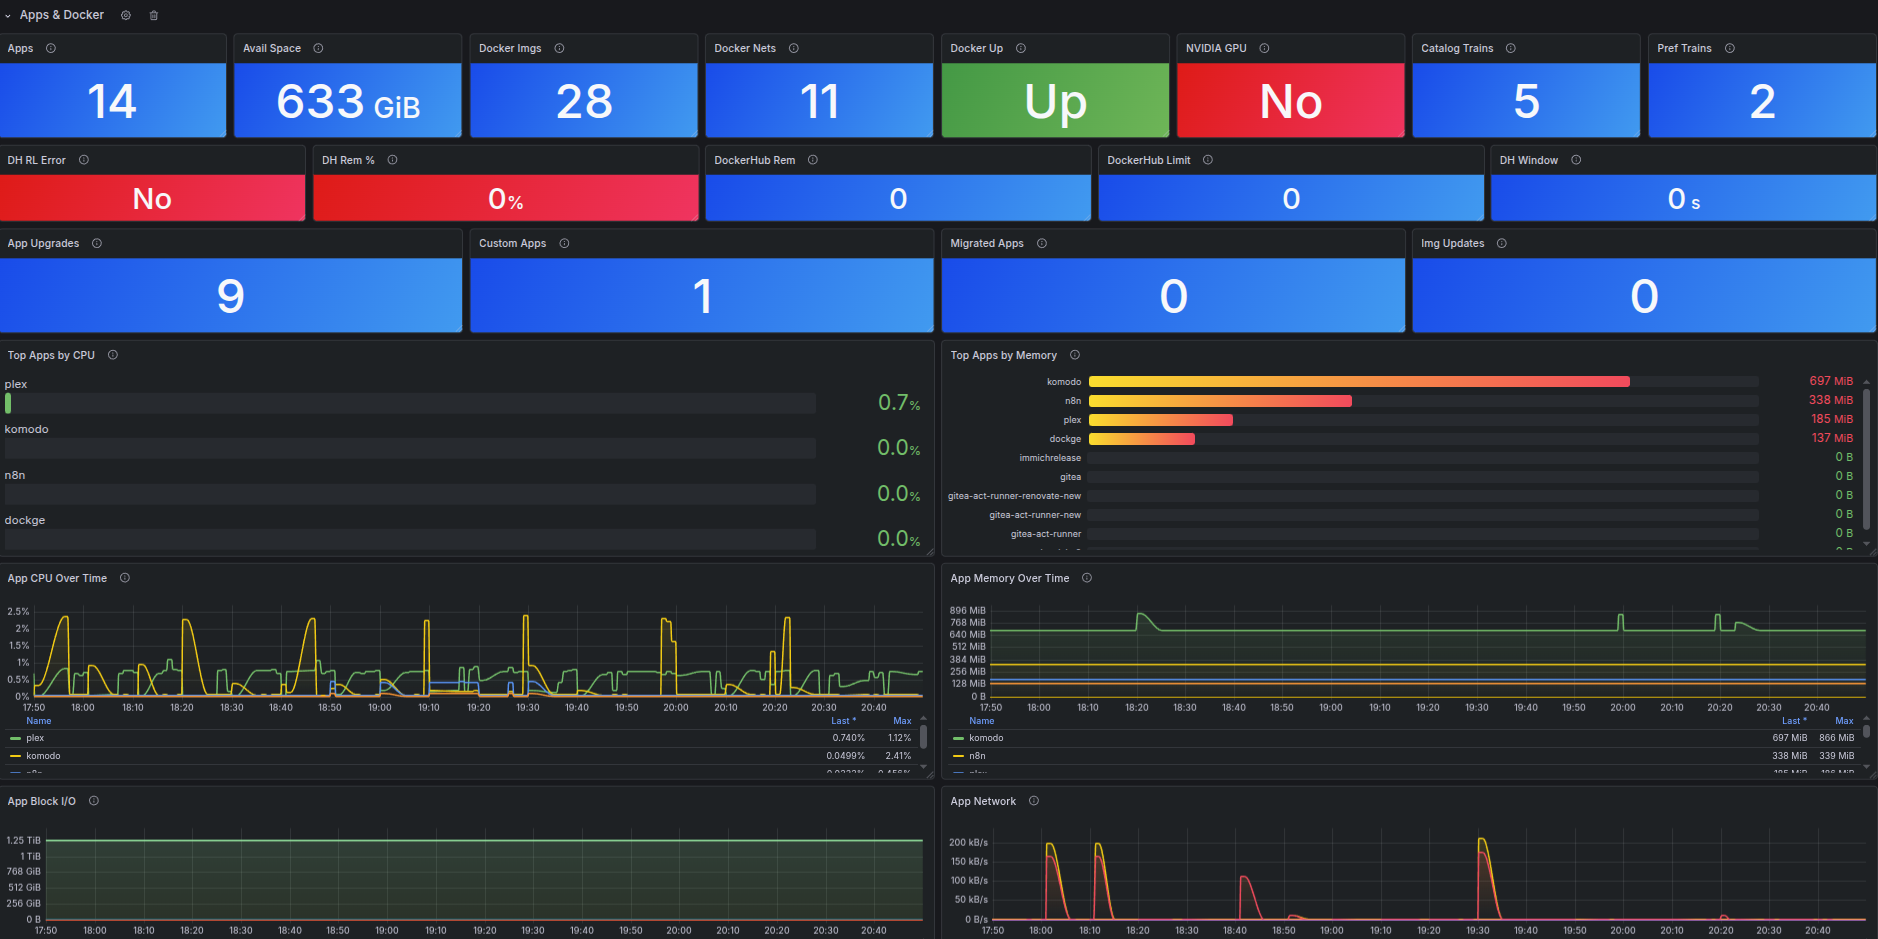
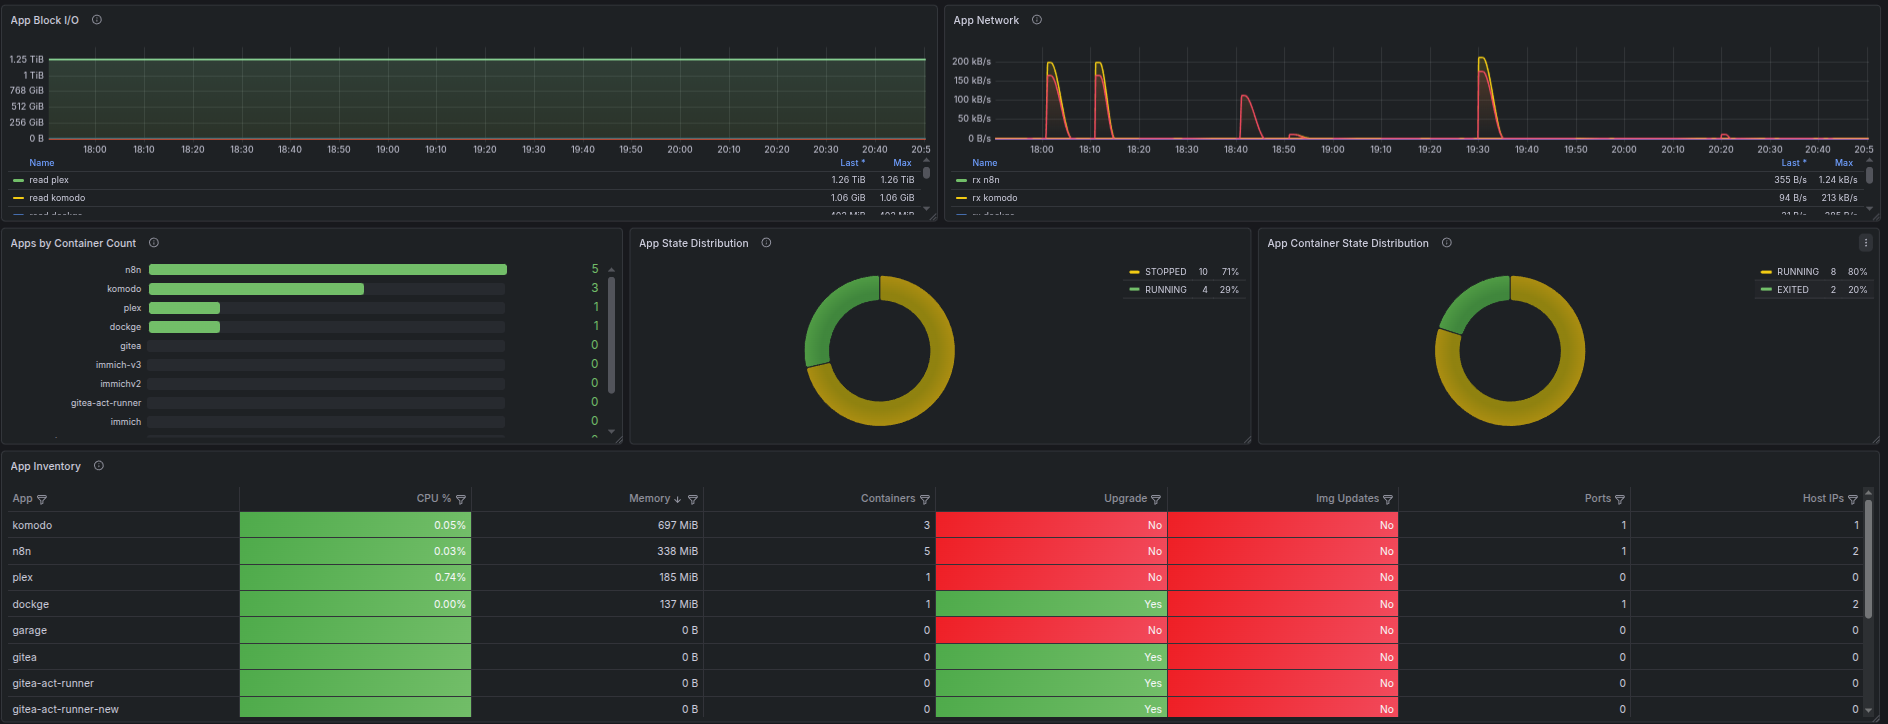
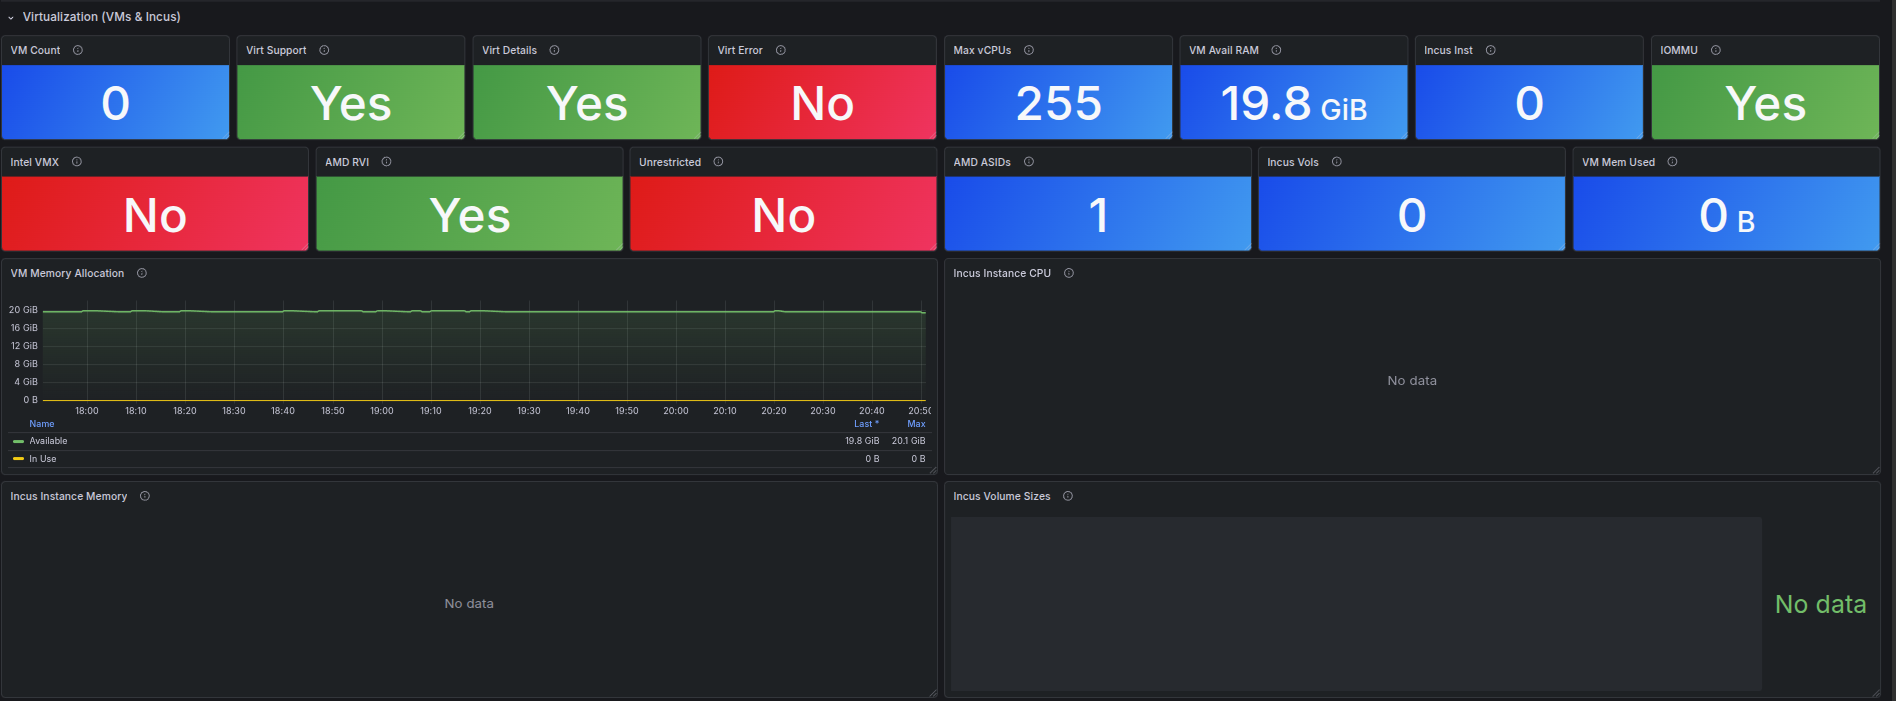
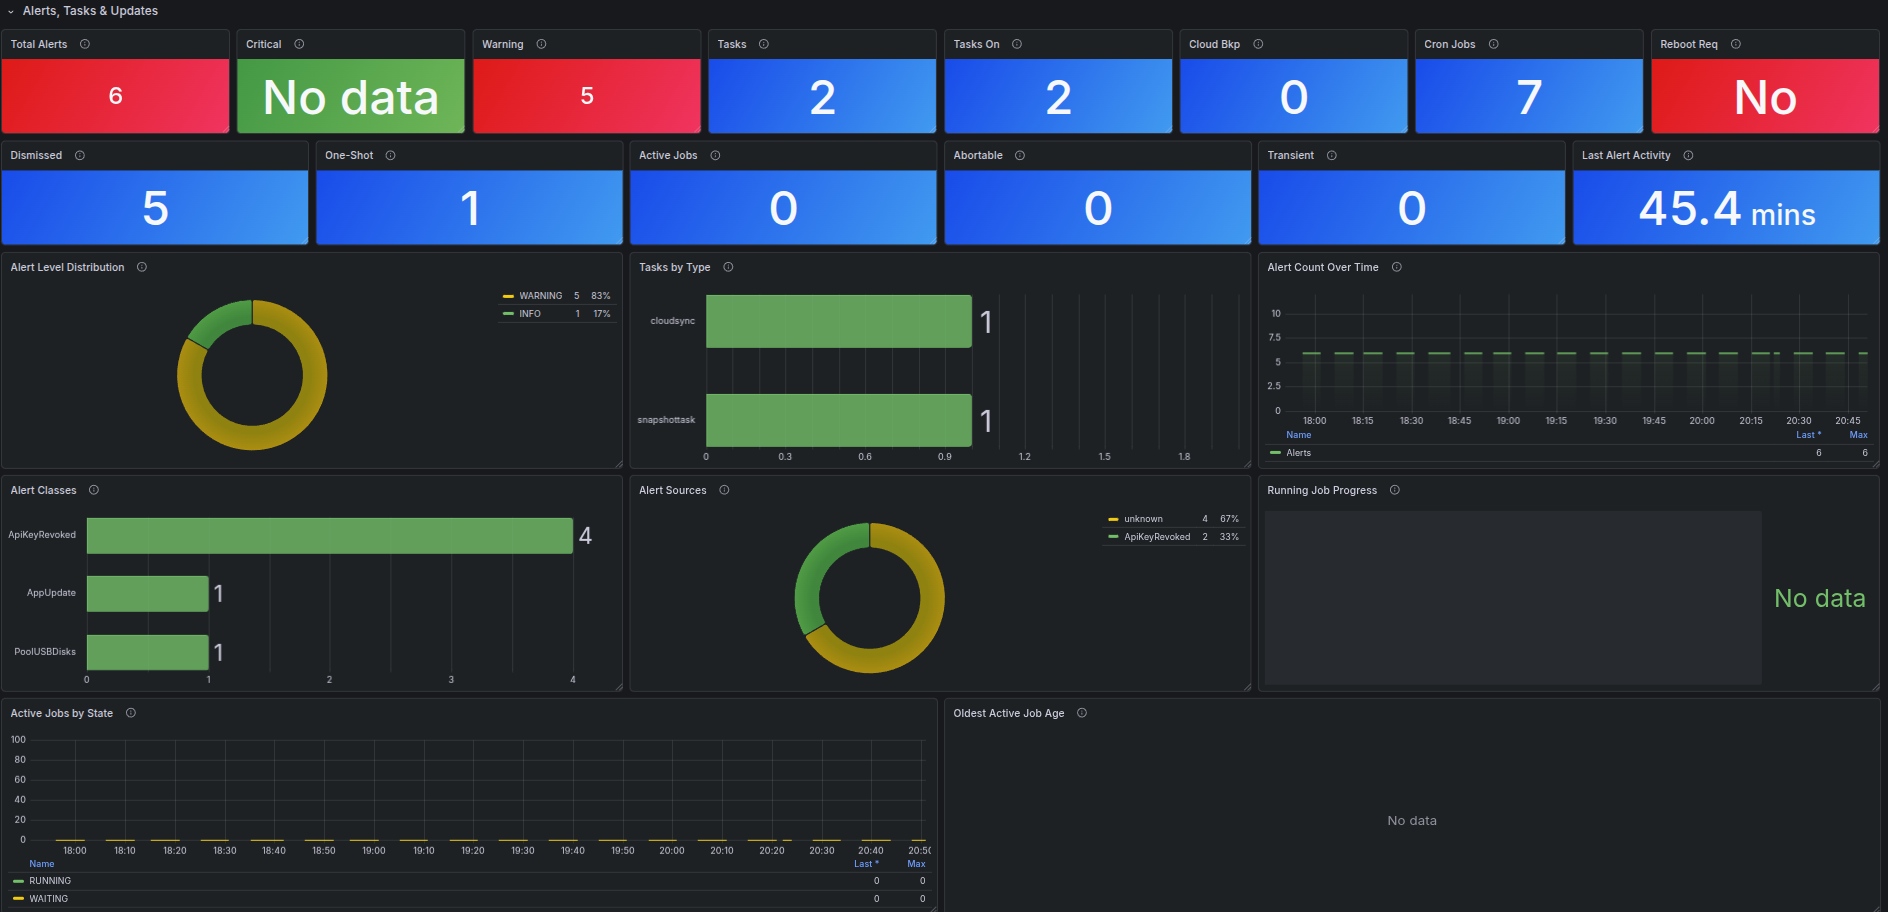
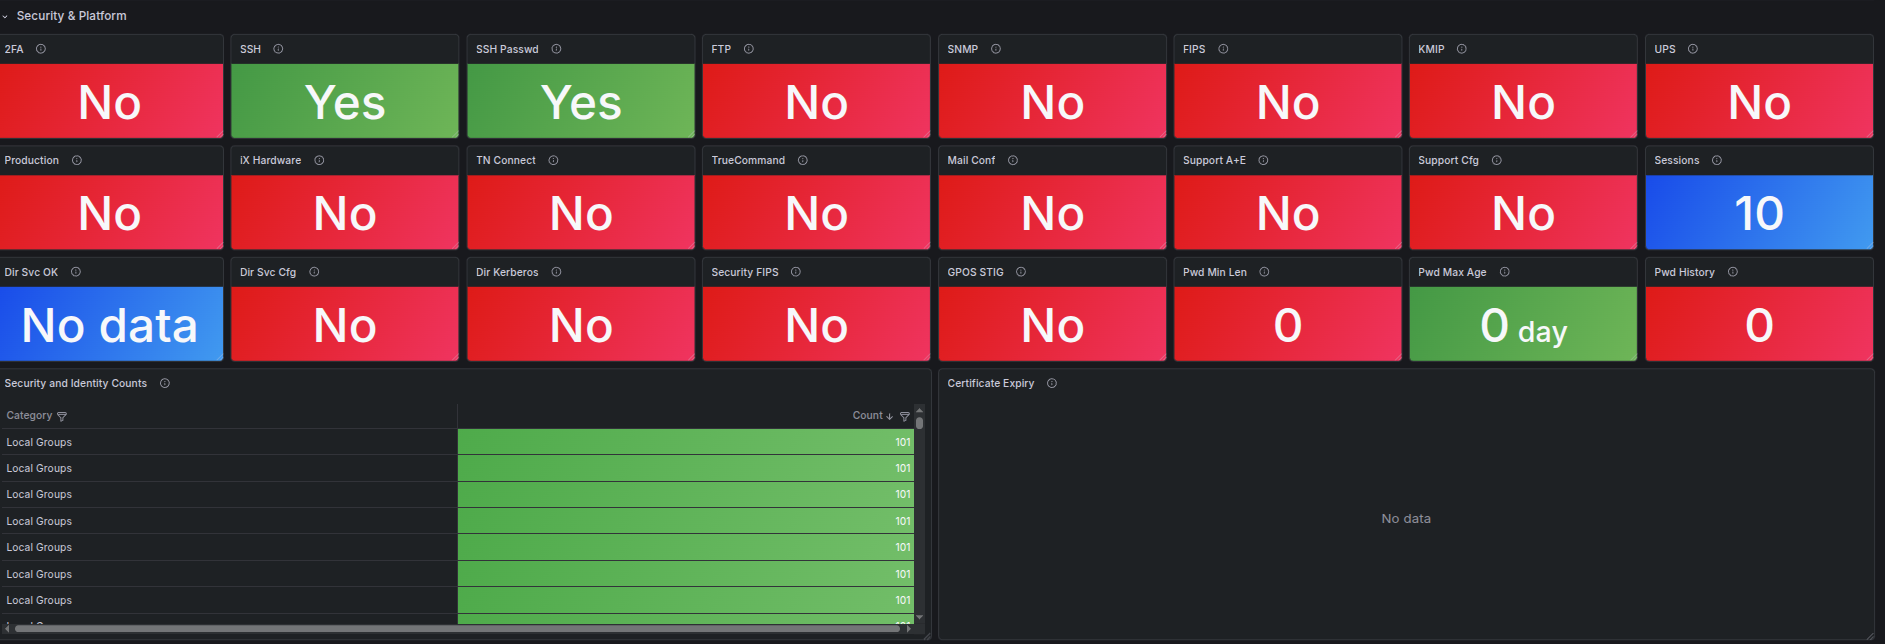
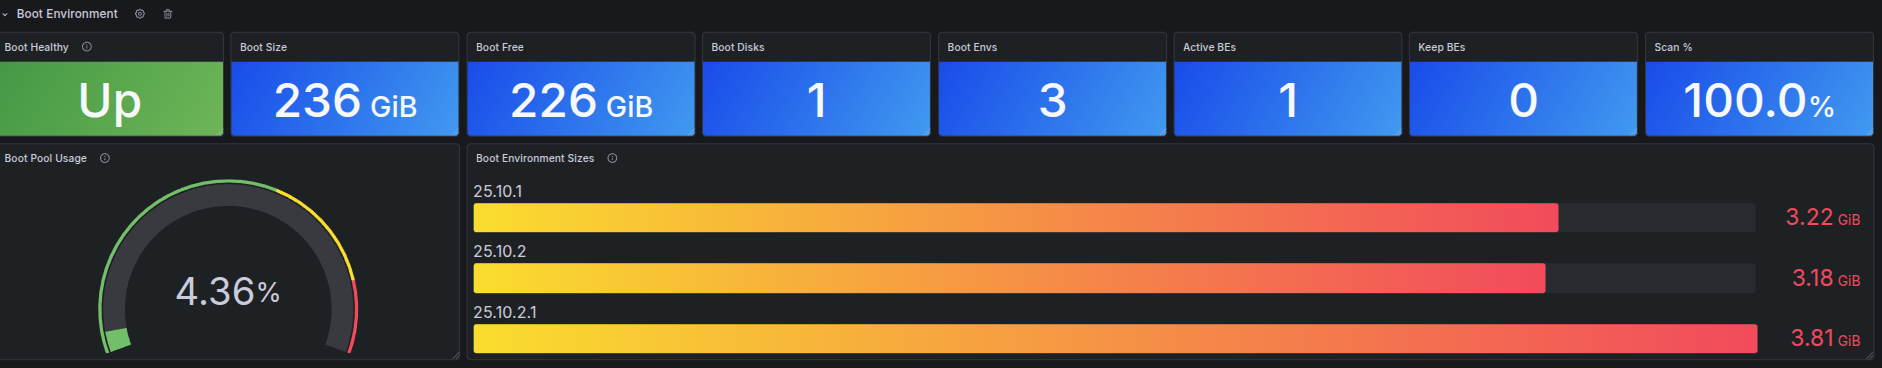
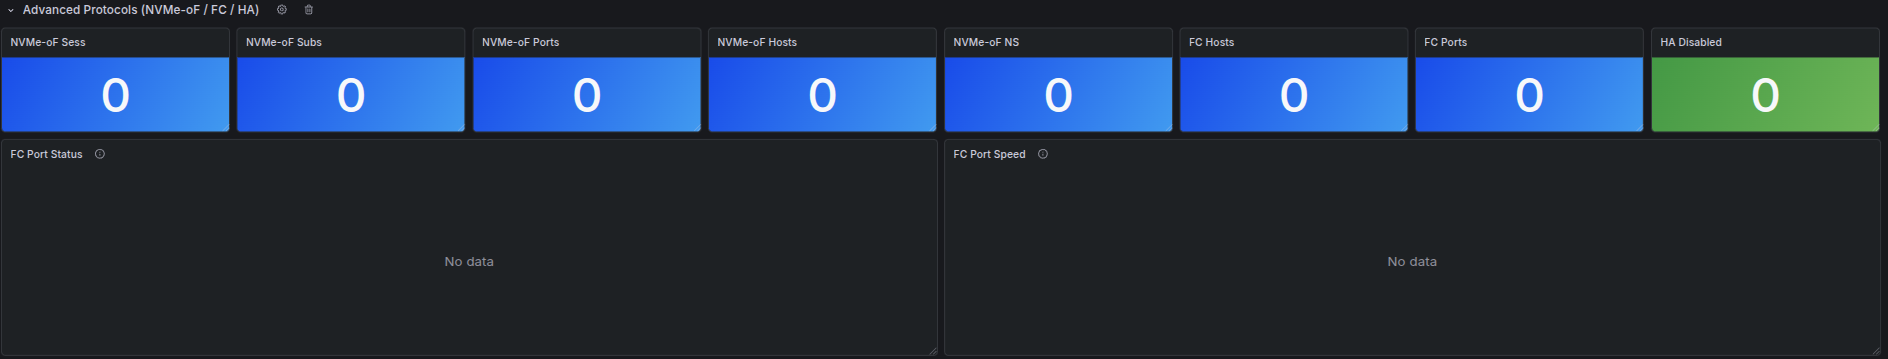
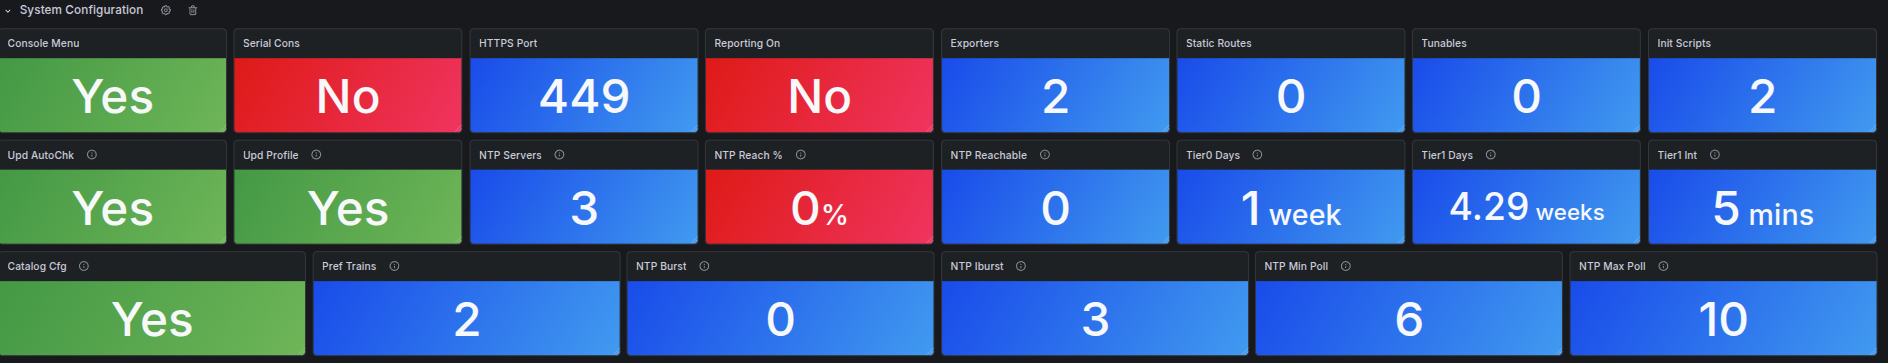
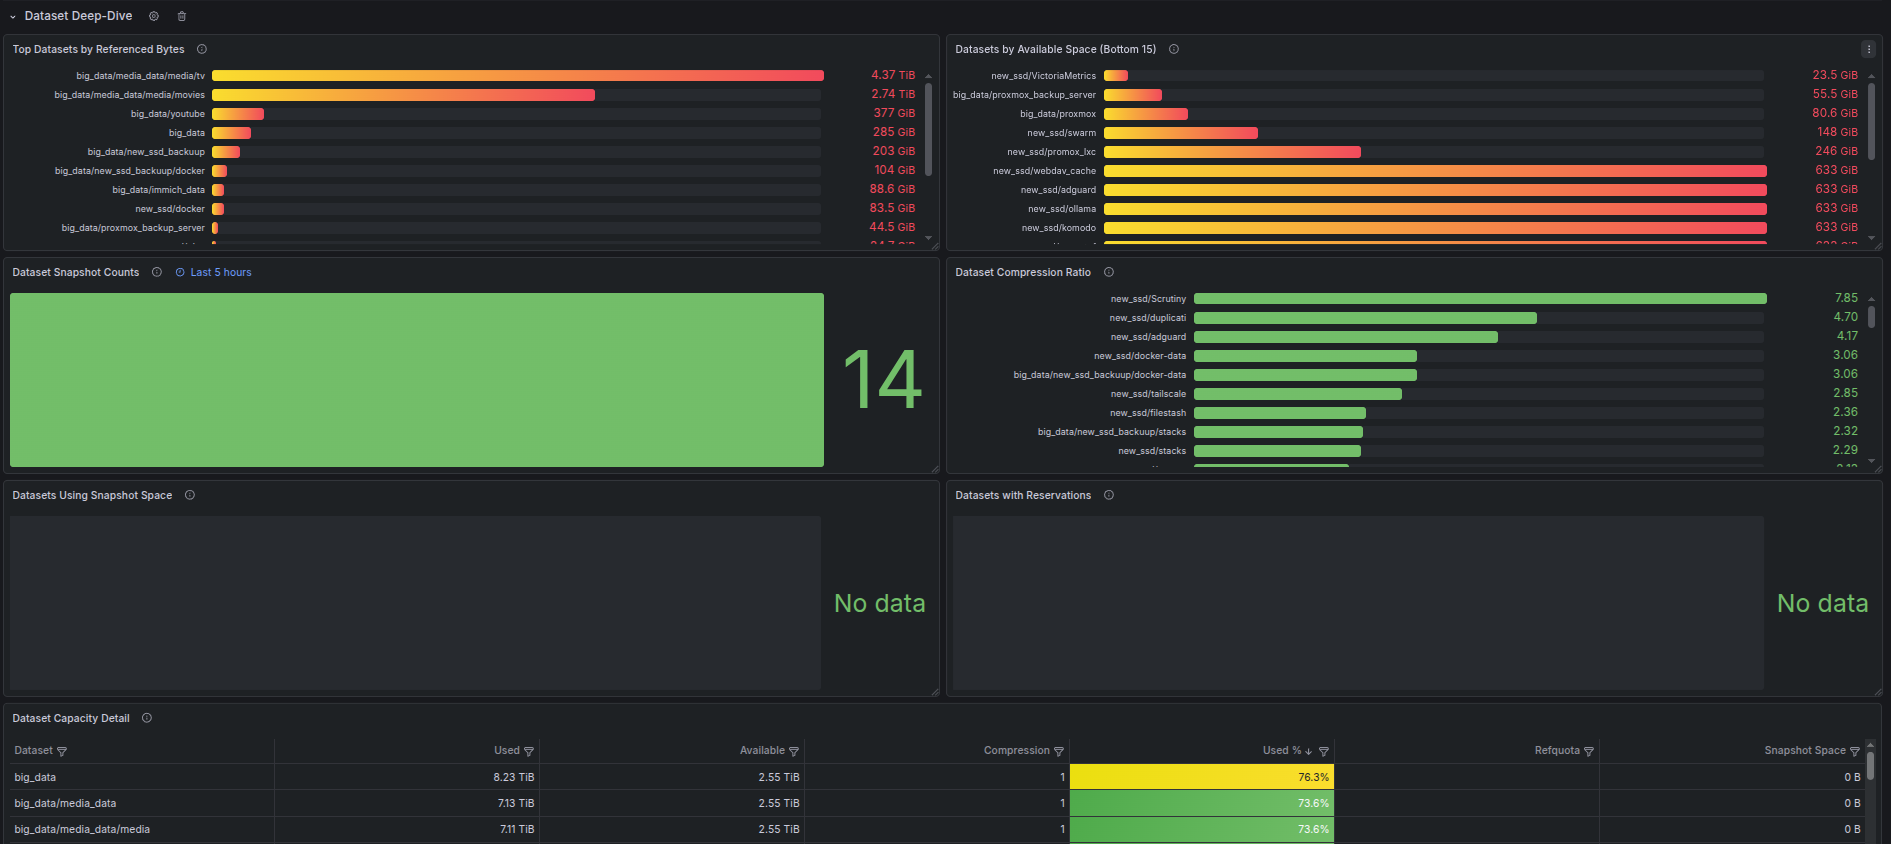
Comprehensive TrueNAS dashboard: system health, CPU, memory, ZFS pools & ARC, disks, network, services, shares, apps, VMs, boot environments, hardware/IPMI, alerts, tasks, security, advanced protocols, and exporter diagnostics.

See https://github.com/Unknowlars/truenas-scale-api-prometheus-exporter for setup and install
Data source config
Collector type:
Collector plugins:
Collector config:
Revisions
Upload an updated version of an exported dashboard.json file from Grafana
| Revision | Description | Created | |
|---|---|---|---|
| Download |