Jetson Orin Exporter - jtop
Comprehensive monitoring dashboard for NVIDIA Jetson Orin devices using metrics from the jtop Prometheus exporter. Covers GPU utilization, unified memory, per-core CPU usage and frequency, thermal zones, power consumption breakdown, GPU/EMC frequency scaling, swap, fan speed, hardware engine status (DLA, NVENC, NVDEC), disk usage, and board info. Requires a jtop-based Prometheus exporter exposing jetson_* metrics.
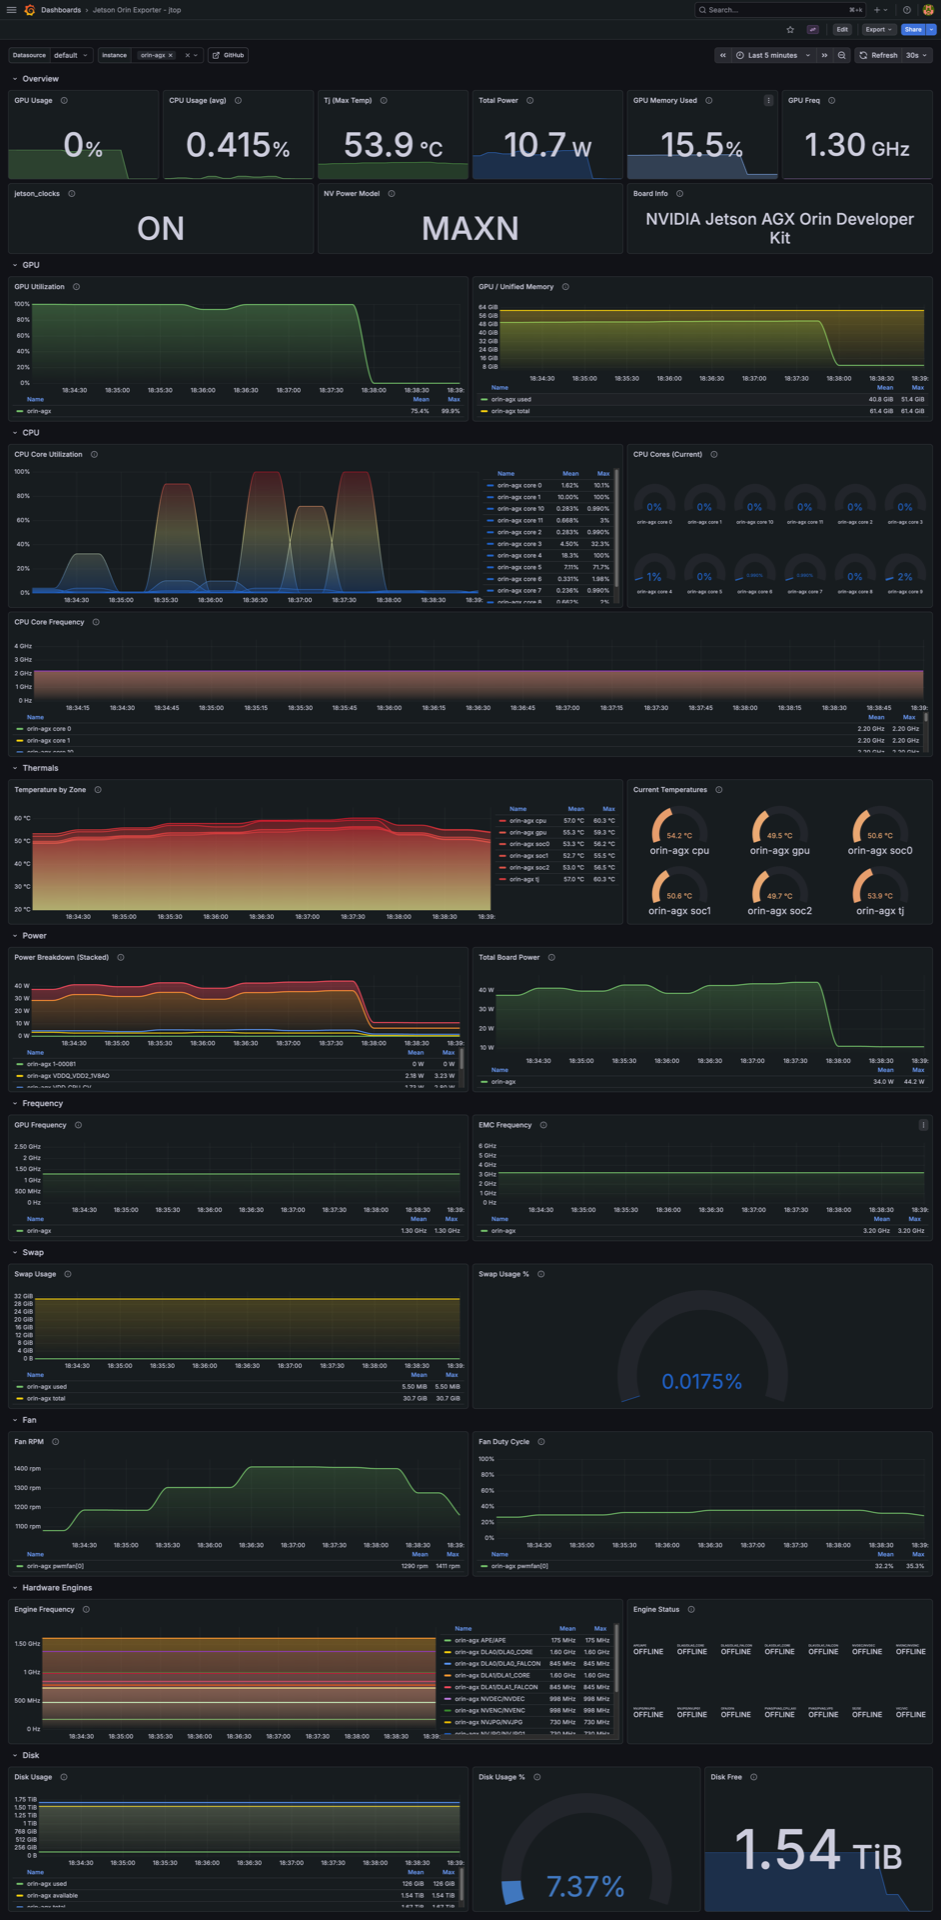
Jetson Orin Exporter Dashboard
A comprehensive Grafana dashboard designed for monitoring NVIDIA Jetson edge devices locally or across a fleet. It works seamlessly with the https://github.com/pgodlews/jetson-orin-exporter to visualize live system telemetry exposed by jetson-stats (jtop).
Tested heavily on Jetson AGX Orin and Jetson Orin Nano boards.
Features
- GPU Metrics: Overall utilization (%) and Unified memory profiling.
- CPU Metrics: Live per-core workload scaling and core frequency tracking (Hz).
- Thermal Analytics (Tj): Continuous monitoring of SoC thermal zones to quickly spot hardware throttling before it brings workloads down.
- Power Consumption: Real-time wattage across the entire board, plus deep dives into per-rail power monitors (e.g. CPU, GPU, CV, SYS5V).
- Hardware Engines: Running states and active frequencies for fixed-function hardware (DLA, NVENC, NVDEC).
- Cooling & Storage: Live fan RPM/PWM tracking and Disk/Swap capacity.
- System Internals: Current "NVP Model" power profile, EMC (Memory Controller) frequency, and
jetson_clocksactive status.
⚙️ Prerequisites
- An NVIDIA Jetson board running JetPack 6 / Ubuntu 22.04.
- The official
jtopservice https://github.com/rbonghi/jetson_statsv4.3.0or higher - The open-source https://github.com/pgodlews/jetson-orin-exporter running on the Jetson target.
🚀 Setup Instructions
Setting up the exporter on your Jetson takes under two minutes. Simply clone the repository on your target device and start the daemon:
# 1. Clone the repository
git clone https://github.com/pgodlews/jetson-orin-exporter.git
cd jetson-orin-exporter
2. Install dependencies
sudo pip3 install -r requirements.txt
3. Test the exporter daemon
sudo mkdir -p /opt/jetson_exporter
sudo cp jetson_exporter.py /opt/jetson_exporter/
python3 /opt/jetson_exporter/jetson_exporter.py
*(For proper production systemd service installation so it starts directly on boot, see the full guide on the https://github.com/pgodlews/jetson-orin-exporter
Once running, point your Prometheus scrape config to the device (target_ip:9101), select your Prometheus datasource dynamically in this dashboard, and your Jetson metrics will instantly populate!
Tags: nvidia, jetson, orin, jtop, gpu, edge, hardware, host-metrics
Data source config
Collector config:
Upload an updated version of an exported dashboard.json file from Grafana
| Revision | Description | Created | |
|---|---|---|---|
| Download |