GitHub Copilot
Monitor GitHub Copilot usage and performance via Application Insights OpenTelemetry data. Tracks agent operations, LLM token consumption, model latency (response duration and time-to-first-token), chat sessions, tool calls, feature adoption, and errors. Includes trace drill-down for debugging individual Copilot interactions.
GitHub Copilot
Monitoring dashboard for GitHub Copilot usage and performance via Application Insights OpenTelemetry data. Tracks agent operations, LLM token consumption, model latency (response duration and time-to-first-token), chat sessions, tool calls, feature adoption, and errors. Includes trace drill-down for debugging individual Copilot interactions.
Screenshots

Issues and feedback
https://github.com/1w2w3y/grafana-dashboards/issues
Features
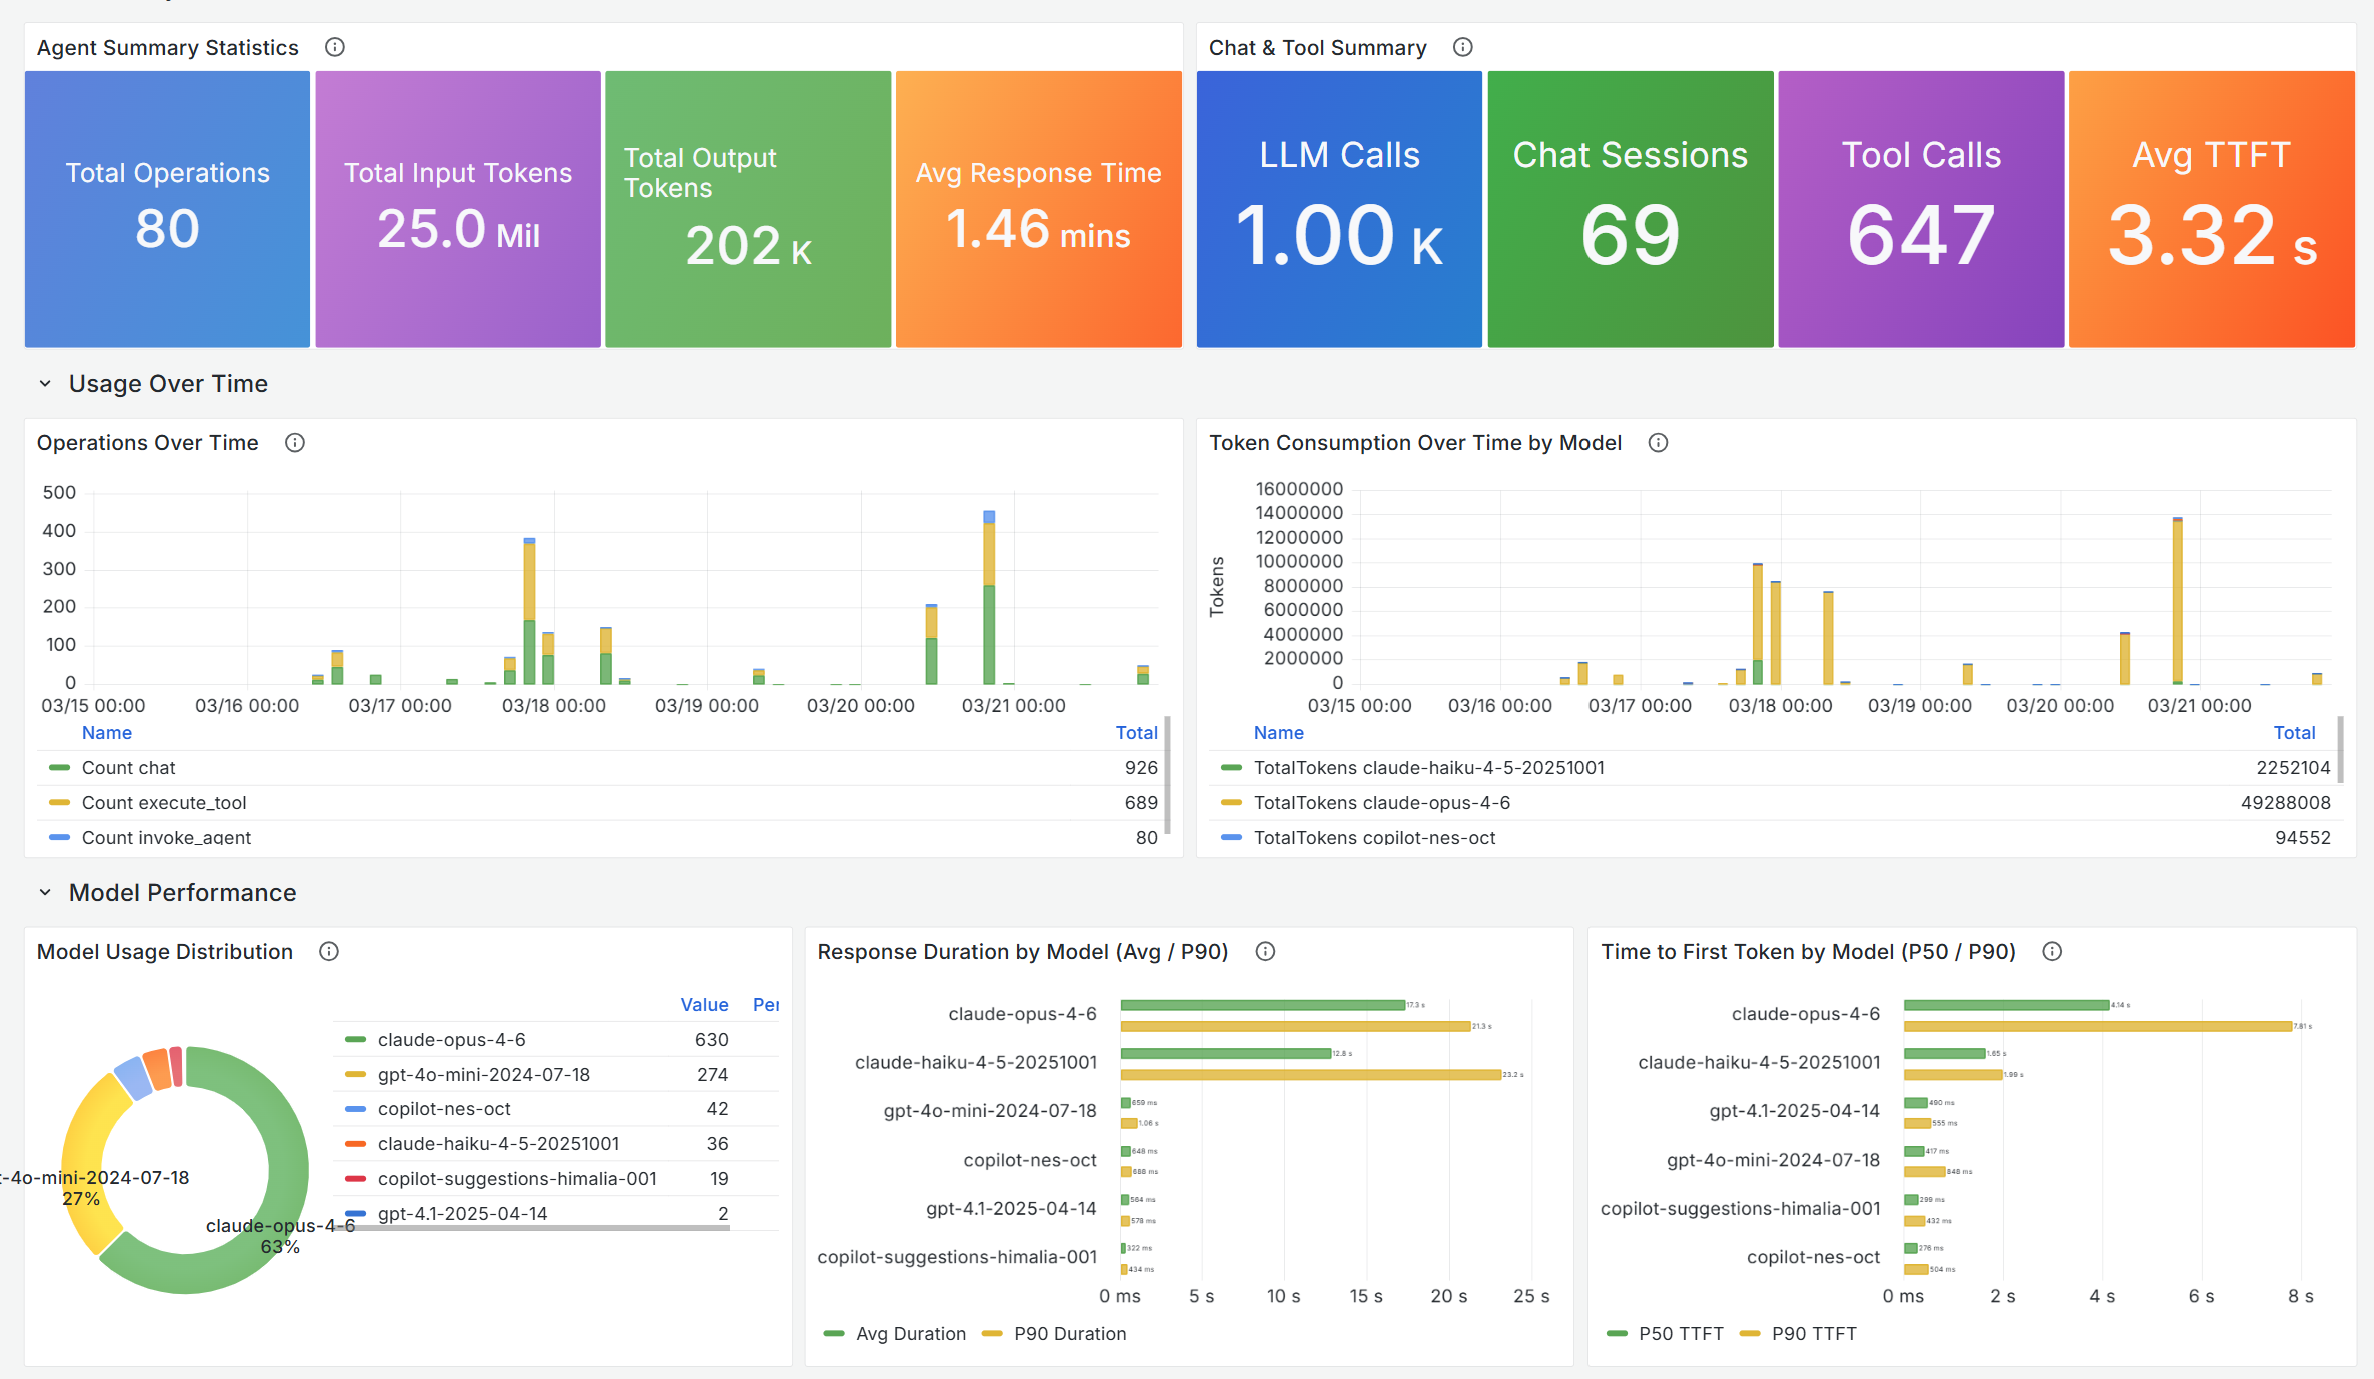
- Summary
- Agent Summary Statistics (total operations, tokens, avg response time)
- Chat & Tool Summary (total calls, tokens, avg TTFT)
- Usage Over Time
- Operations Over Time
- Token Consumption Over Time by Model
- Model Performance
- Model Usage Distribution
- Response Duration by Model (Avg / P90)
- Time to First Token by Model (P50 / P90)
- Latency Trends
- Avg Response Duration Over Time by Model
- Time to First Token (P50 / P90) Over Time
- Agent & Feature Activity
- Copilot Feature Usage
- Top Tool Calls
- Sessions, Turns & Tool Calls Over Time
- Token Efficiency & Cost
- Token Usage by Model (Table)
- Input vs Output Tokens Over Time
- Errors & Reliability
- Exceptions Over Time
- Exception Details
- Trace Drill-Down
- Select a trace by operation
- Recent Operations table
- Trace Visualization
How it works
- Grafana queries Application Insights via the Azure Monitor data source using Log Analytics (KQL) queries against OpenTelemetry data.
- Variables:
am_ds— Azure Monitor data sourcesub— Azure subscriptionrg— Resource group (resolved via Azure Resource Graph formicrosoft.insights/components)res— Application Insights resourcecopilotTraceId— hidden variable for trace drill-down, populated fromdependenciestable filtered byservice.name == "copilot-chat"
- Default time range is 7 days.
Requirements
- Grafana 11.6+ with the Azure Monitor data source configured with access to the subscription containing your Application Insights resource.
- GitHub Copilot telemetry data flowing into Application Insights via OpenTelemetry. See Ingest data into Application Insights via OpenTelemetry Collector for the end-to-end setup — running the OTel Collector with the Azure Monitor Exporter, the VS Code
settings.jsonkeys (github.copilot.chat.otel.enabled,otlpEndpoint, etc.), and KQL verification queries against thedependenciestable (cloud_RoleName == "copilot-chat").
Change history
- 5/1/2026 Point data-ingestion link to the published Microsoft Learn guide (aka.ms/amg/dash-doc/otlp-appinsights)
- 3/23/2026 Initial version
Data source config
Collector config:
Upload an updated version of an exported dashboard.json file from Grafana
| Revision | Description | Created | |
|---|---|---|---|
| Download |
GitHub
Easily monitor GitHub, a service for software development and version control using Git, with Grafana Cloud's out-of-the-box monitoring solution.
Learn more