Docker Container Monitoring — Telegraf + Prometheus (no cAdvisor)
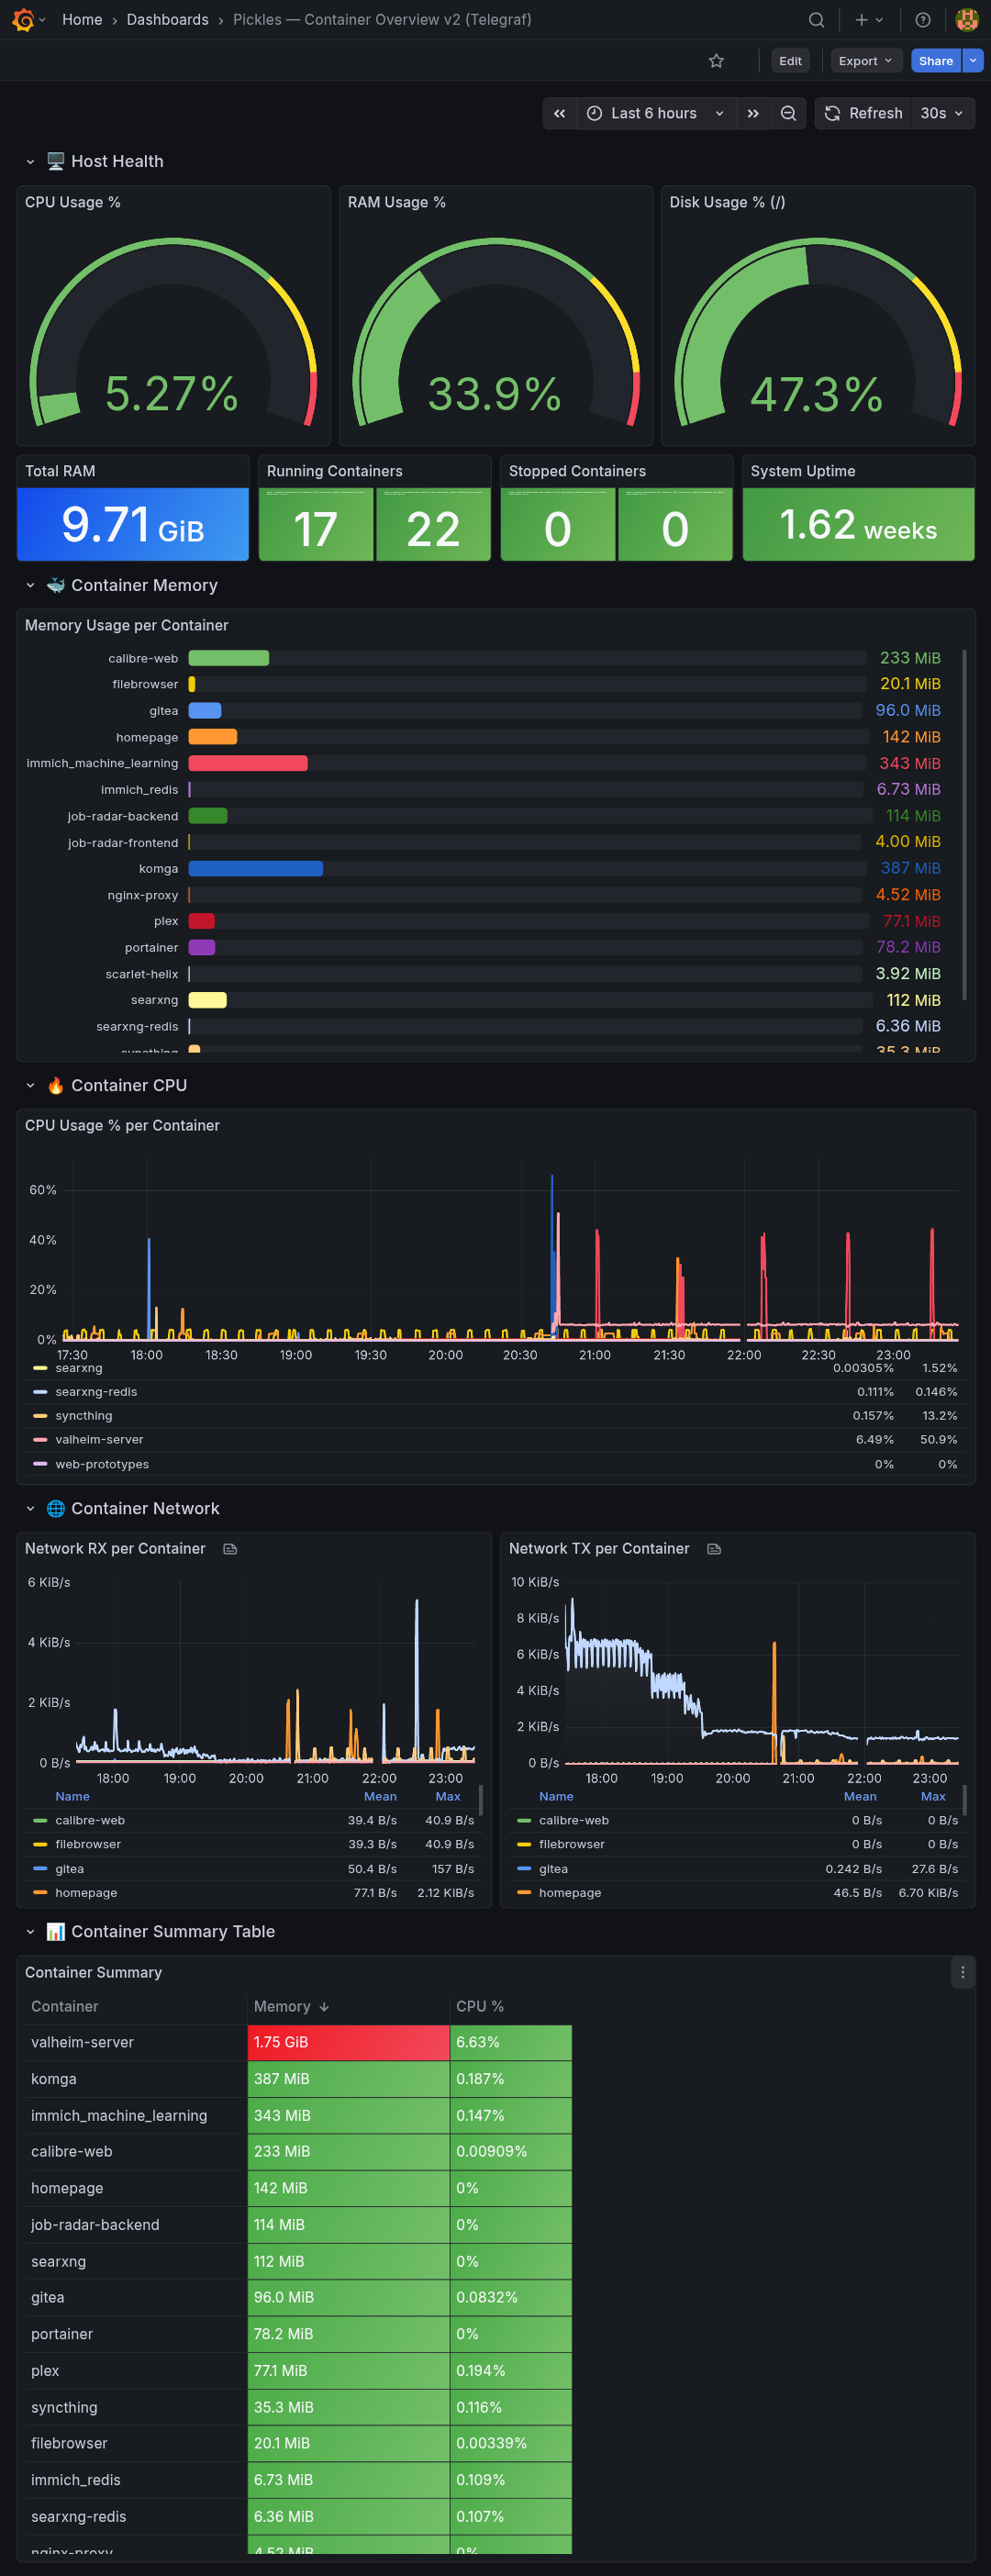
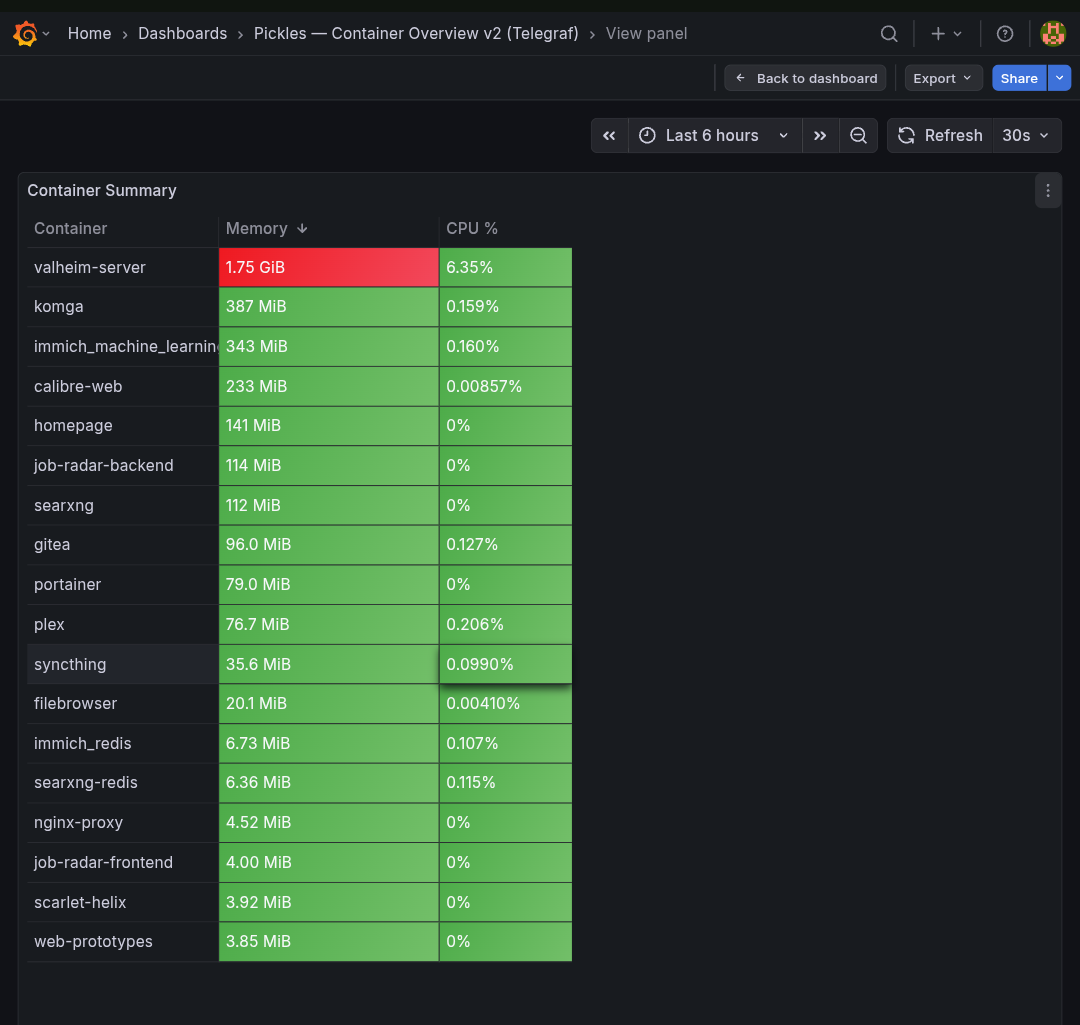
A homelab-focused Docker container dashboard for setups using Telegraf's Docker socket input plugin with Prometheus output — no cAdvisor required. Built for environments where cAdvisor fails due to cgroup v2 incompatibility or non-standard Docker data roots. Panels: host CPU/RAM/disk gauges (via node_exporter), per-container memory bar gauge (deduplicated), CPU % time series, network RX/TX, and a colour-coded summary table sorted by memory usage. Tested on Proxmox + Docker Compose with Telegraf → prometheus_client → Prometheus → Grafana.
Requirements
- Telegraf with
inputs.docker(Docker socket) andoutputs.prometheus_client - Prometheus scraping Telegraf's metrics endpoint
- node_exporter running on the host, scraped by Prometheus
- Grafana with Prometheus as a data source
Why no cAdvisor?
cAdvisor fails silently on setups with cgroup v2 and non-standard Docker data roots. This dashboard uses Telegraf's Docker input plugin via the Docker socket instead, which works reliably in those environments.
Metrics used
docker_container_mem_usage— container memorydocker_container_cpu_usage_percent— container CPUdocker_container_net_rx_bytes/docker_container_net_tx_bytes— networknode_cpu_seconds_total— host CPUnode_memory_MemTotal_bytes/node_memory_MemAvailable_bytes— host RAMnode_filesystem_avail_bytes— host diskdocker_n_containers_running/docker_n_containers_stopped— container counts
Data source config
Collector config:
Upload an updated version of an exported dashboard.json file from Grafana
| Revision | Description | Created | |
|---|---|---|---|
| Download |
Docker
Easily monitor Docker with Grafana Cloud's out-of-the-box monitoring solution.
Learn more