Manticore Search
Monitoring dashboard for Manticore Search with Prometheus metrics: health, version, QPS, latency, memory, tables, cluster status, worker utilization, crashes, and restarts
Overview
This dashboard monitors Manticore Search through Prometheus metrics exposed on the metrics endpoint.
It provides visibility into:
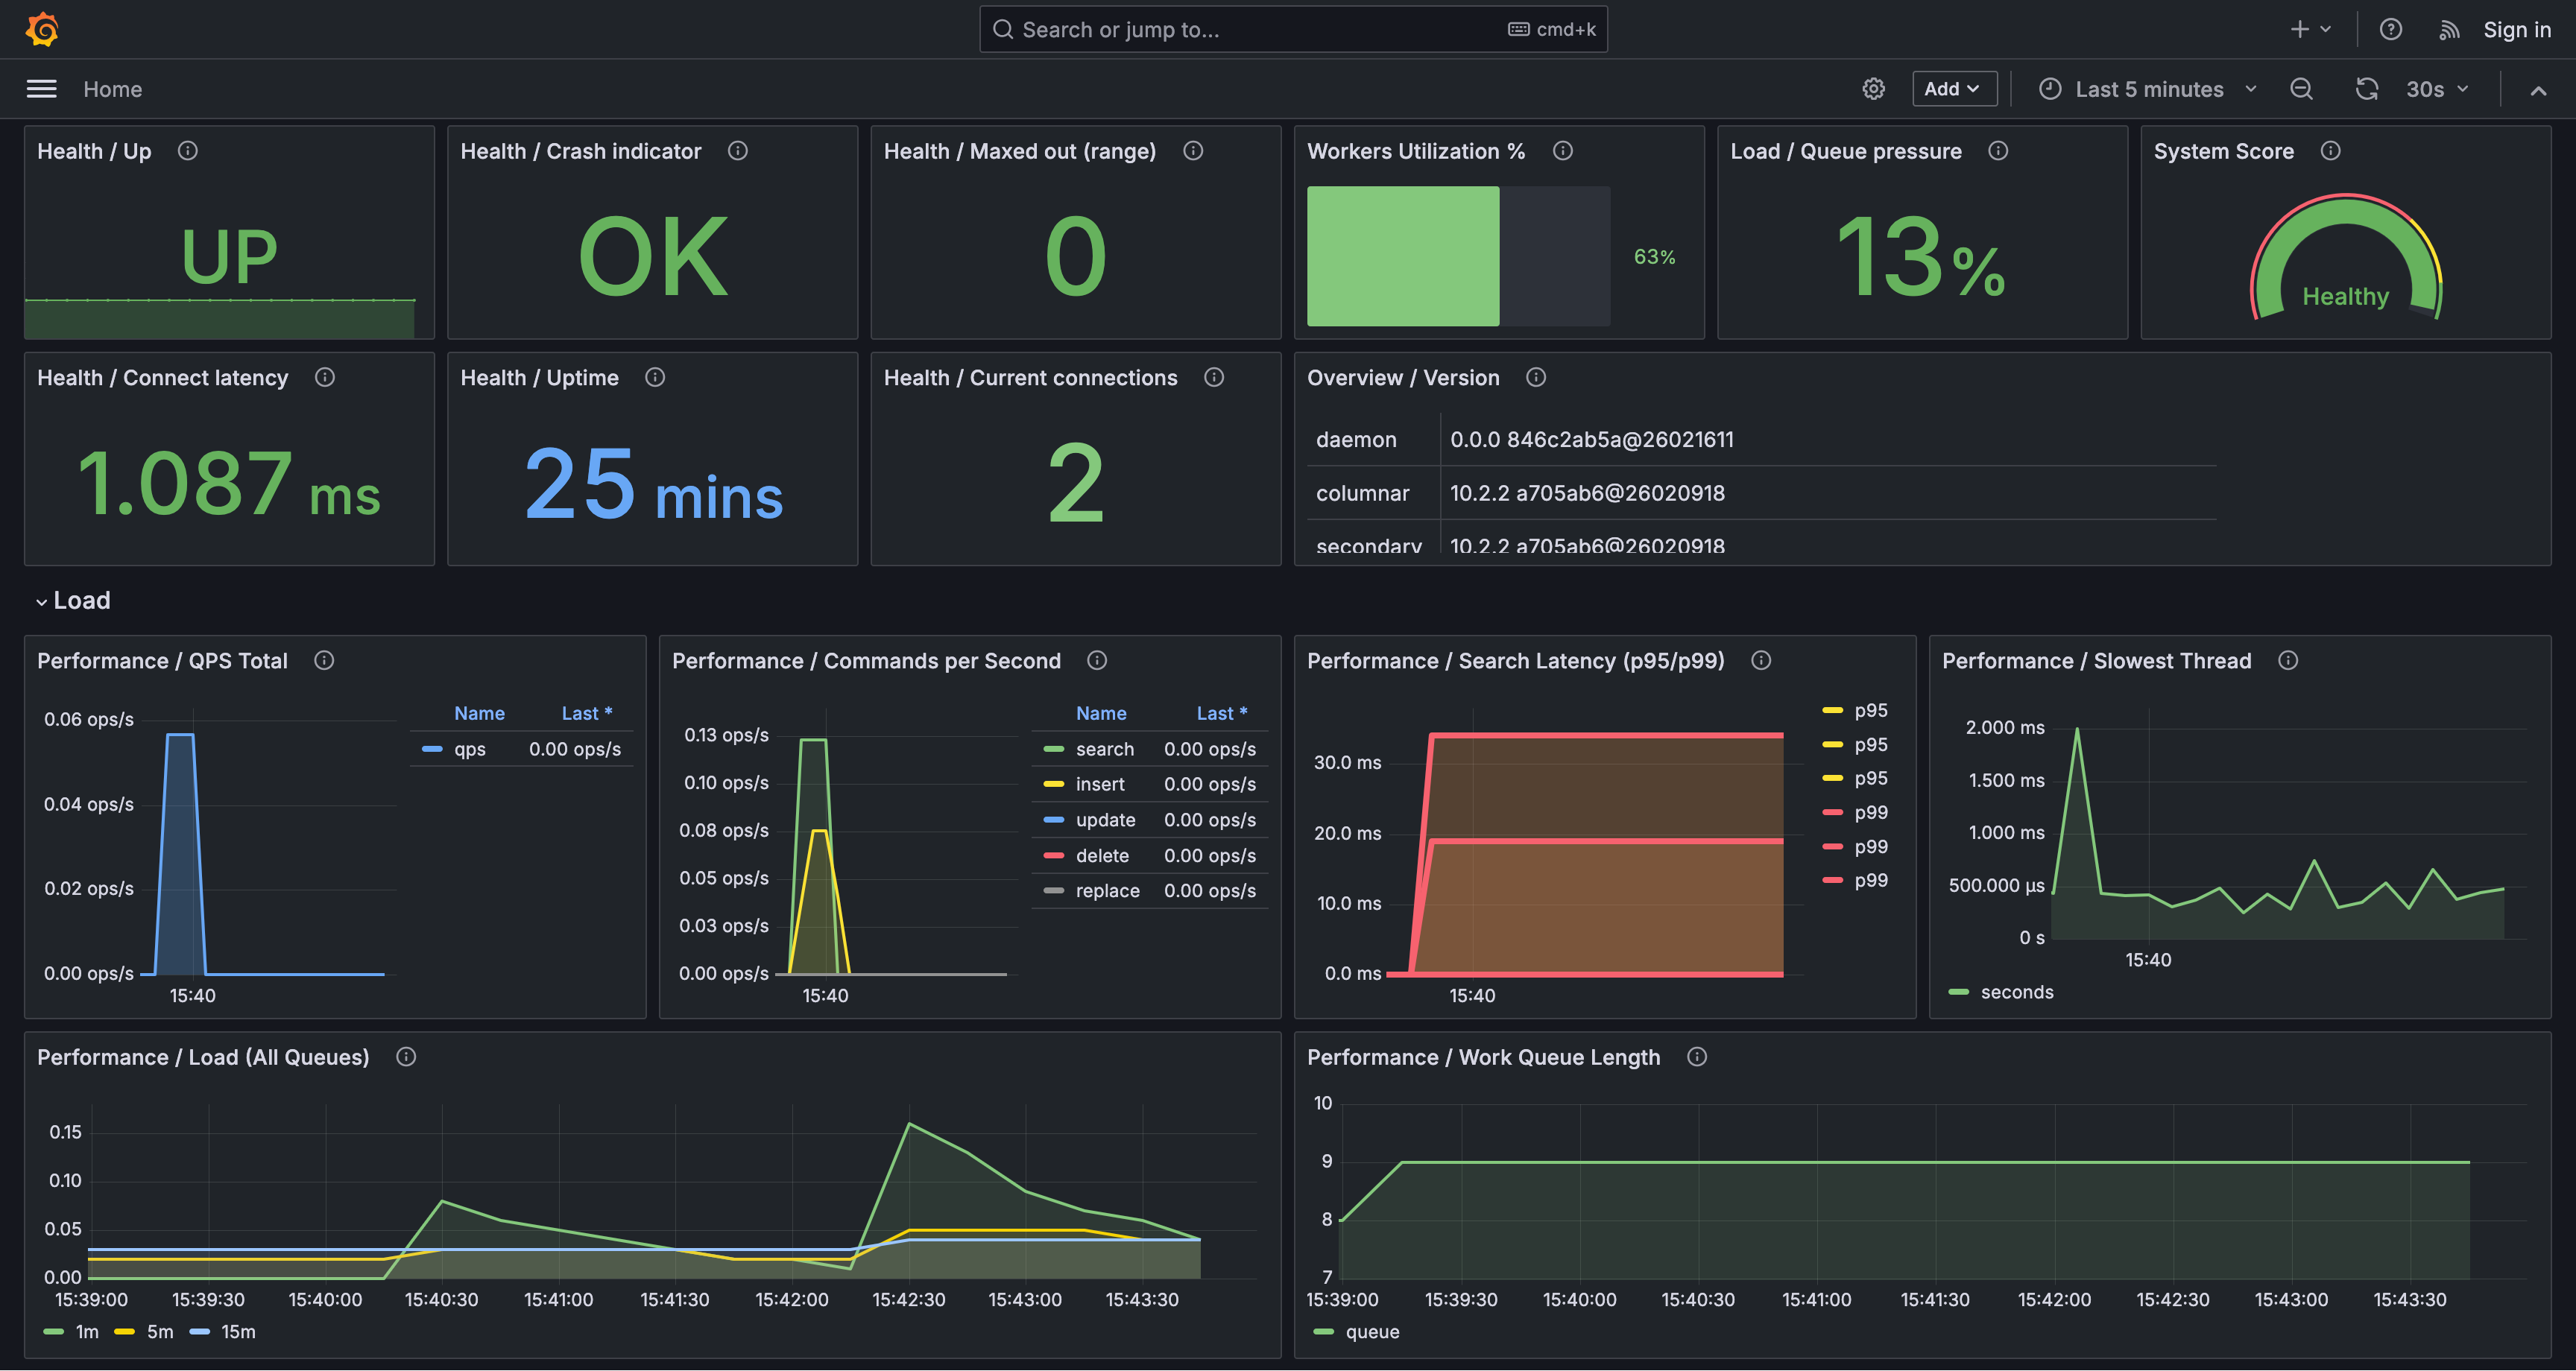
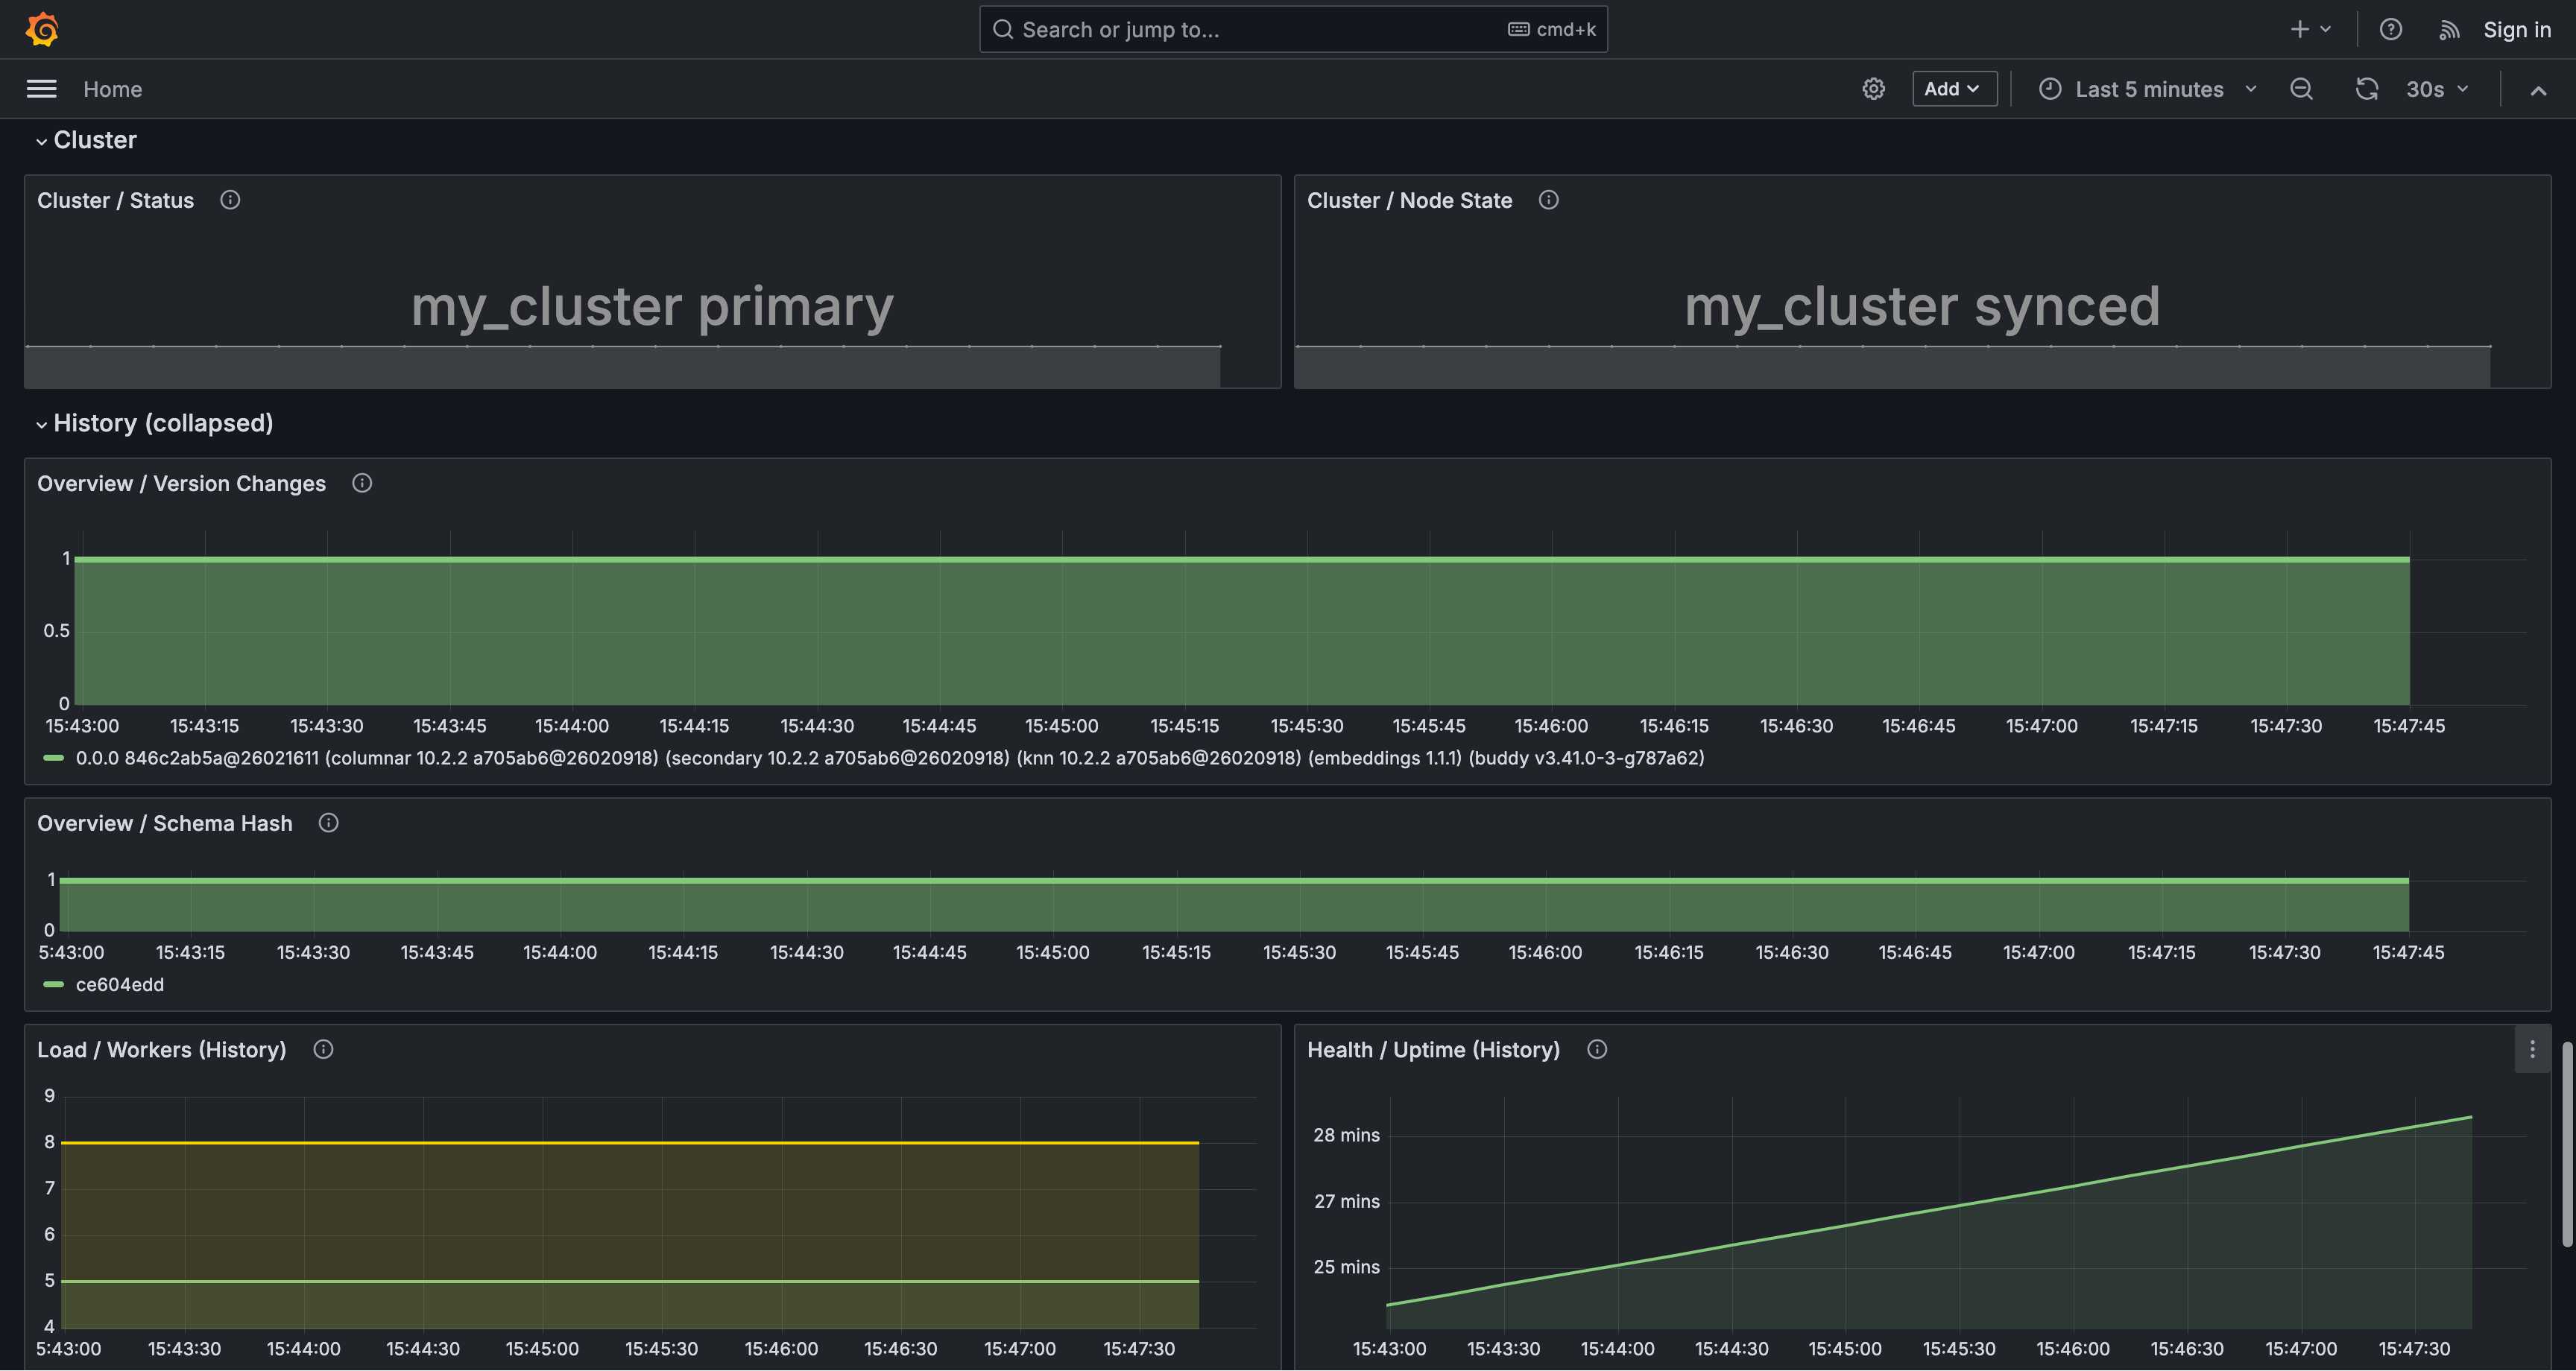
- instance health and uptime
- component versions
- current connections and connect latency
- QPS and command throughput
- search latency (p95/p99)
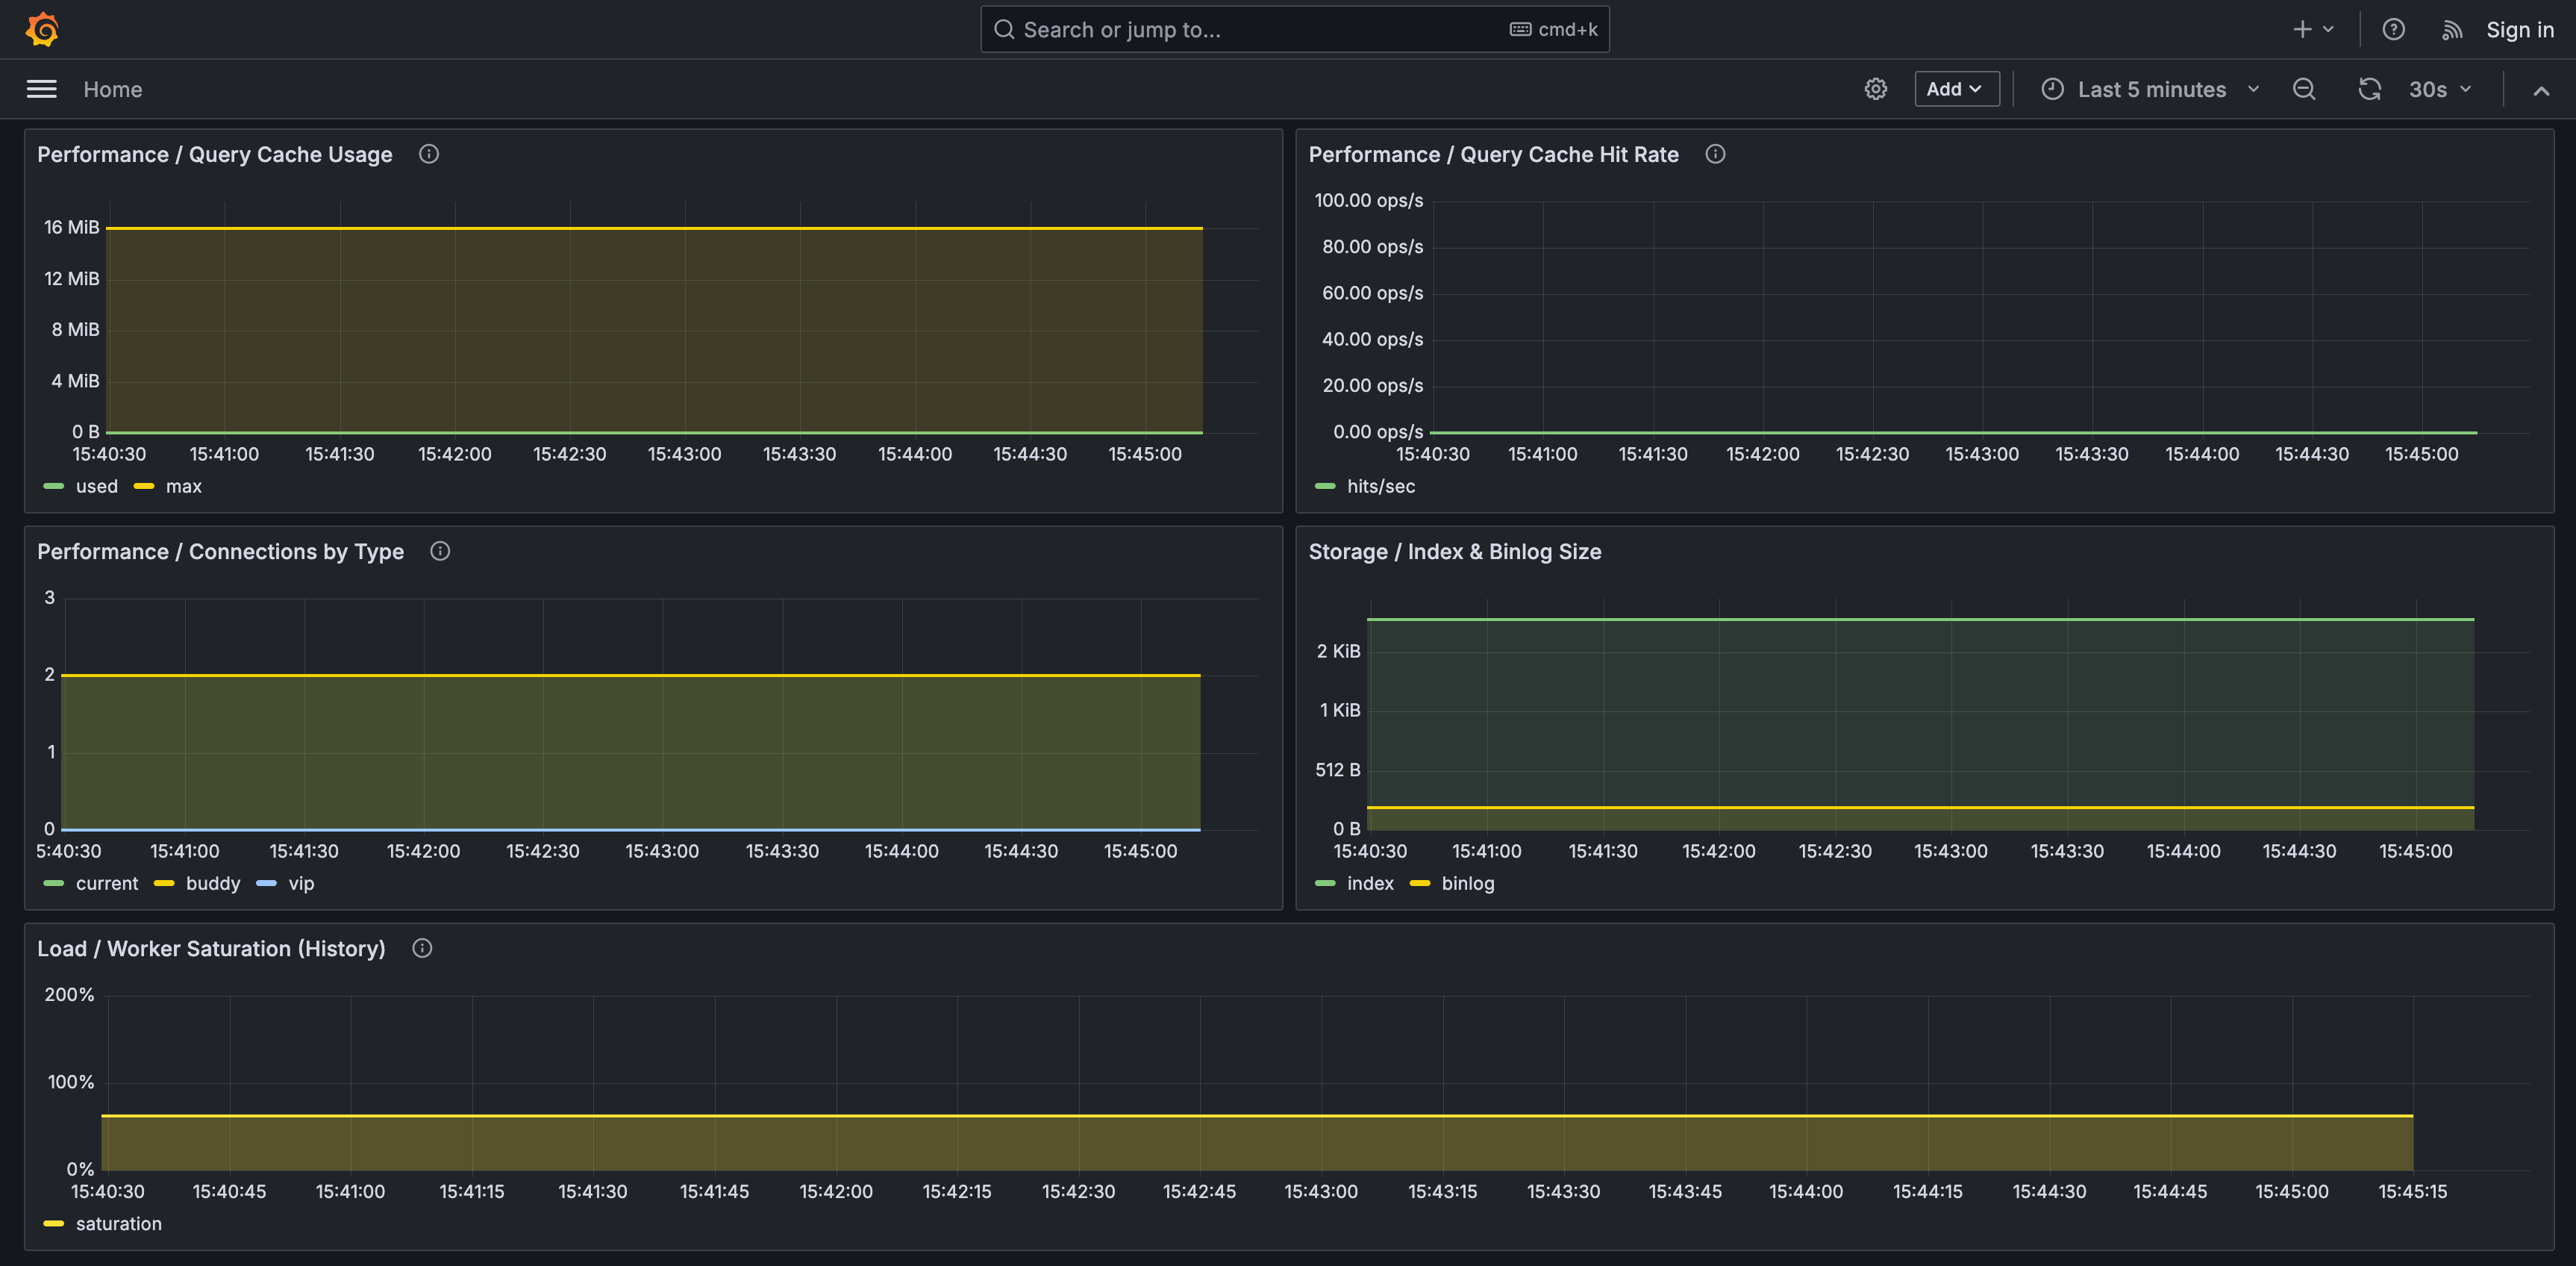
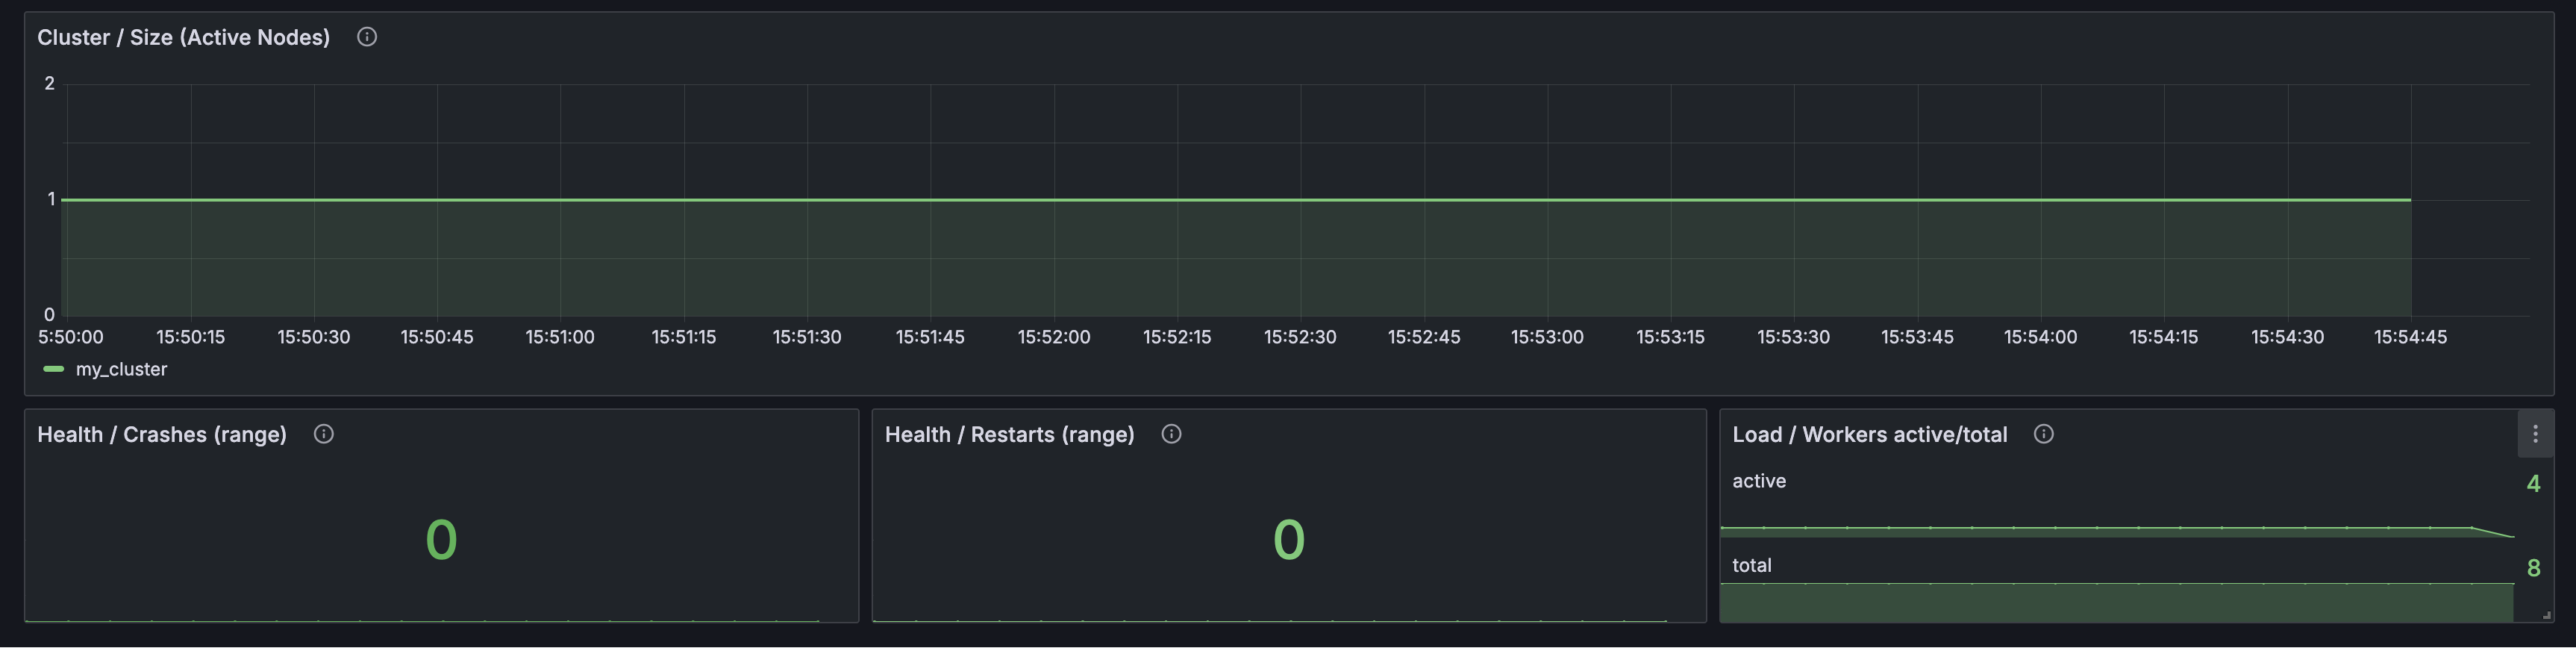
- worker utilization and queue pressure
- query cache usage and hit rate
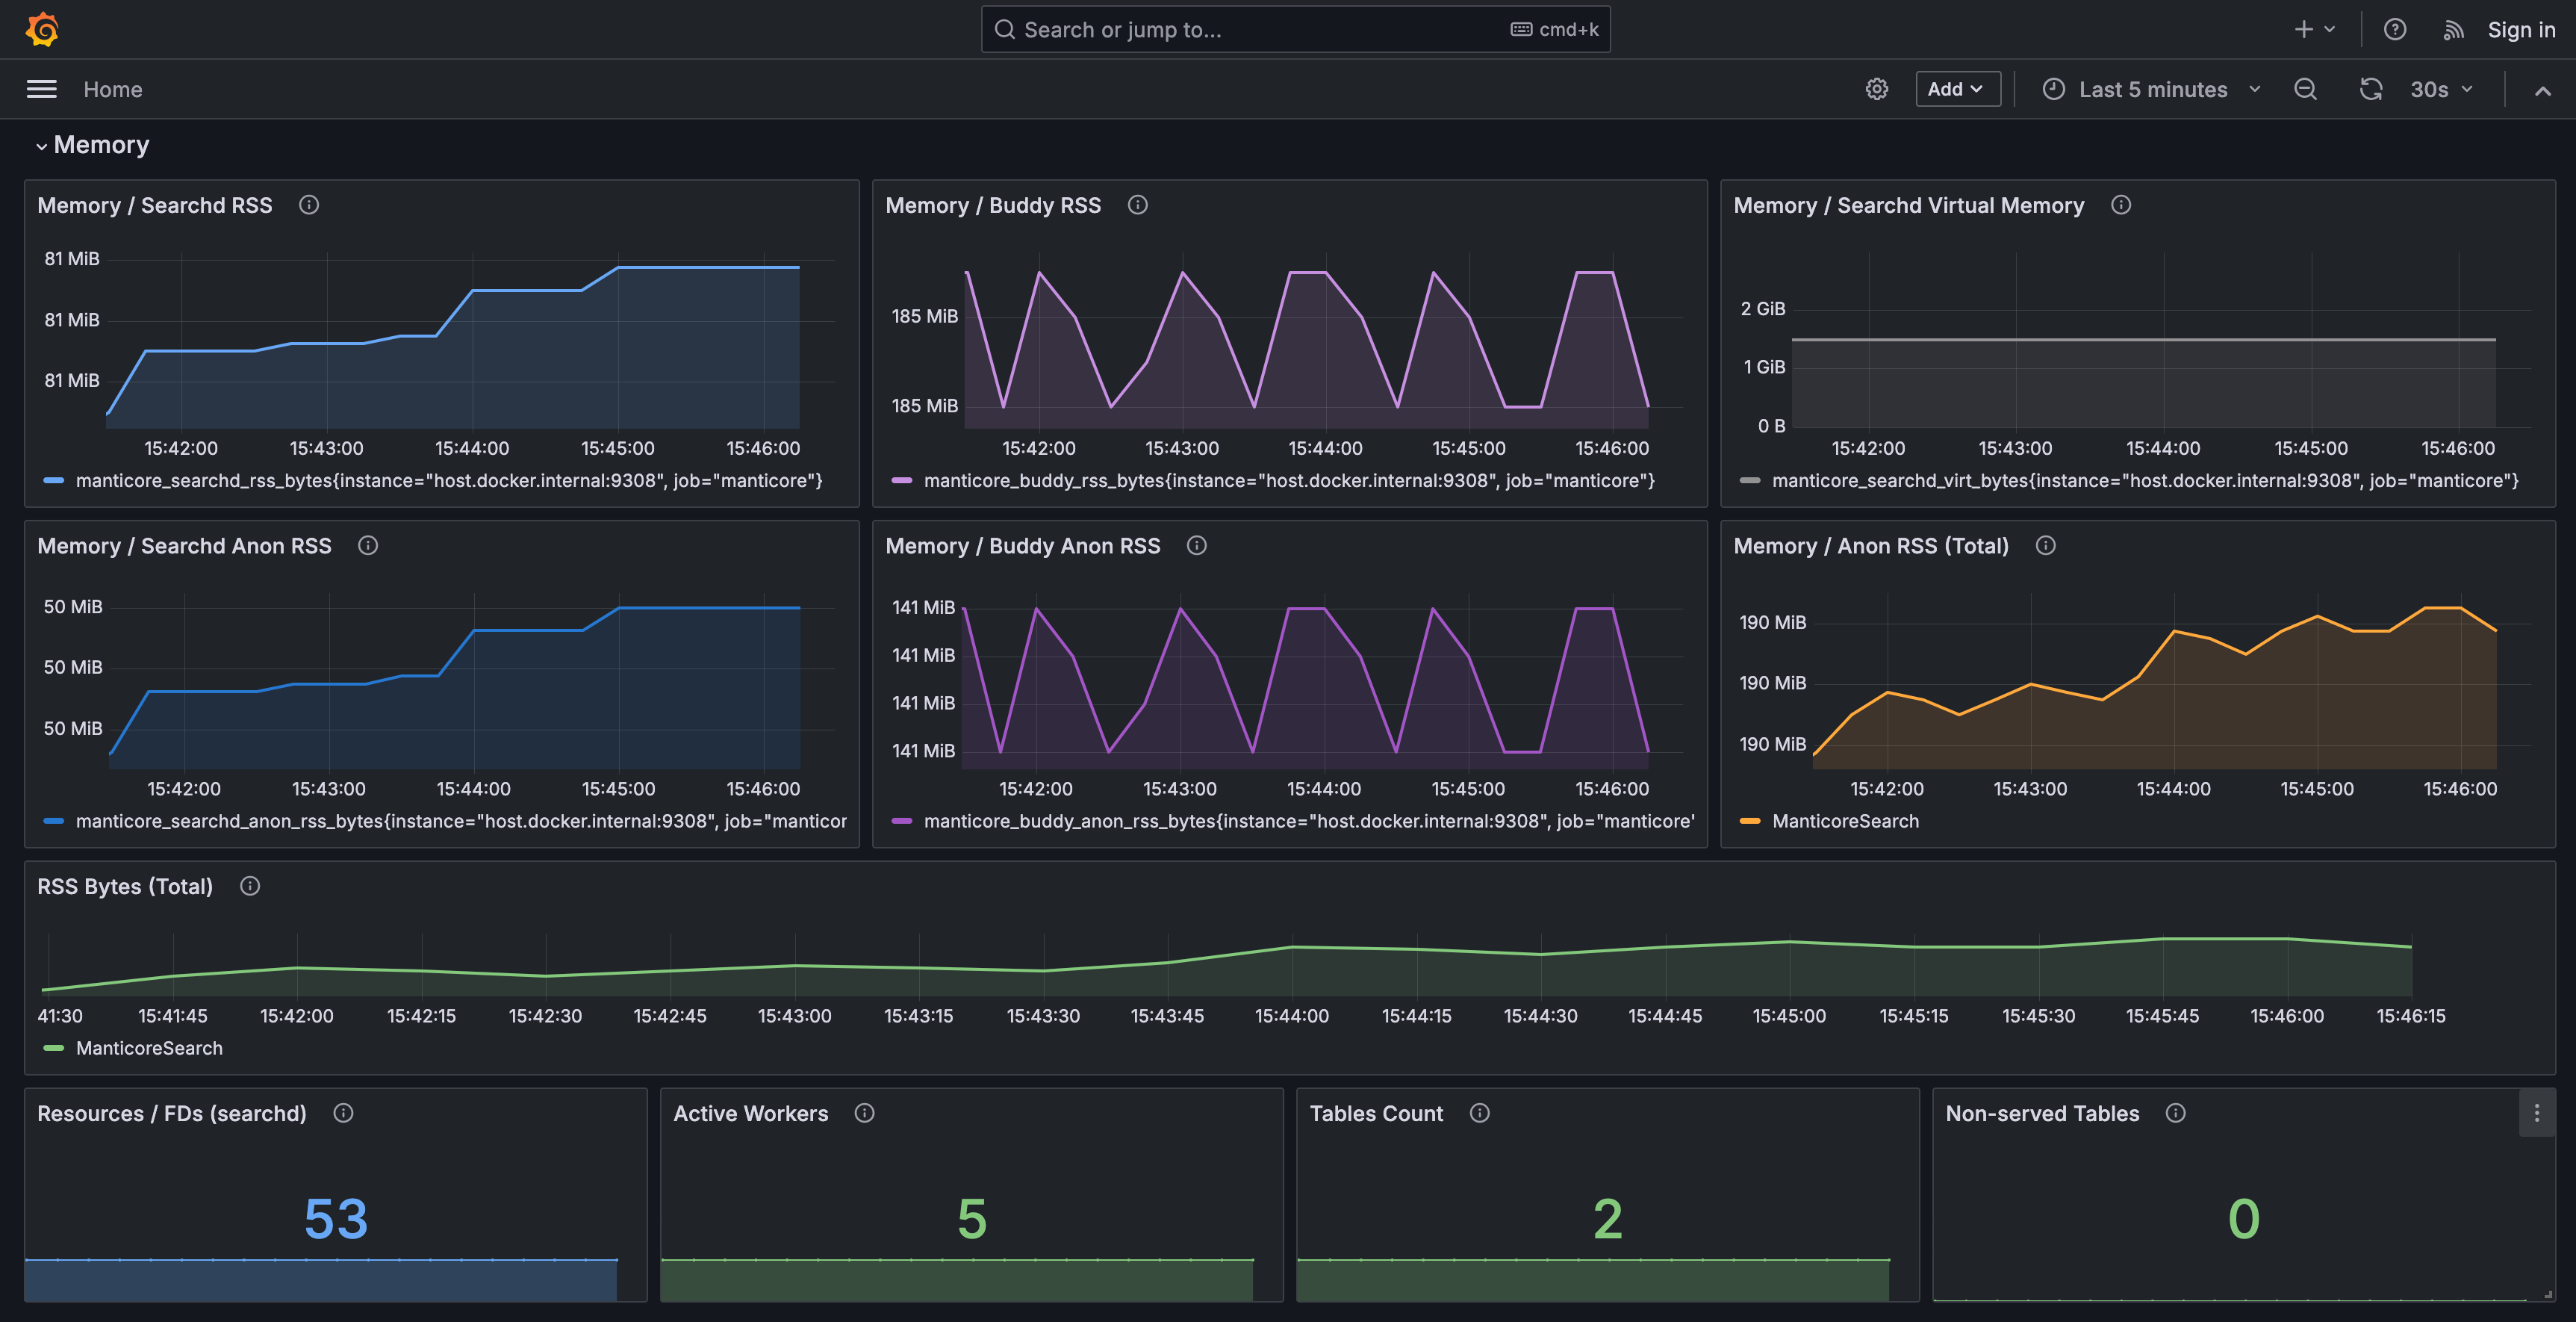
- memory usage for searchd and Buddy
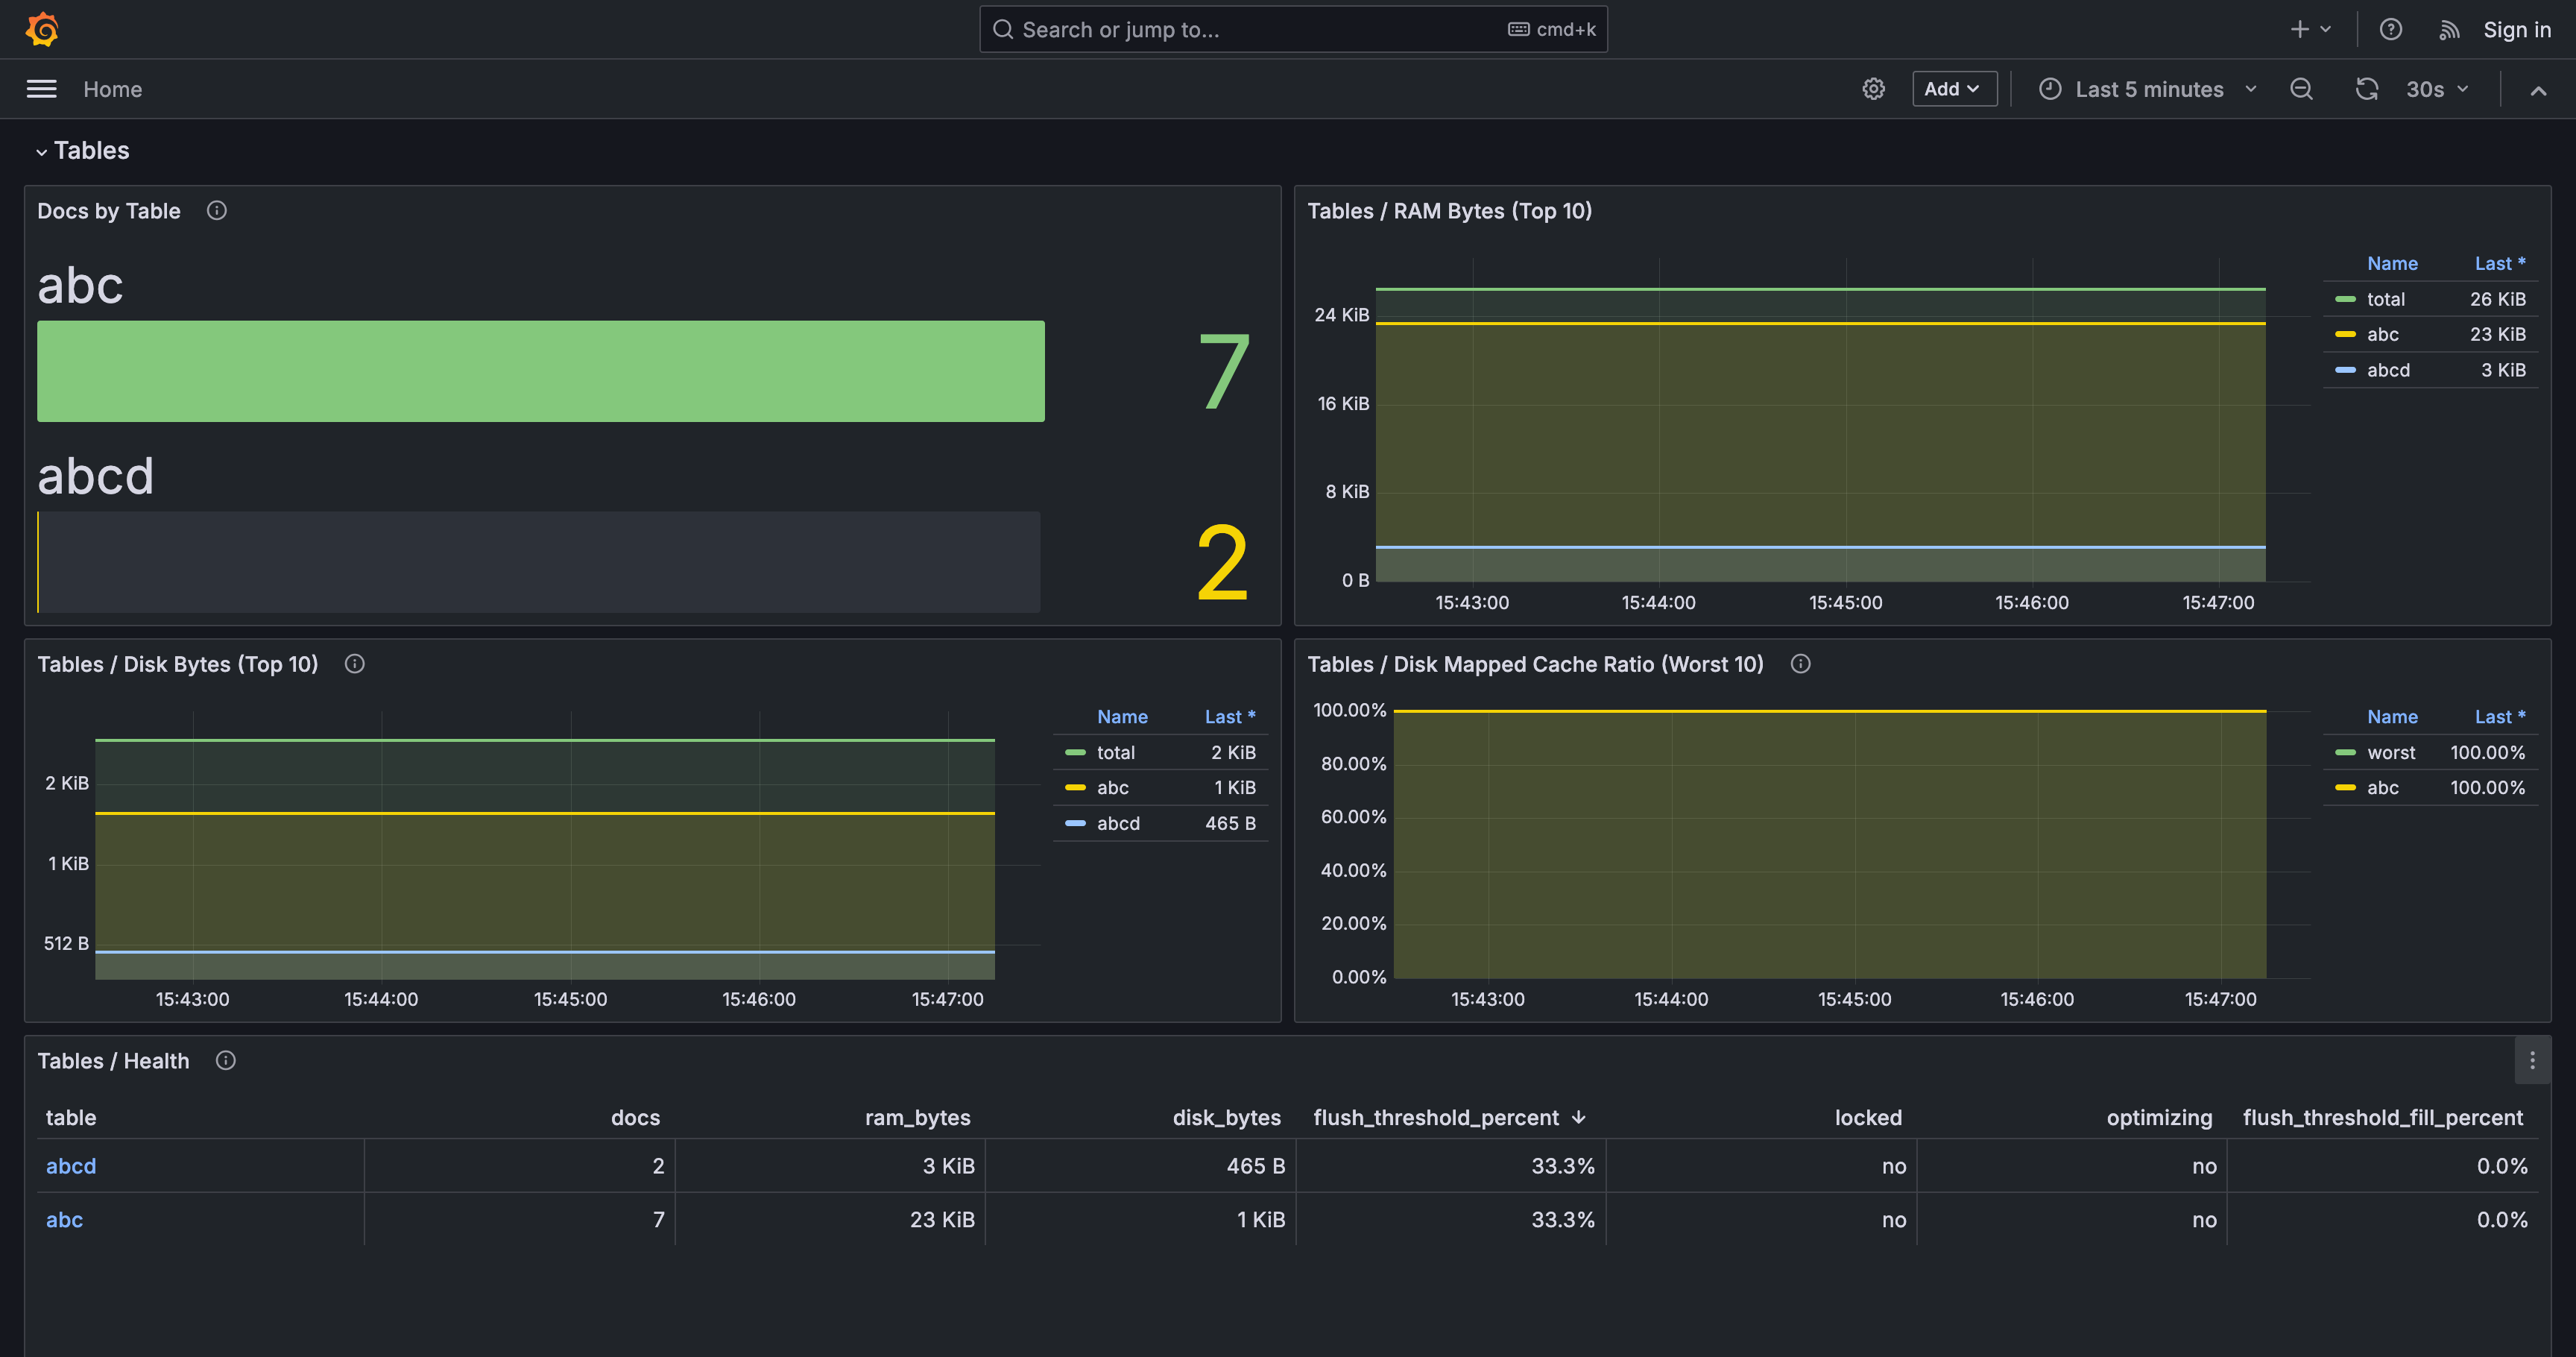
- table-level RAM, disk, and document counts
- cluster state and active node count
- crashes, restarts, and maxed-out conditions
Requirements
- Grafana
- Prometheus
- Manticore Search metrics enabled and scraped by Prometheus
Prometheus scrape target
Example:
scrape_configs:
- job_name: manticoresearch
static_configs:
- targets:
- localhost:9308
Variables
- datasource: Prometheus datasource
- job: Prometheus job label
- instance: Manticore instance label
- table: table filter
- cluster: cluster filter
Notes
The dashboard includes header links to Slack, Forum, and Support pages via template constants.
Designed for Manticore Search environments where Prometheus collects metrics from one or more instances.
Data source config
Collector type:
Collector plugins:
Collector config:
Revisions
Upload an updated version of an exported dashboard.json file from Grafana
| Revision | Description | Created | |
|---|---|---|---|
| Download |