Linkerd Data Plane
Grafana dashboard for monitoring Linkerd proxy sidecar metrics across meshed workloads. Covers HTTP traffic, TCP connections, HTTPRoute policy metrics, authorization decisions, and proxy resource usage.
Filters
Datasource — Prometheus instance to query.
Namespace — One or more namespaces containing meshed workloads. Filters the Workload and Pod dropdowns.
Workload — Deployment name within the selected namespace(s). Narrows the Pod list.
Pod — Individual meshed pod(s). Pod names follow {workload}-{replicaset-hash}-{pod-hash}.
Sections
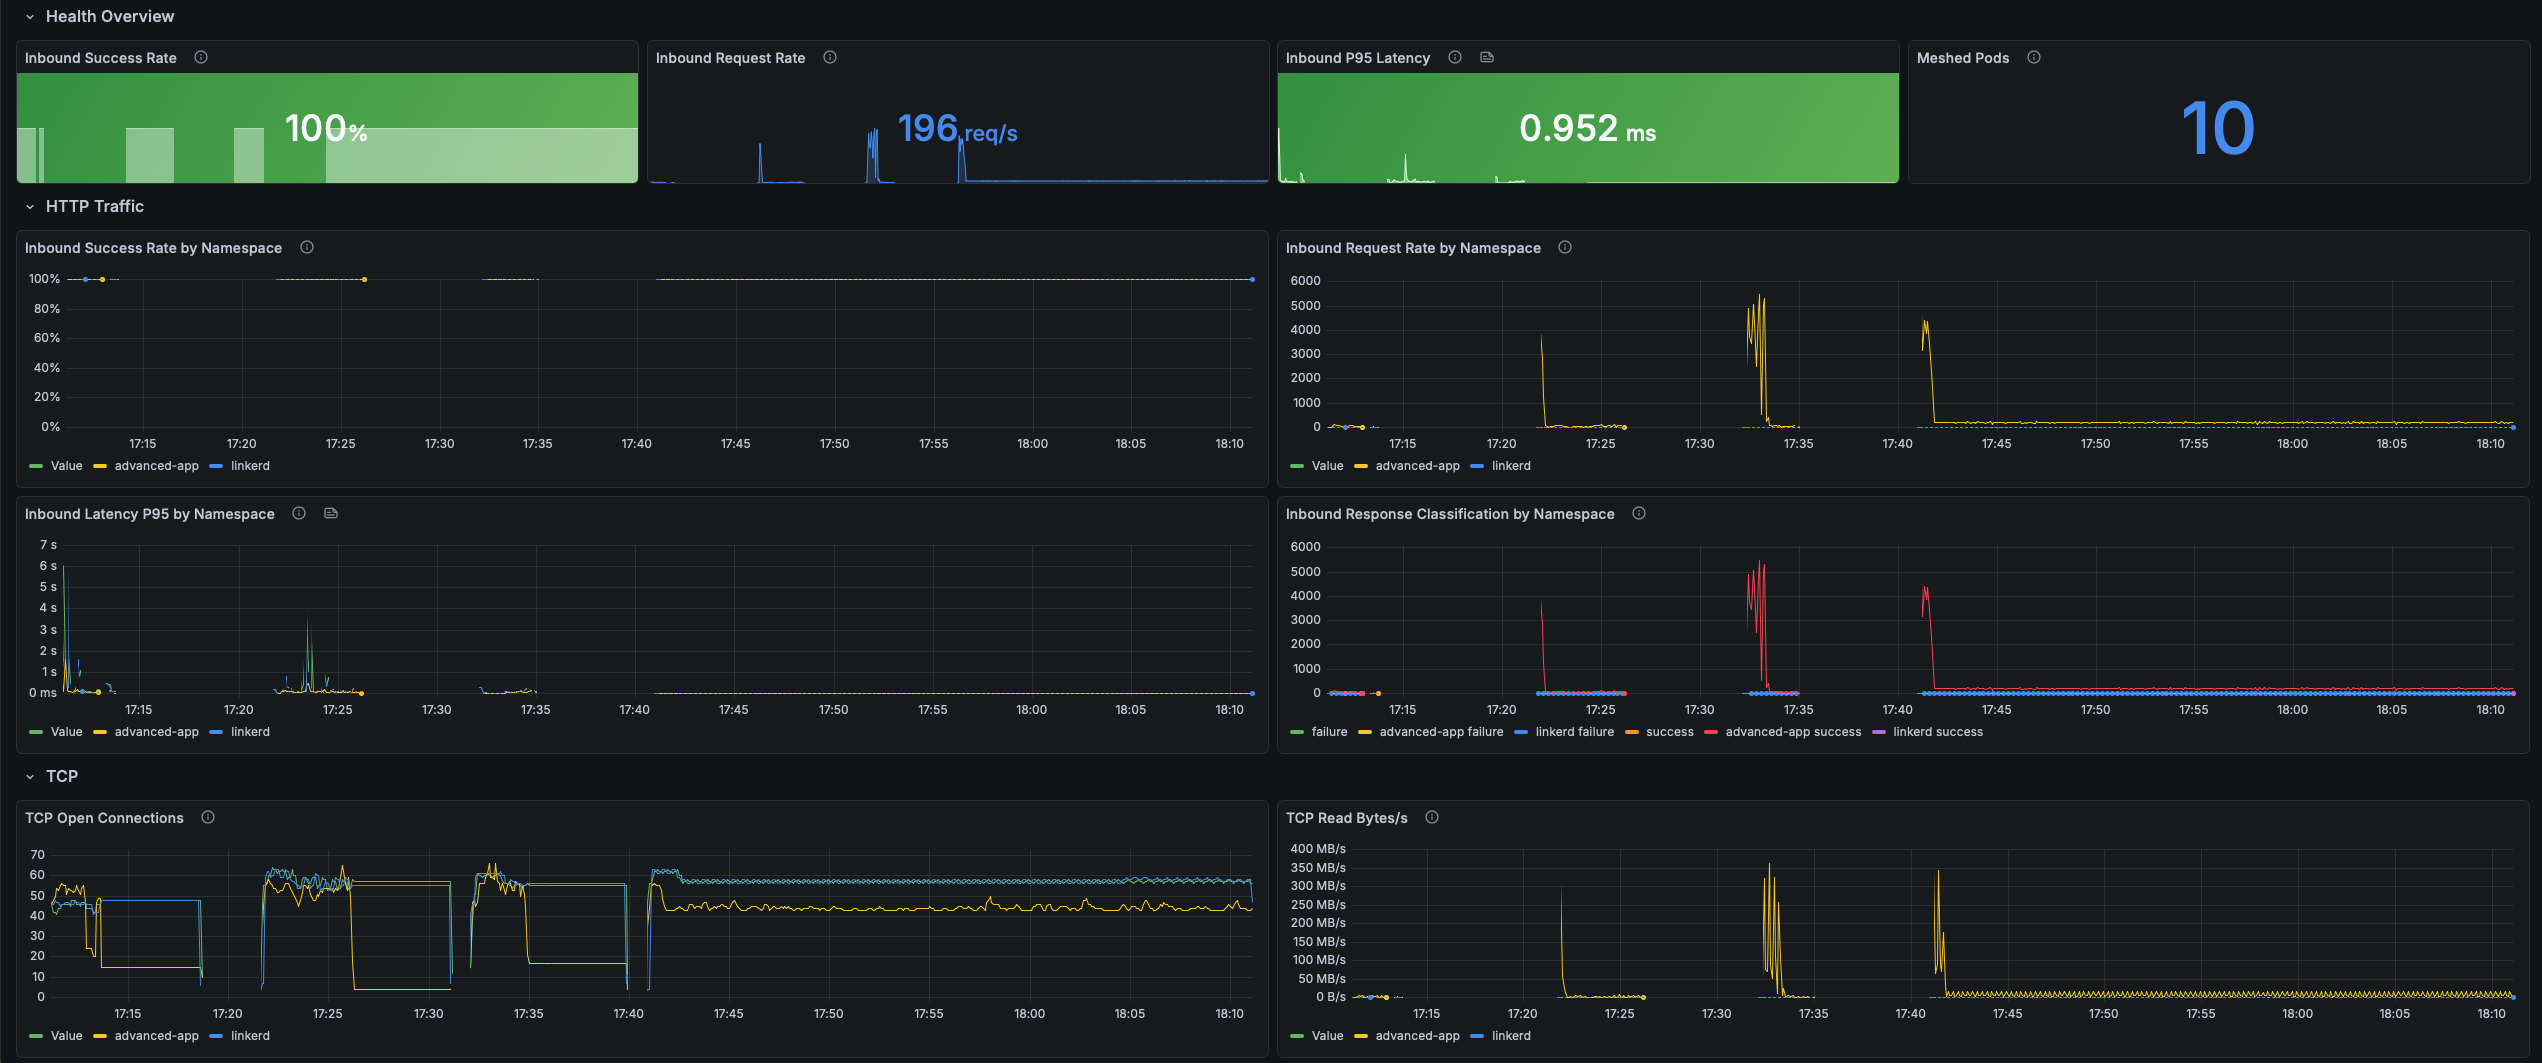
HTTP Traffic
Inbound HTTP/gRPC metrics recorded at the receiving proxy sidecar, independent of application instrumentation. Success rate and p95 latency are your primary SLI signals.
- Inbound Success Rate by Namespace — Ratio of successful to total inbound responses. Linkerd classifies 2xx/3xx as success, 5xx as failure, and 4xx as failure unless the route is retryable. A value below 1.0 warrants investigation.
- Inbound Request Rate by Namespace — Ground-truth throughput of all inbound requests, regardless of application outcome. Spikes may indicate traffic floods or retry storms; drops may indicate outages or upstream routing changes.
- Inbound Latency P95 by Namespace — 95th-percentile response latency in milliseconds at the receiving proxy, including application processing time. A rising p95 with a stable success rate points to application-level slowness.
- Inbound Response Classification by Namespace — Total inbound response rate split by success/failure classification. A widening failure band is the primary signal to investigate even when p95 latency looks healthy.
TCP
Protocol-agnostic connection and throughput metrics for all TCP traffic through the proxy. The primary signal for non-HTTP workloads such as databases, message queues, and gRPC streaming.
- TCP Open Connections — Real-time count of open TCP connections per namespace. A spike may indicate a connection leak; a sustained drop to zero means no traffic is flowing.
- TCP Read Bytes/s — Bytes per second read from the network by the proxy sidecar. High read throughput with a low success rate may indicate connection flooding or large payloads to a failing service.
- TCP Write Bytes/s — Bytes per second written back to callers. Asymmetry between read and write throughput reveals traffic patterns (uploads vs. downloads, streaming responses).
- TCP Open / Close Rate — Connection establishment and teardown rate per second. A high open rate with a low close rate indicates connection accumulation; high close with low open indicates rapid reconnect churn.
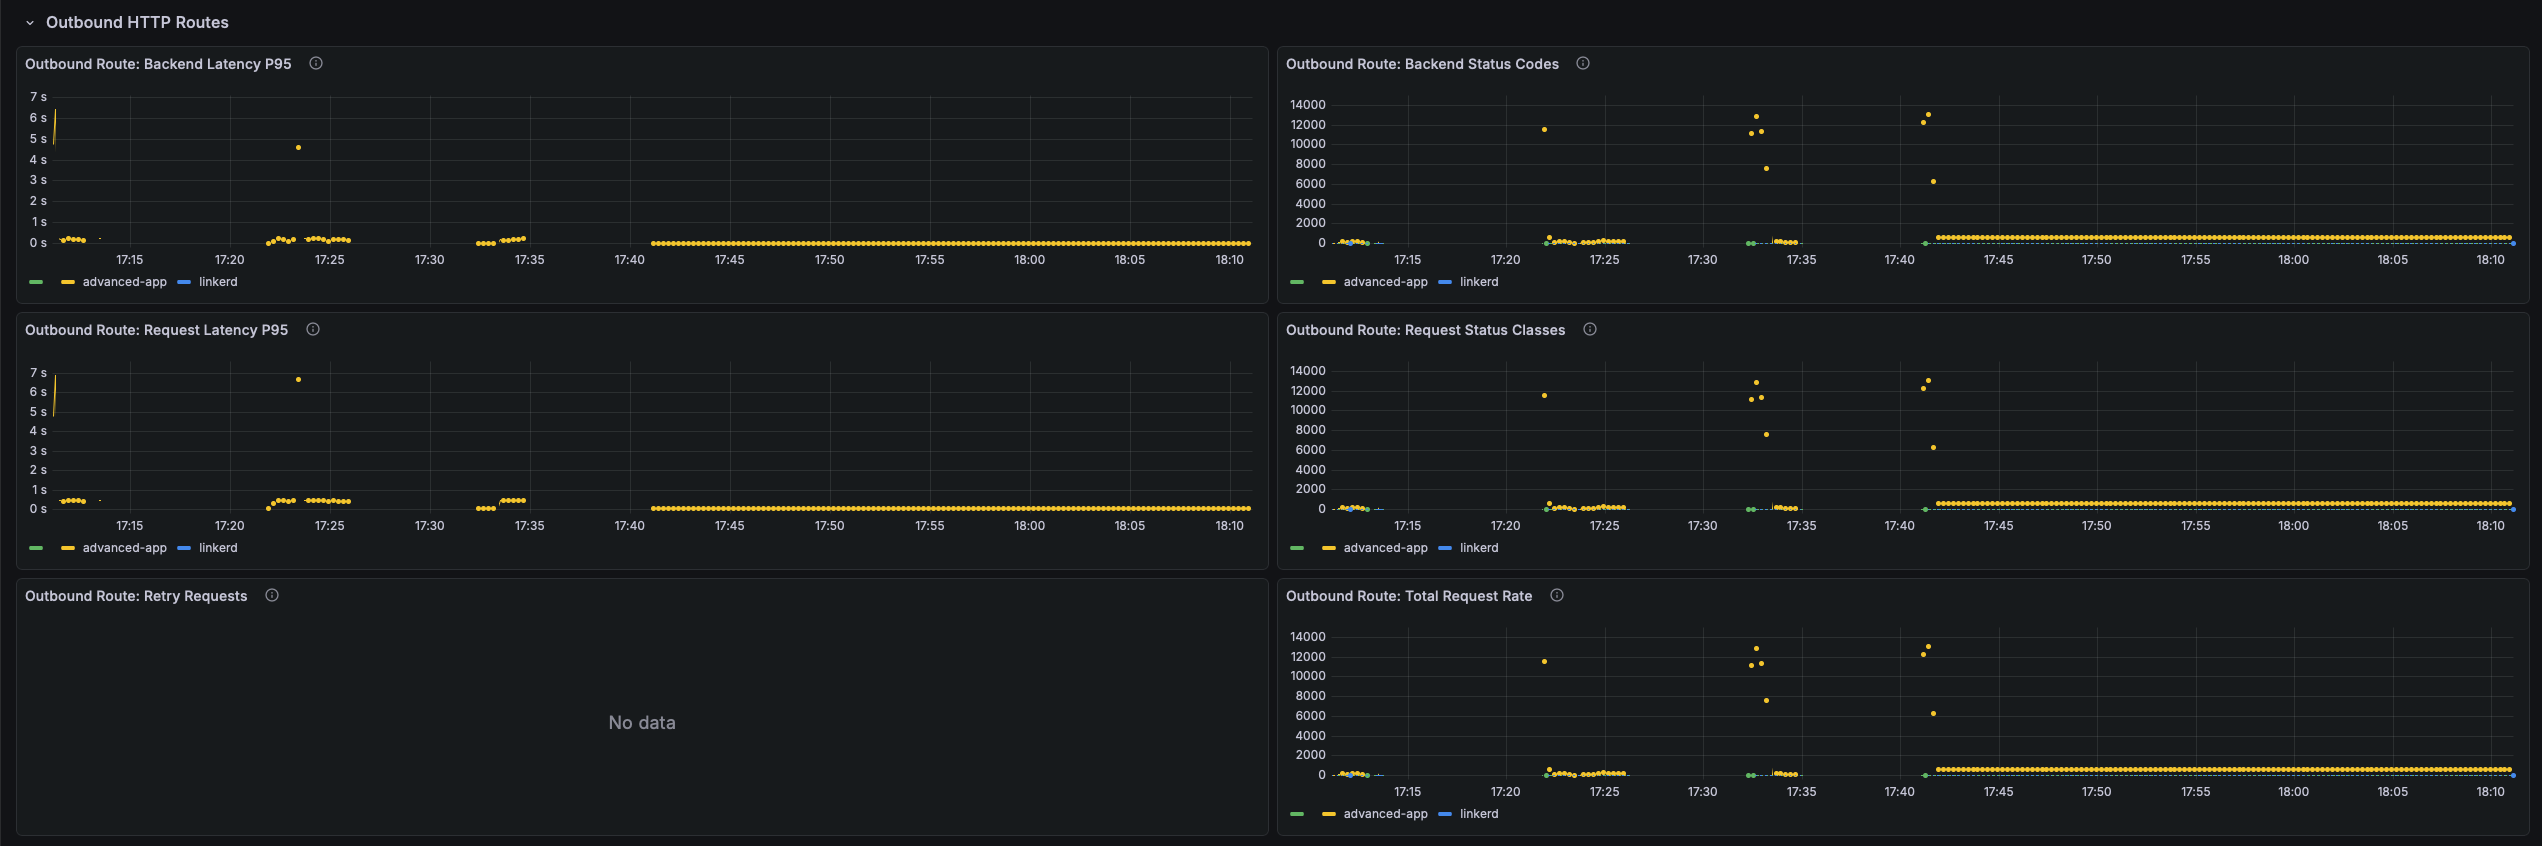
Outbound HTTP Routes
Per-route and per-backend metrics for outbound HTTP traffic governed by Linkerd HTTPRoute policy. Populated only when HTTPRoute objects with Linkerd policy are present.
- Outbound Route: Backend Latency P95 — p95 response duration (seconds) per backend as seen by the outbound proxy. A large spread across backends signals imbalanced load or a degraded replica.
- Outbound Route: Backend Status Codes — Response status codes per backend per second. 503s often indicate Kubernetes readiness probe failures routing traffic to unready pods.
- Outbound Route: Request Latency P95 — p95 end-to-end request duration at the route level, including retries. A gap between this and backend latency indicates retries are inflating caller-observed latency.
- Outbound Route: Request Status Classes — Success/failure classification at the route level after all retries. This is the route-level SLI.
- Outbound Route: Retry Requests — Rate of requests retried by the proxy due to retry policies. Retries multiply actual backend load; a spike means backends are failing frequently and consuming the retry budget.
- Outbound Route: Total Request Rate — Total outbound request rate at the route level. Compare with backend rate to measure retry amplification (e.g., 100 route rps → 250 backend rps = ~2.5× retry factor).
Inbound HTTP Routes
Per-route inbound metrics for namespaces with Linkerd inbound HTTPRoute policies applied. Enables per-endpoint SLO tracking rather than service-wide aggregates.
- Inbound Route: Request Status Classes — Success/failure classification per inbound HTTPRoute. A single route with a high failure rate while others are healthy isolates the issue to that handler or its downstream dependency.
- Inbound Route: Request Latency P95 — p95 request duration (seconds) per inbound HTTPRoute. Identifies slow endpoints that would be masked by a service-wide aggregate.
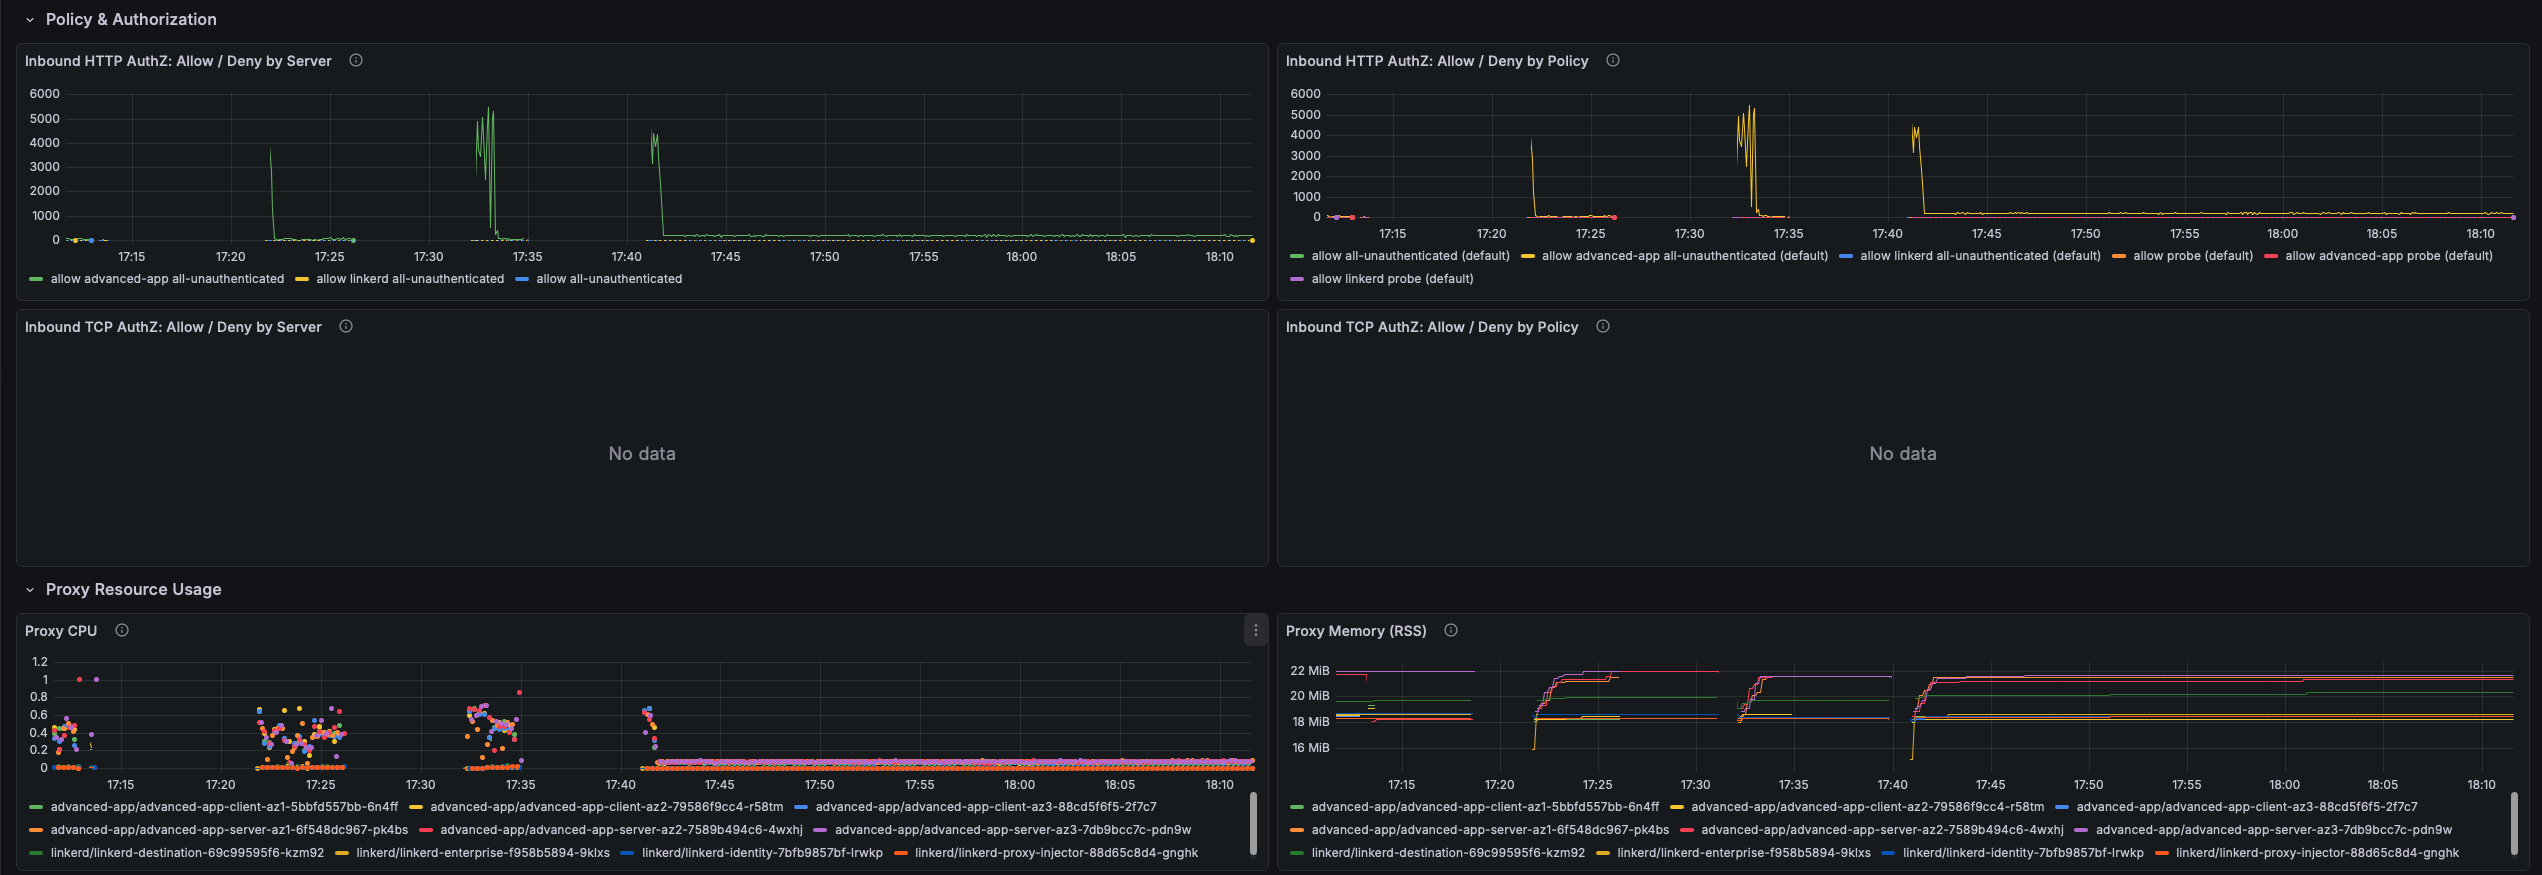
Policy & Authorization
Authorization allow/deny metrics from Linkerd Server and AuthorizationPolicy resources. Denials happen silently at the proxy before the request reaches the application, leaving no application-level error log.
- Inbound HTTP AuthZ: Allow / Deny by Server — Allow and deny rate per Linkerd Server resource. A non-zero deny rate means requests are being dropped before the application sees them.
- Inbound HTTP AuthZ: Allow / Deny by Policy — Authorization decisions broken down per AuthorizationPolicy. Identifies exactly which policy is allowing or denying traffic when multiple policies apply to the same Server.
- Inbound TCP AuthZ: Allow / Deny by Server — TCP connection allow/deny rate per Server. A denied TCP connection results in an immediate connection reset visible to the client as connection refused.
- Inbound TCP AuthZ: Allow / Deny by Policy — TCP authorization decisions per AuthorizationPolicy. Use this when unexplained connection errors appear for non-HTTP services and application logs show nothing.
Proxy Resource Usage
CPU, memory, and runtime metrics for linkerd-proxy sidecar containers. The proxy is designed to use less than 0.1 CPU cores and 20–30 MB RSS under normal load. Elevated usage warrants investigation since the proxy shares the pod's resource quota with the application.
- Proxy CPU — CPU cores consumed per pod. Sustained usage above 0.5 cores indicates saturation, causing latency increases as the proxy falls behind on packet processing and TLS operations.
- Proxy Memory (RSS) — Resident set size in bytes per pod. RSS above 100 MB is unusual; unbounded growth may indicate a memory leak or an oversized routing table.
- Proxy Goroutines — Go goroutine count for processes sharing the proxy scrape target. Monotonically increasing goroutine count indicates leaks leading to eventual OOMKill.
- Proxy Heap In-Use — Active Go heap bytes per pod. If heap in-use approaches RSS, the process has little headroom. A rising heap with stable goroutines suggests data accumulation rather than goroutine leaks.
Installation
Import linkerd-data-plane.json into Grafana and select your Prometheus datasource when prompted.
Data source config
Collector config:
Upload an updated version of an exported dashboard.json file from Grafana
| Revision | Description | Created | |
|---|---|---|---|
| Download |