Linkerd Control Plane
Comprehensive observability dashboard for the Linkerd service mesh control plane. Provides a top-to-bottom view of control plane health — from a single-glance health summary at the top, through internal gRPC and HTTP traffic, endpoint discovery, certificate lifecycle, Kubernetes informer latency, Go runtime resource usage, and Buoyant Enterprise–specific features including external workload autoregistration, controller work queues, and the license controller. Use this dashboard as your primary diagnostic tool whenever the control plane behaves unexpectedly: proxies returning errors, endpoint routing going stale, certificates failing to rotate, or a rollout causing unexpected restarts.
Template Variables
datasource— Prometheus datasourcecontrol_ns— Control plane namespacepod— Pod filter (multi-select)
Sections
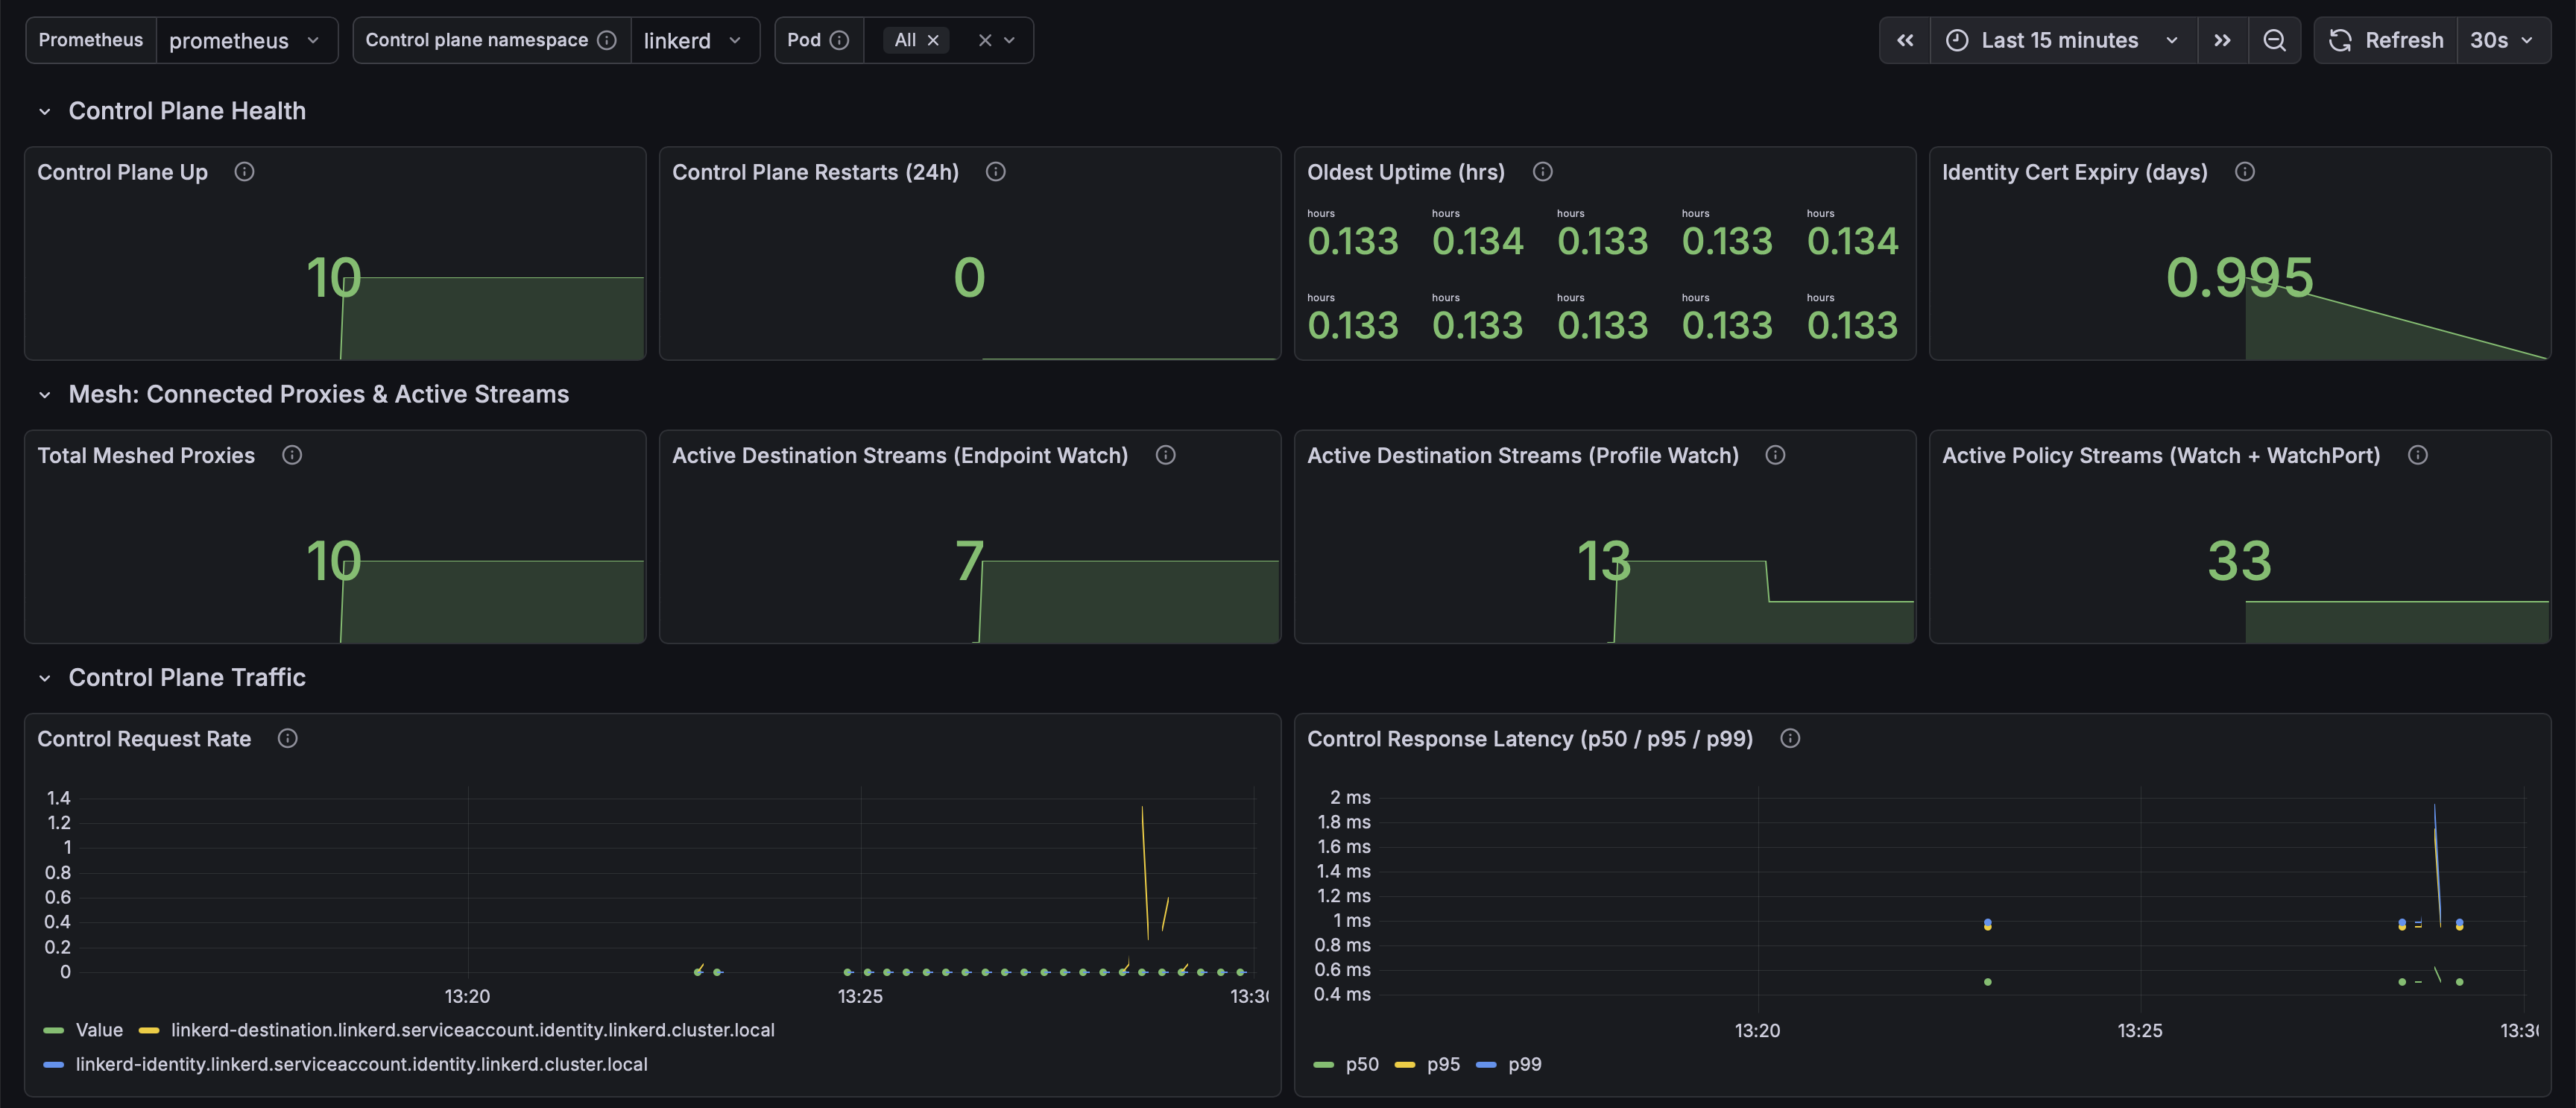
Control Plane Health — up targets, restarts (24h), oldest uptime, cert expiry days
Mesh: Connected Proxies & Streams — meshed proxy count, active Destination (Get, GetProfile) and Policy (Watch, WatchPort) streams
Control Plane Traffic — request rate and latency (p50/p95/p99) to destination and proxy-injector
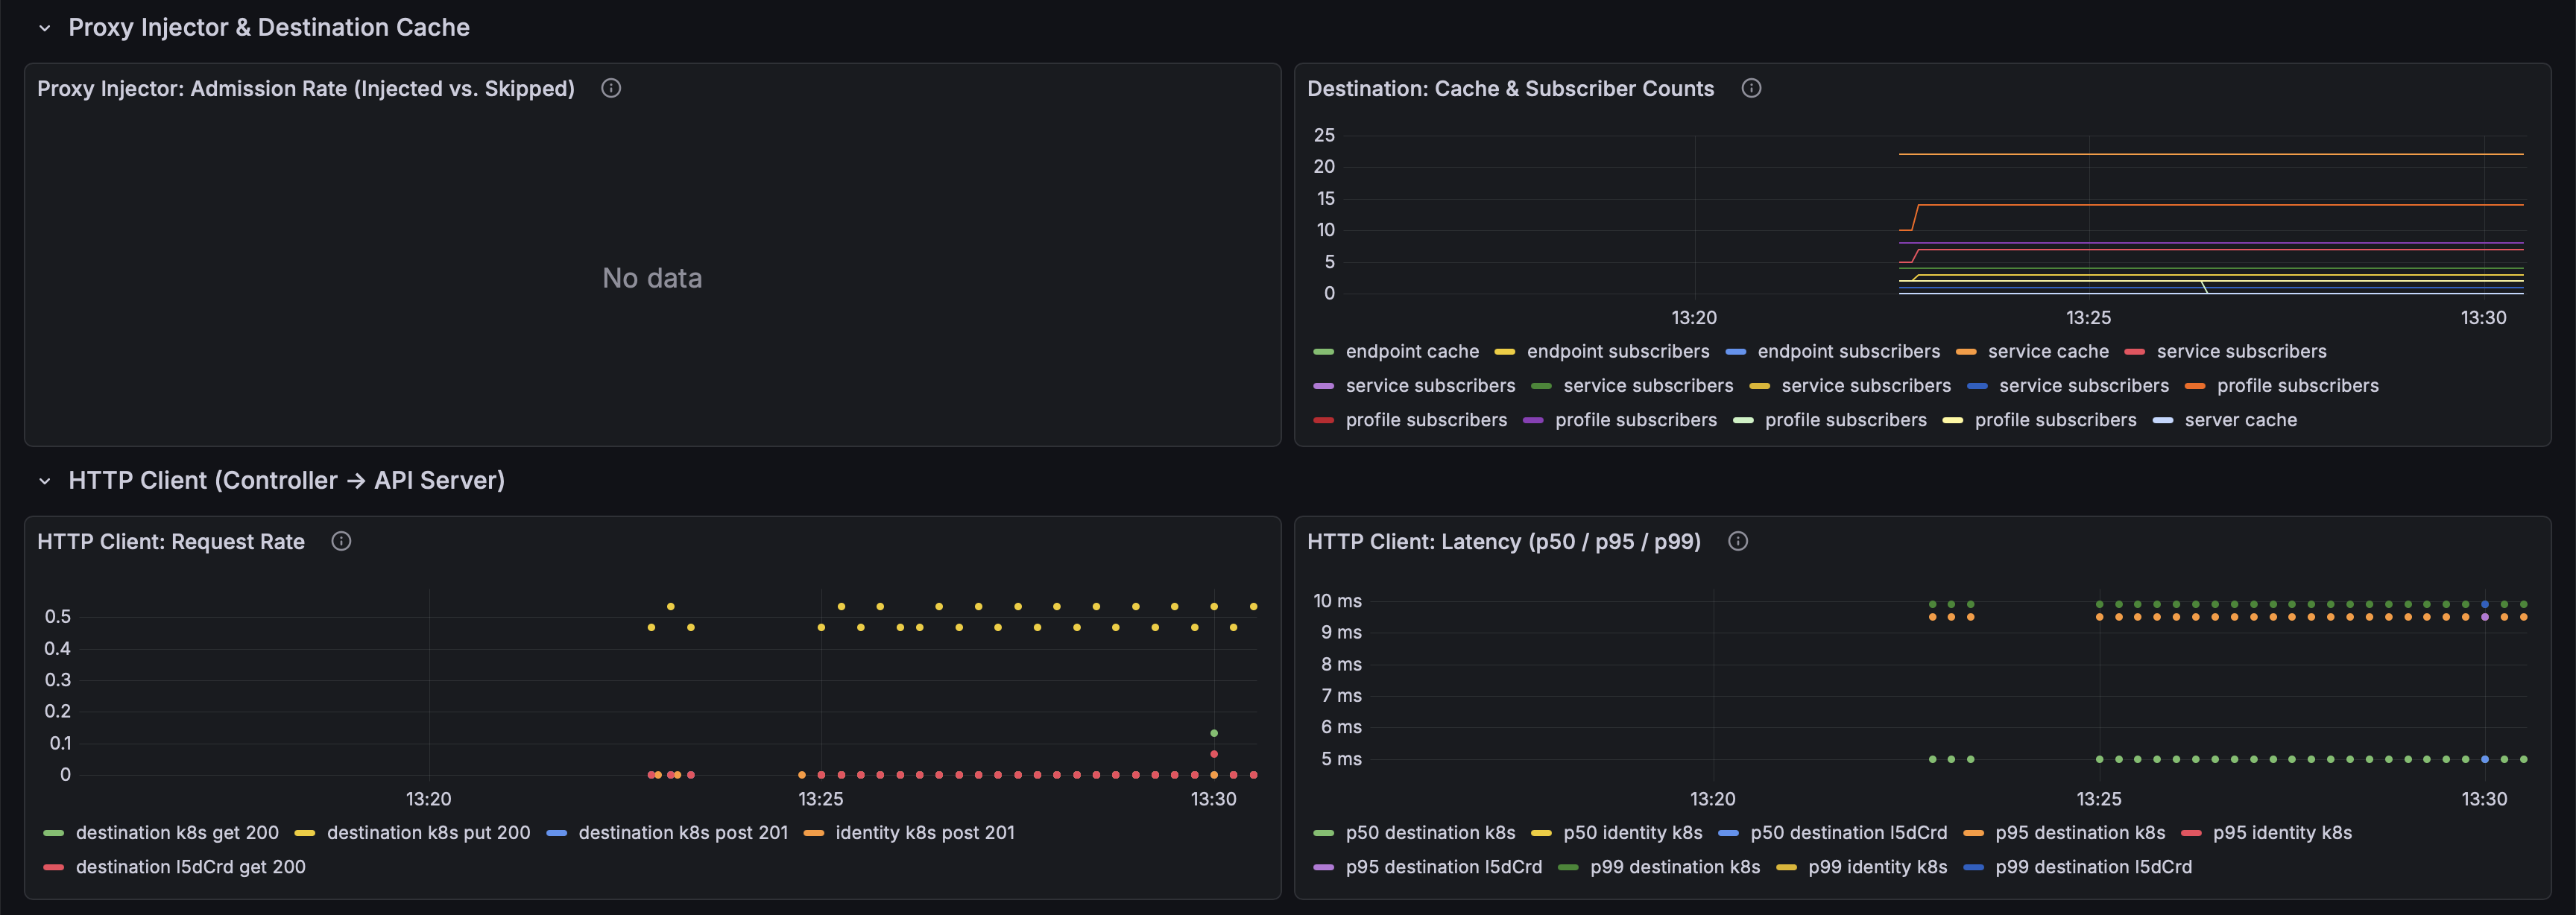
Proxy Injector & Destination Cache — admission rate by namespace, cache/subscriber object counts
HTTP Client (Controller → API Server) — request rate and latency by component/method/code
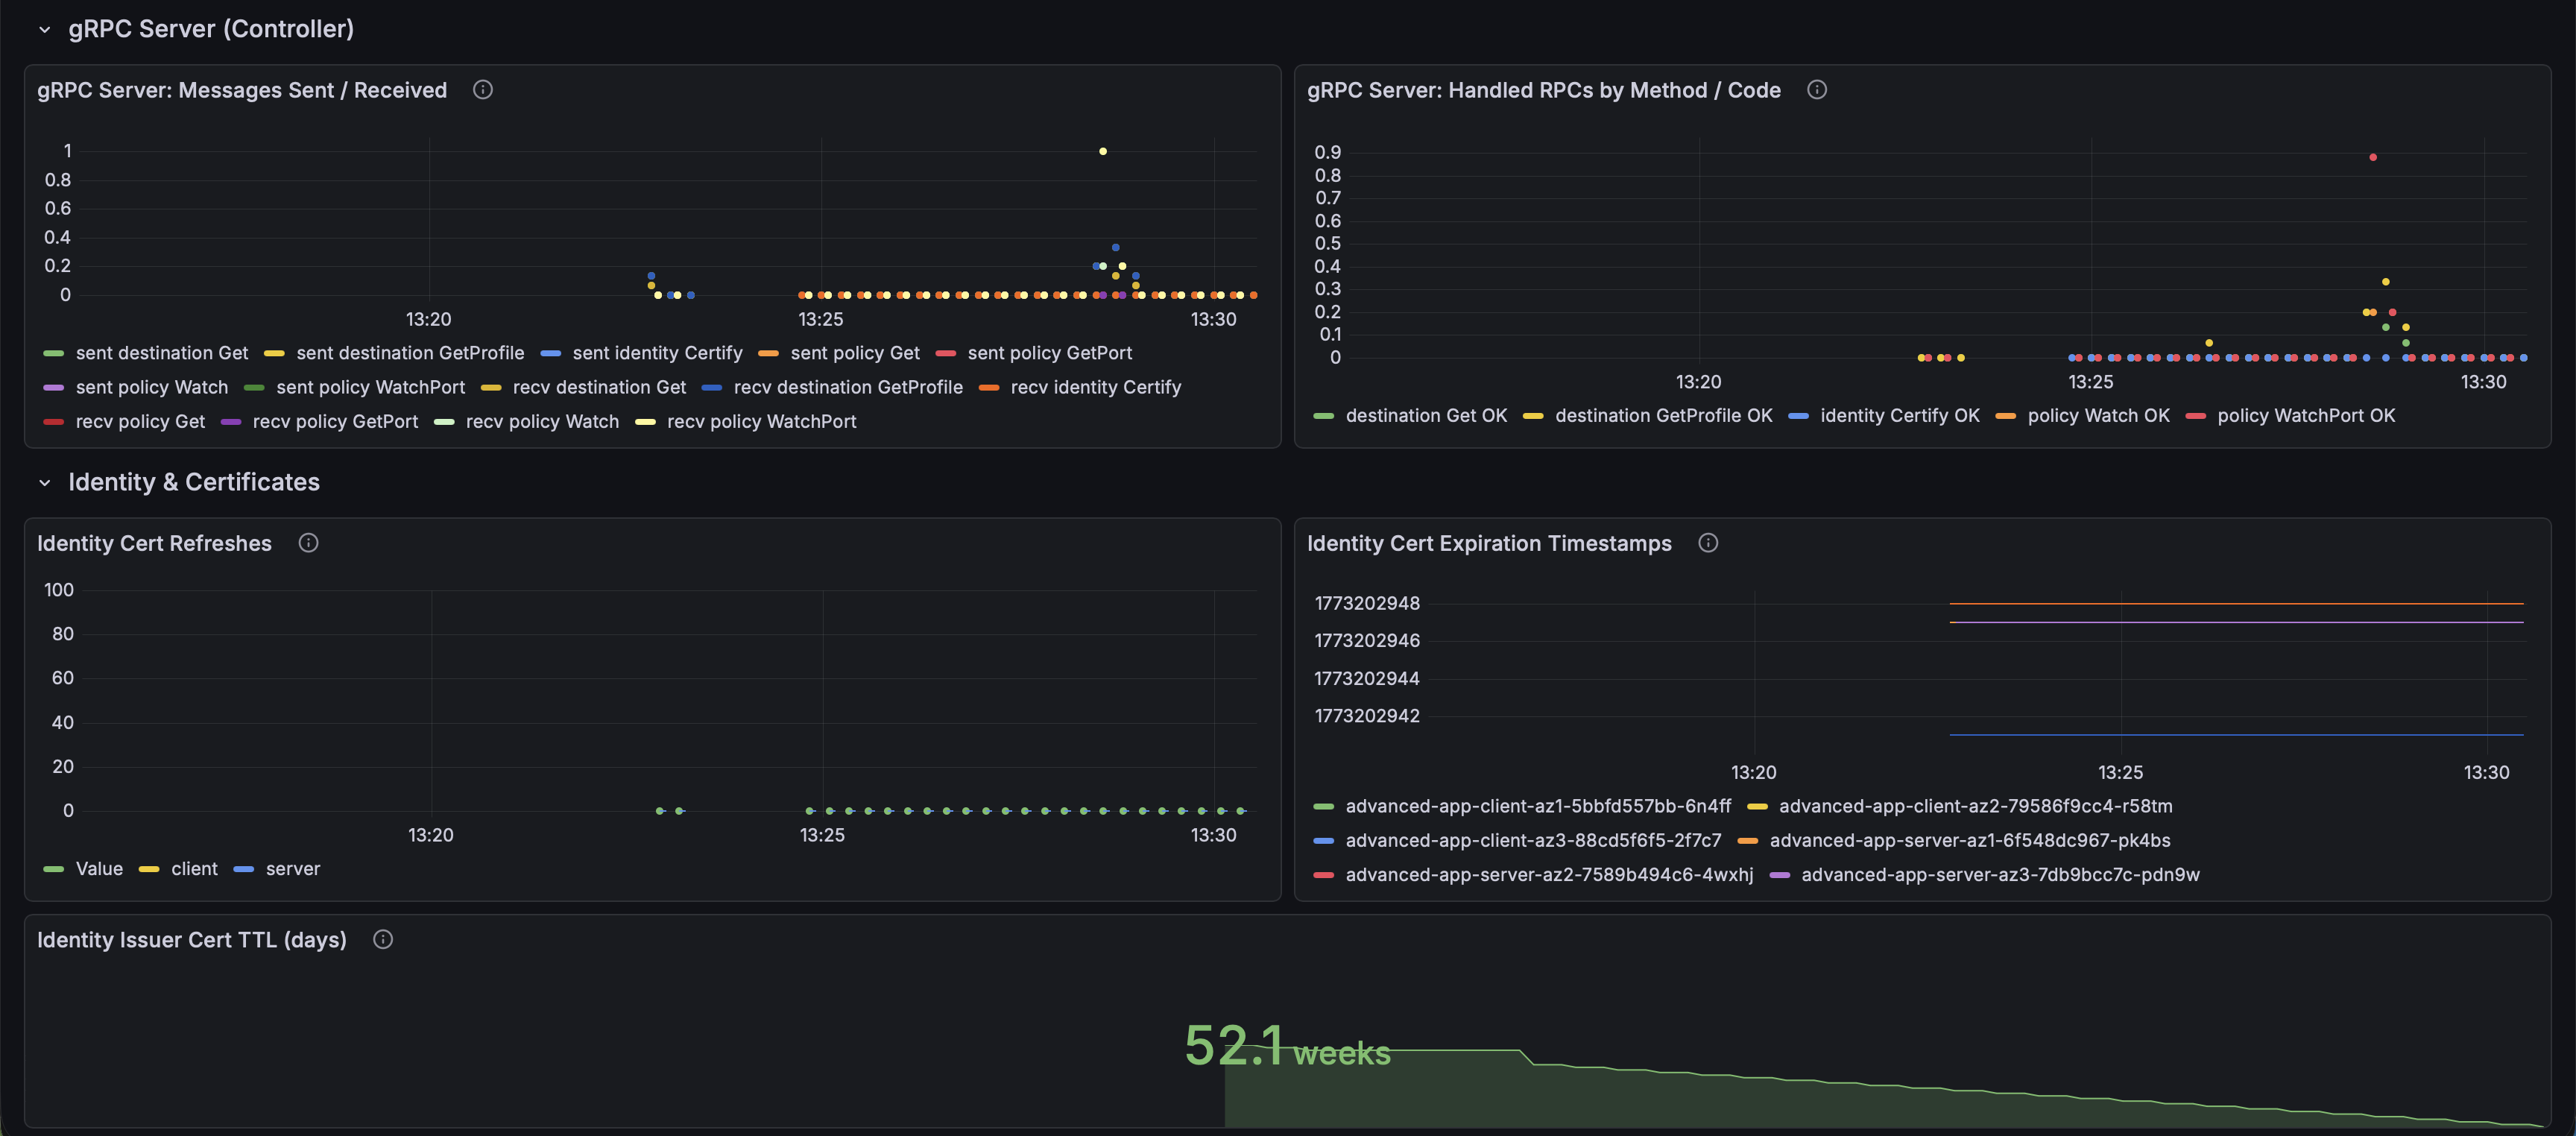
gRPC Server (Controller) — message throughput and handled RPCs by method/code
Identity & Certificates — cert refresh rate, expiry timestamps, issuer TTL
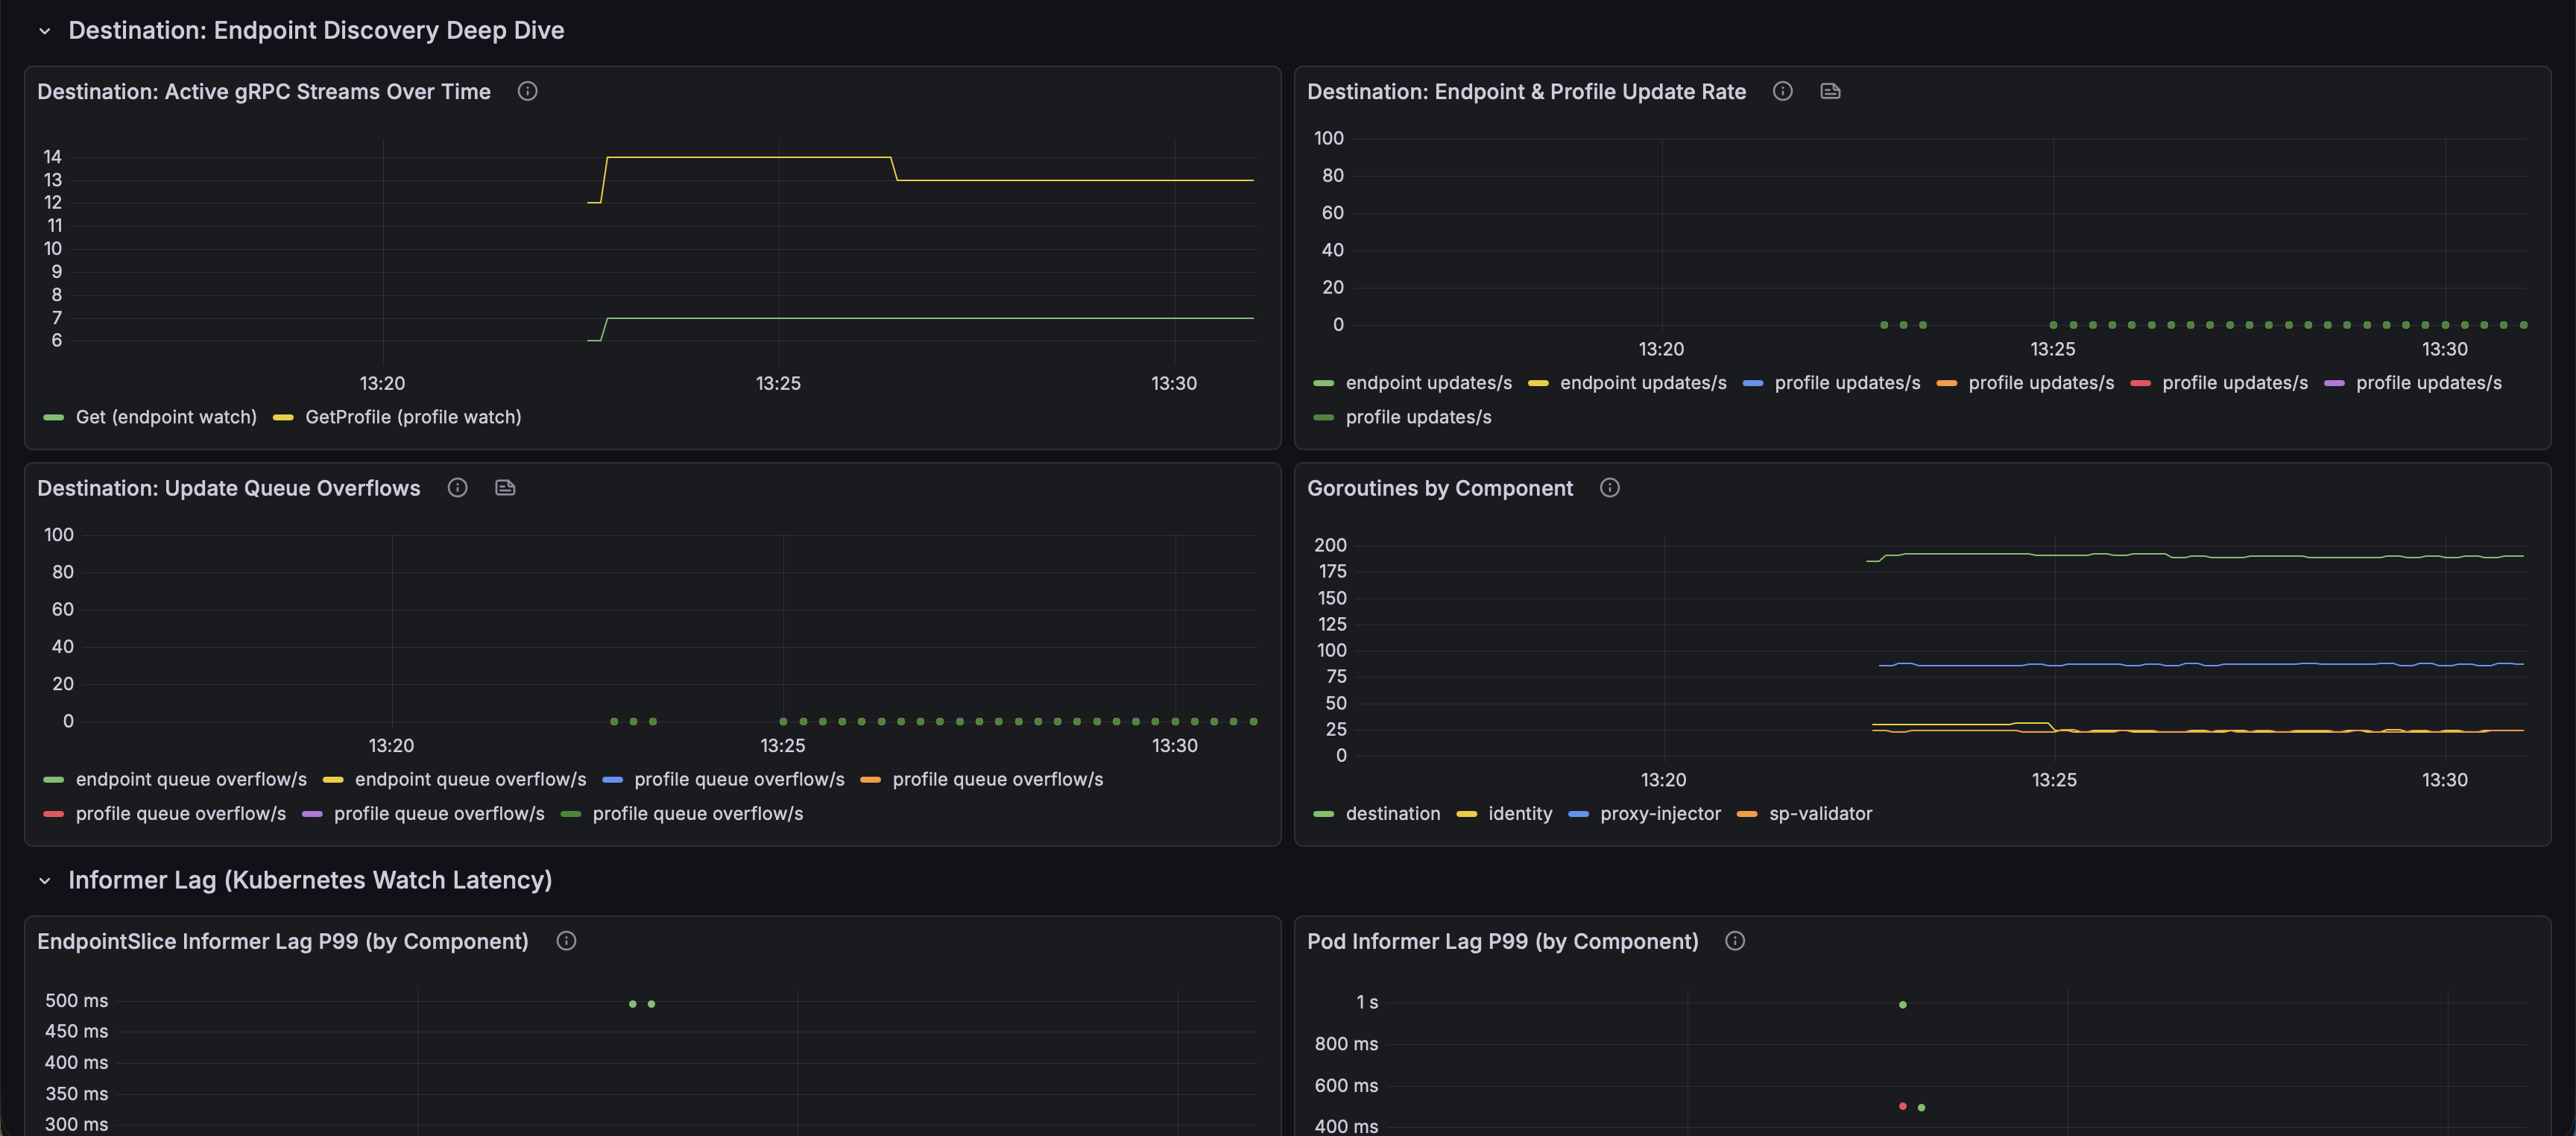
Destination Deep Dive — stream counts over time, update rate, queue overflows, goroutines
Informer Lag — p99 K8s watch latency for EndpointSlice, Pod, Service, ServiceProfile, Server
Identity Deep Dive — Certify RPC rate, active requests, latency
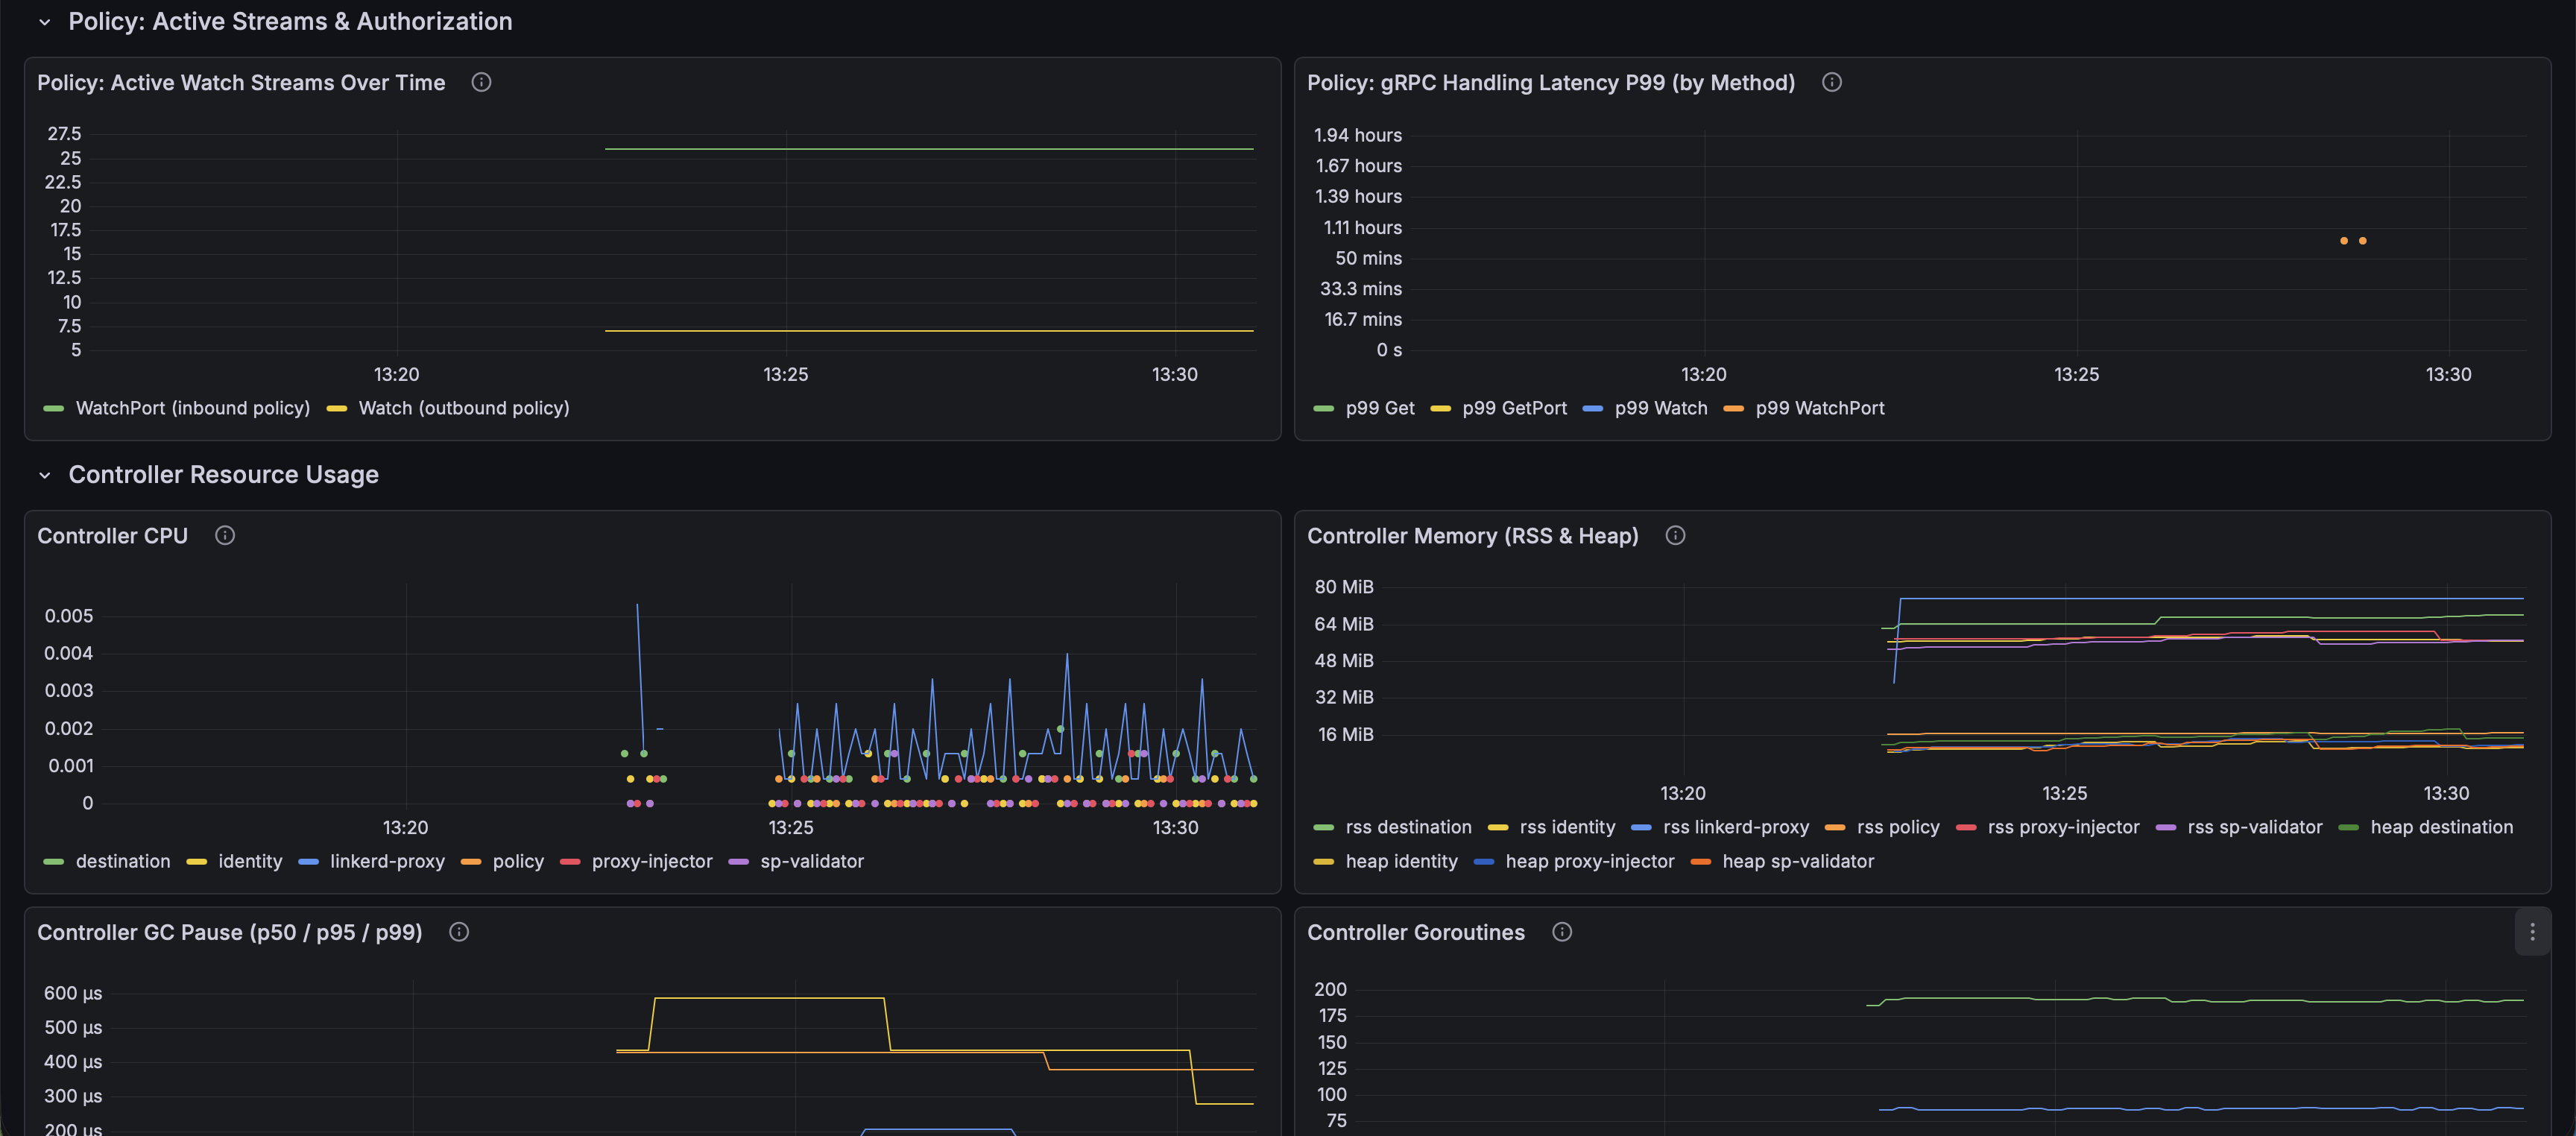
Policy Streams — active WatchPort/Watch streams, gRPC setup latency
Controller Resources — CPU, memory, GC pauses, goroutines, heap objects, alloc rate
Enterprise: External Workloads — registration success/failure, created/reconnected, autoregistration gRPC
Enterprise: Work Queue — depth, add rate, queue/work duration, retries, drops
Enterprise: License Controller — License RPC rate by code, p95 latency
Metrics Sources
linkerd-proxy— meshed sidecarslinkerd-controller— control plane componentskube-state-metrics— restart counts
Note: Linkerd 2.19 renamed control plane admin ports from the shared admin-http to unique per-component names (dest-admin, policy-admin, ident-admin, etc.). If you are running 2.19+, update your Prometheus scrape configs to use the new port names or some panels may not populate. See the 2.19 release notes for details.
Troubleshooting
- 503s / stale routes → Connected Proxies → Update Queue Overflows
- Cert/TLS errors → Identity & Certificates → Issuer Cert TTL
- Slow policy enforcement → Informer Lag → Server Informer Lag P99
- OOMKilled / high memory → Controller Resources → Controller Memory
- External workload not joining → External Workloads → Registration Failure Rate
- Enterprise degraded → License Controller → Handled RPCs
Data source config
Collector config:
Upload an updated version of an exported dashboard.json file from Grafana
| Revision | Description | Created | |
|---|---|---|---|
| Download |