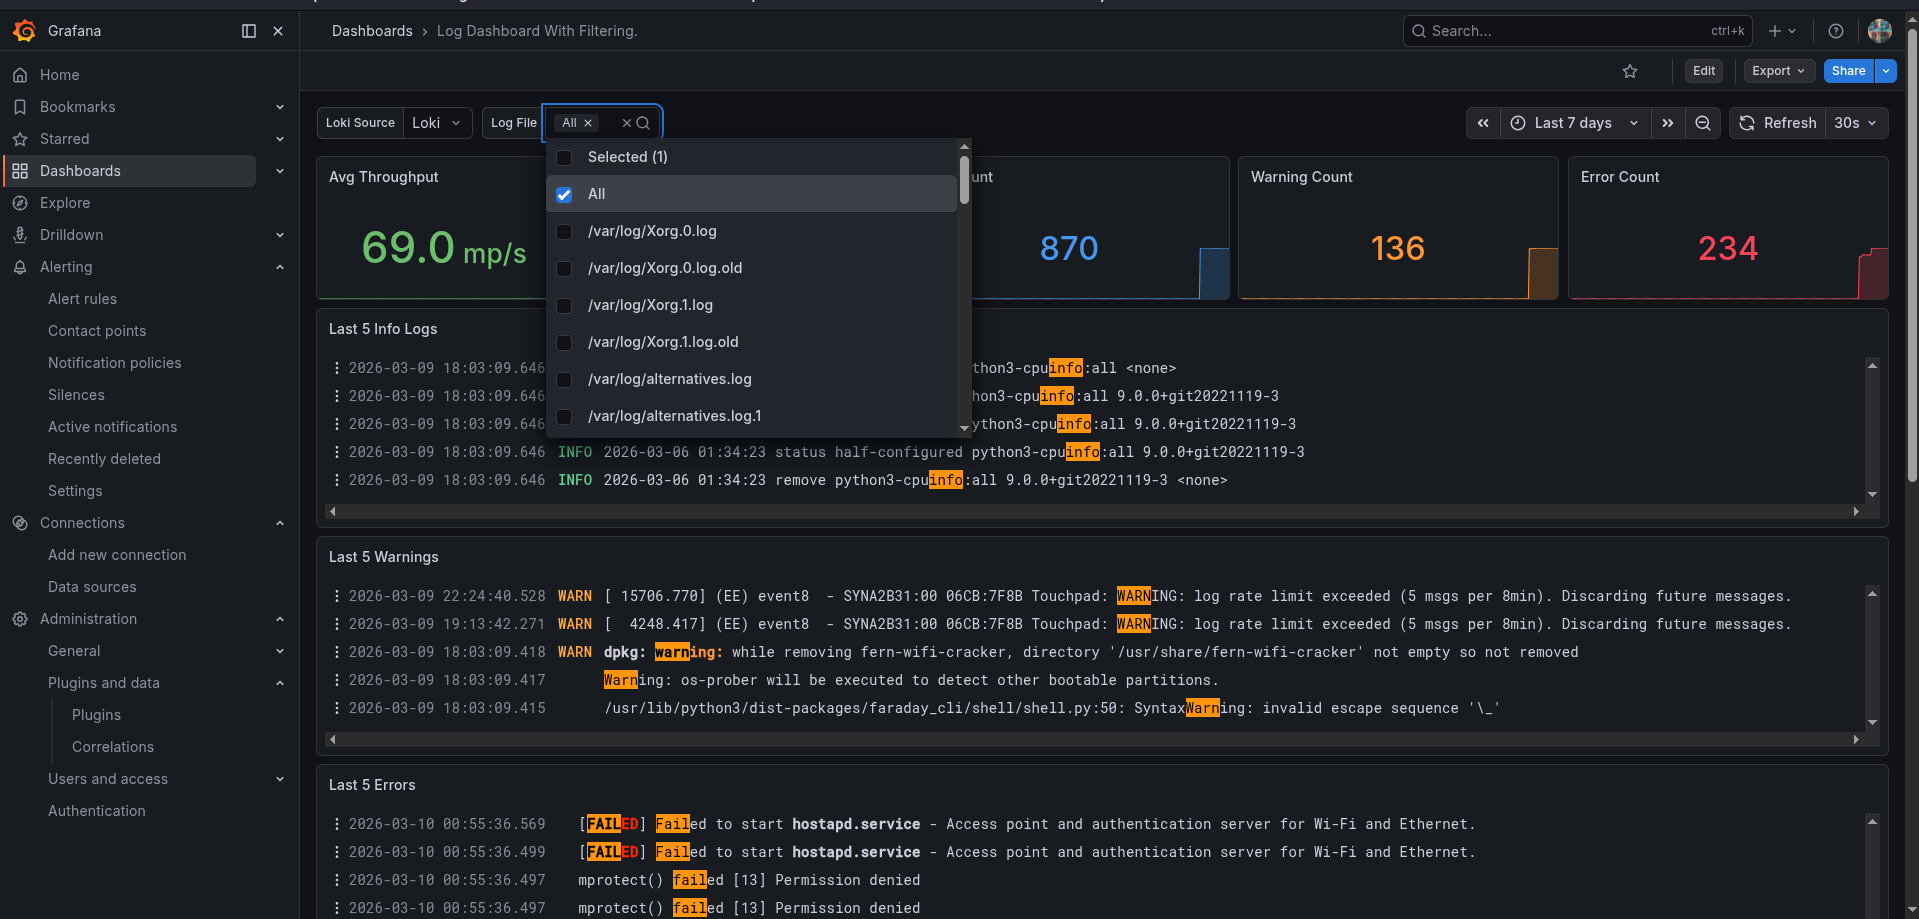
Log Dashboard With Filtering
Optimized for Grafana Loki log filtering. Fully compatible with both legacy Promtail pipelines and modern Grafana Alloy log collectors.
Log Dashboard For Loki
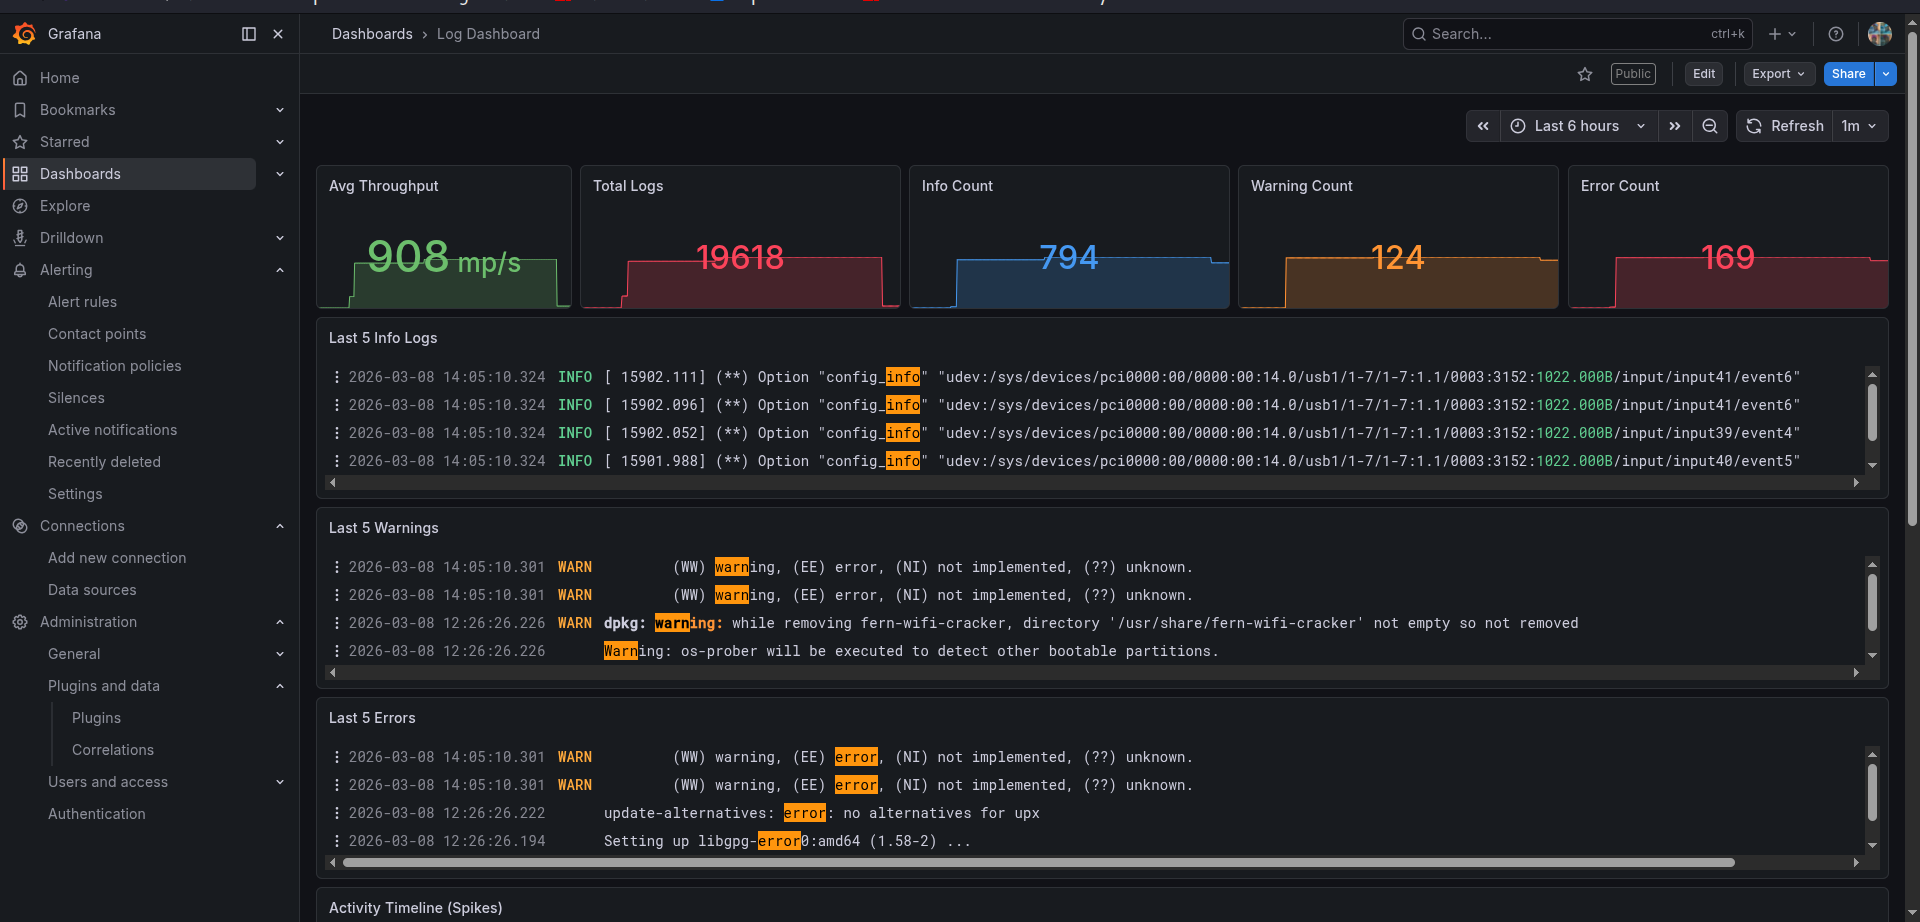
A high-visibility, professional-grade dashboard for monitoring system and application log streams via Grafana Loki. This dashboard provides an at-a-glance health check of your logging pipelines while offering dynamic template variable filtering to switch between various log formats natively.
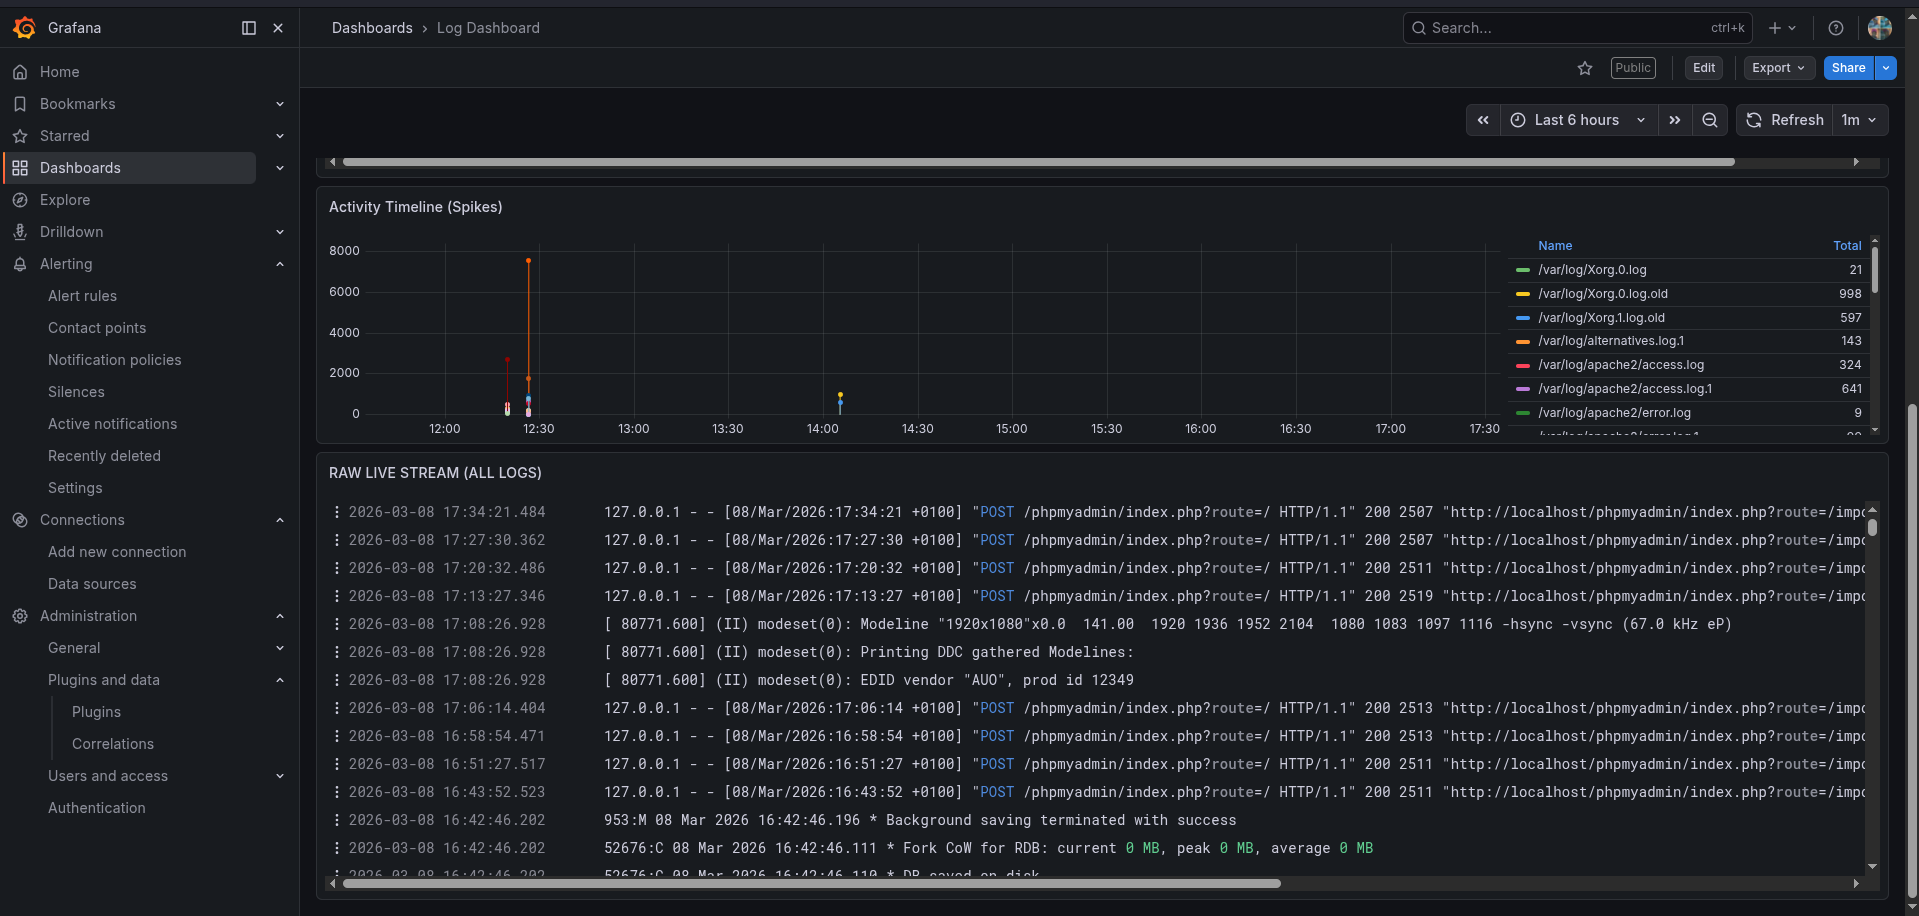
🚀 Key Features Real-time Throughput: Monitor the velocity of incoming logs in lines-per-second. Total Volume Tracking: Keep track of your historical log count for auditing and storage planning. Intelligent Status Counters: Color-coded stat panels for Info (Blue), Warning (Orange), and Critical/Error (Red) states. "Last 5" Snapshots: Dedicated rows that show only the 5 most recent events for each category letting you find problems instantly without searching. Activity by Source: Visual bar chart showing which files (e.g., auth.log, syslog, kern.log) are generating the most data. Full Live Stream: A raw, scrollable log viewer at the bottom for final-stage debugging.
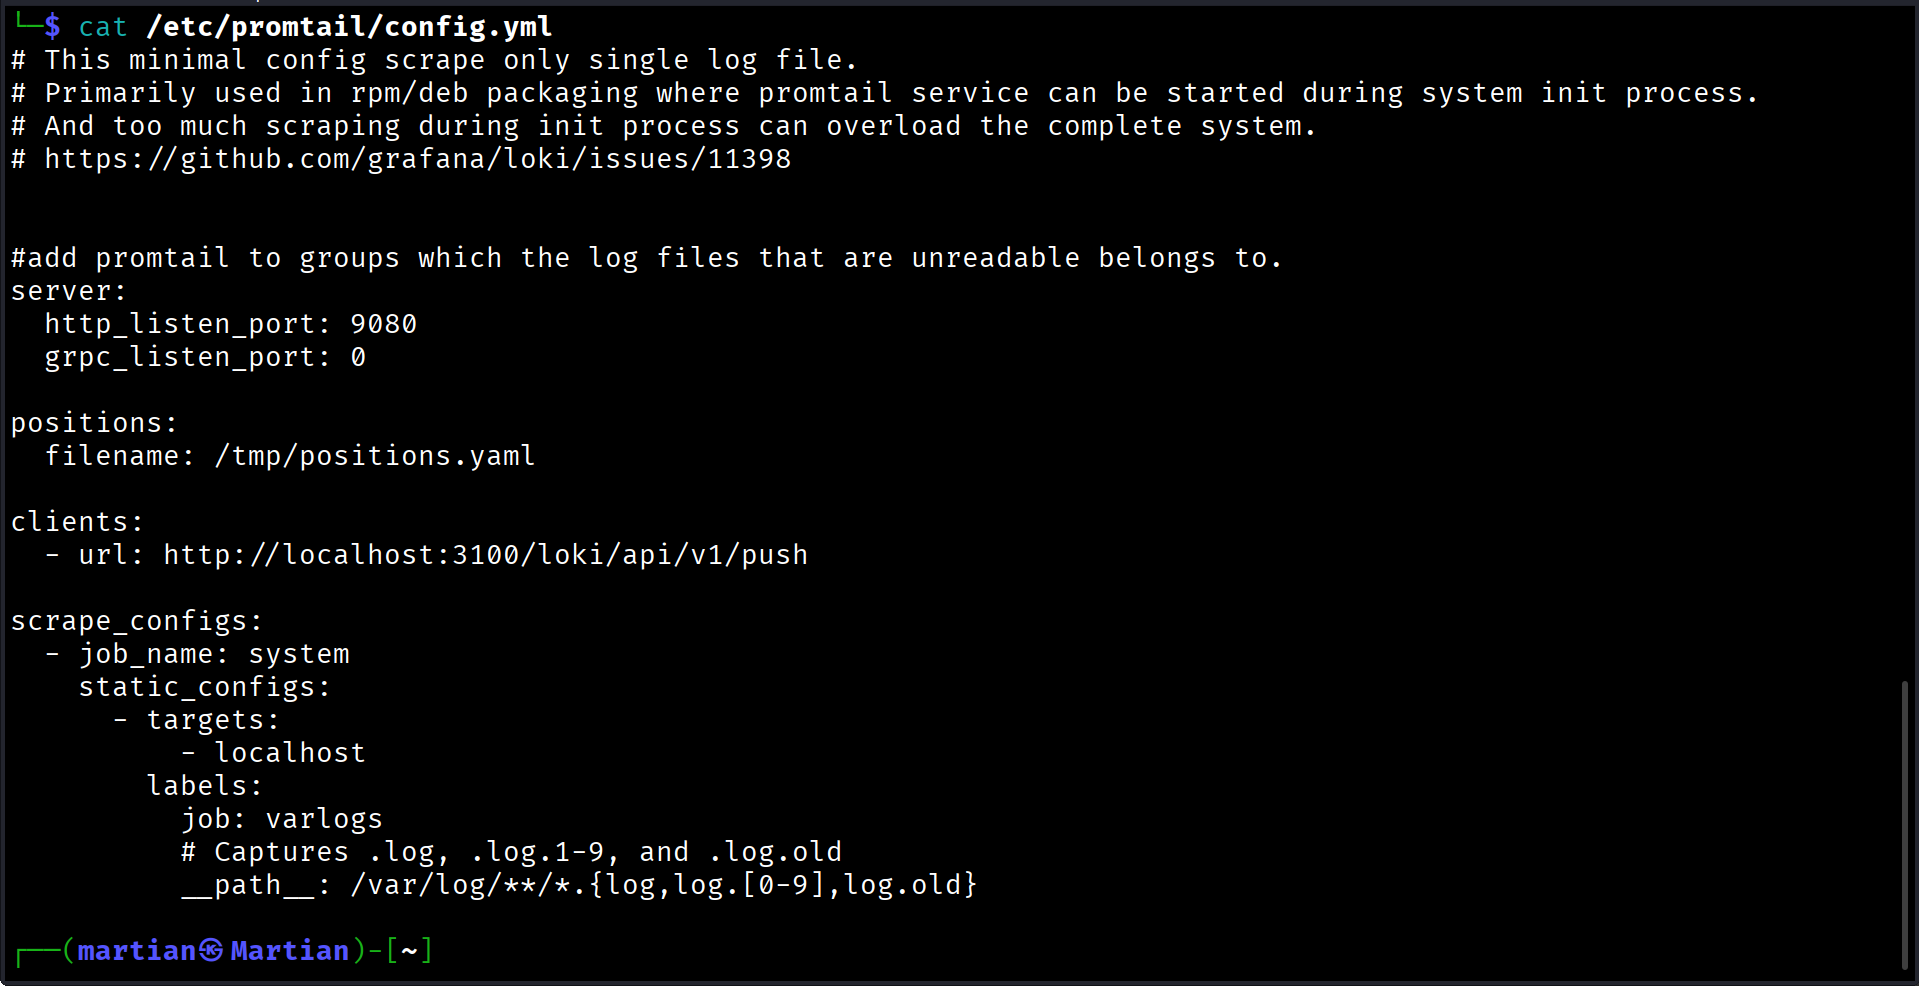
🛠 Prerequisites & Data Collection This dashboard is designed to work with Loki as the data source. For the panels to populate correctly, your Promtail/Alloy configuration must label your logs with job="varlogs".
🔑 Troubleshooting: Permission Denied If you notice some logs not captured in your Promtail/Alloy, it is likely because the promtail/alloy user doesn't have rights to read the files in /var/log.
Fix: Add the promtail/alloy user to the adm or any other groups ( that own the log files) by running:
Example sudo usermod -a -G adm promtail/alloy
UPDATE ON PROMTAIL EOL AND MIGRATION TO ALLOY.
🛑 Promtail End-of-Life Notice: Upgrade to Grafana Alloy As of March 2, 2026, Grafana Labs has officially reached End-of-Life (EOL) for the legacy Promtail log collector.
⚡ How to Migrate in 60 Seconds You do not need to rewrite your log ingestion logic from scratch. Grafana Alloy includes an automated converter command that converts your existing Promtail YAML pipelines straight into modern .alloy components.
Auto-Convert Your Promtail Configuration File alloy convert --source-format=promtail --output=/etc/alloy/config.alloy /etc/promtail/config.yml sudo systemctl stop promtail && sudo systemctl disable promtail sudo systemctl daemon-reload sudo systemctl enable alloy && sudo systemctl start alloy
📊 How to Use Import: Enter the Dashboard ID or upload the JSON file. Select Datasource: Choose your Loki instance when prompted. Filter: Use the time picker at the top right to switch between live monitoring (Last 5 minutes) or historical auditing (Last 7 days).
🏷 Categories & Tags Category: Loki, Promtail, Alloy, Operations, Linux
Data source config
Collector config:
Upload an updated version of an exported dashboard.json file from Grafana
| Revision | Description | Created | |
|---|---|---|---|
| Download |