Technitium DNS
Lightweight Prometheus dashboard for Technitium DNS Server.
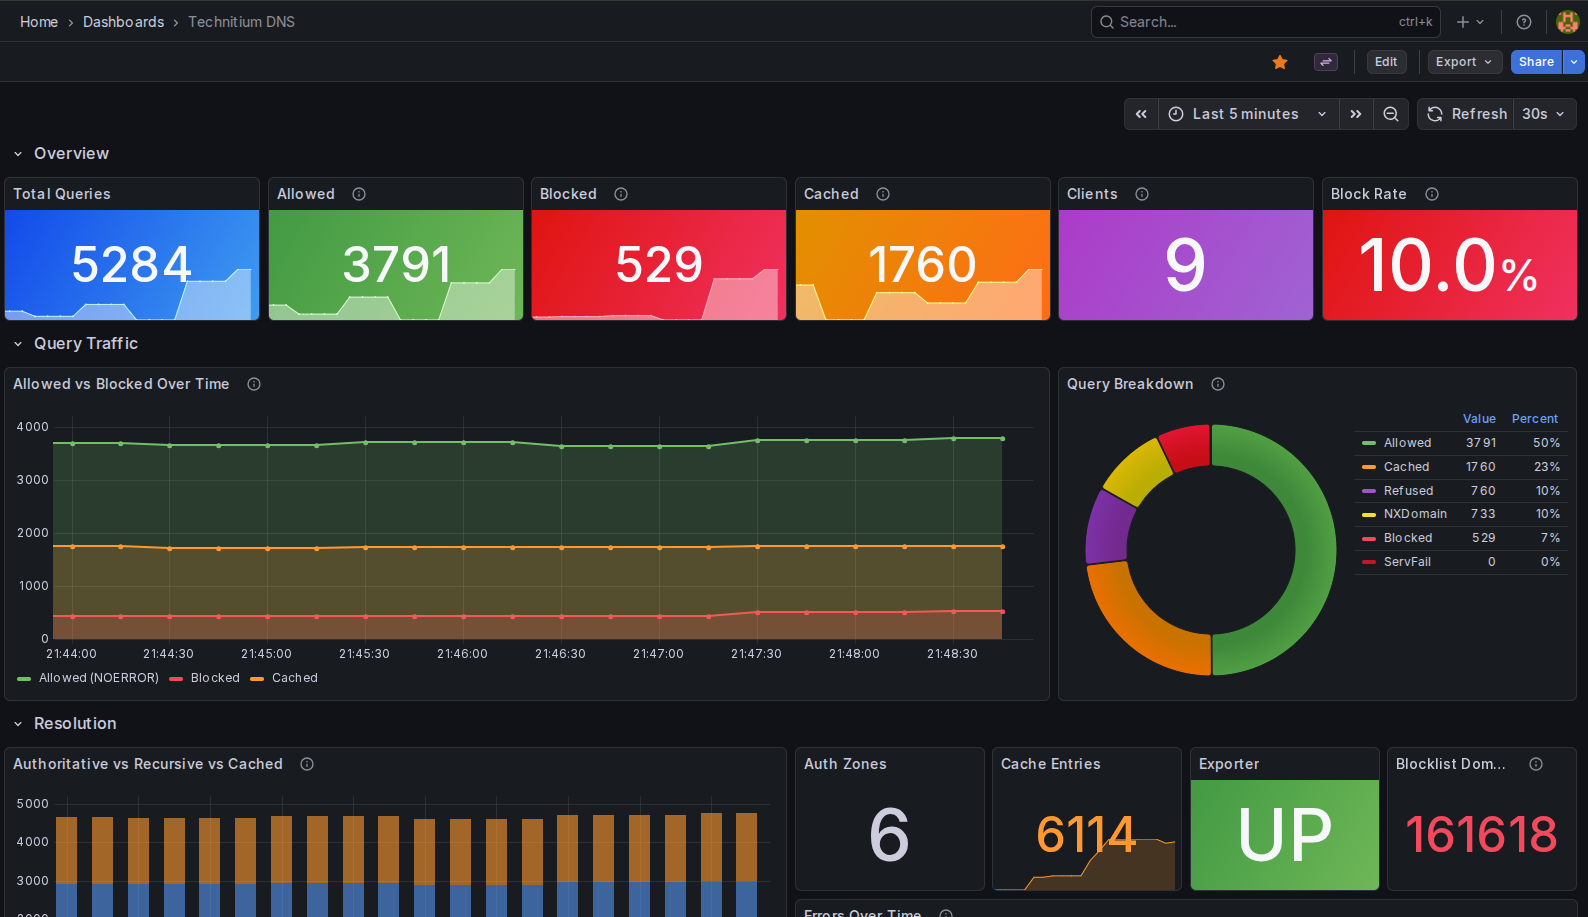
Lightweight Prometheus dashboard for Technitium DNS Server. Displays query stats (allowed/blocked/cached), ad-block rate, record type and protocol breakdown, top clients, top queried and blocked domains. Pair with sonirico/technitium-exporter.
Data source config
Collector type:
Collector plugins:
Collector config:
Revisions
Upload an updated version of an exported dashboard.json file from Grafana
| Revision | Description | Created | |
|---|---|---|---|
| Download |