Espresso
Dashboard for monitoring an Espresso Sequencer node
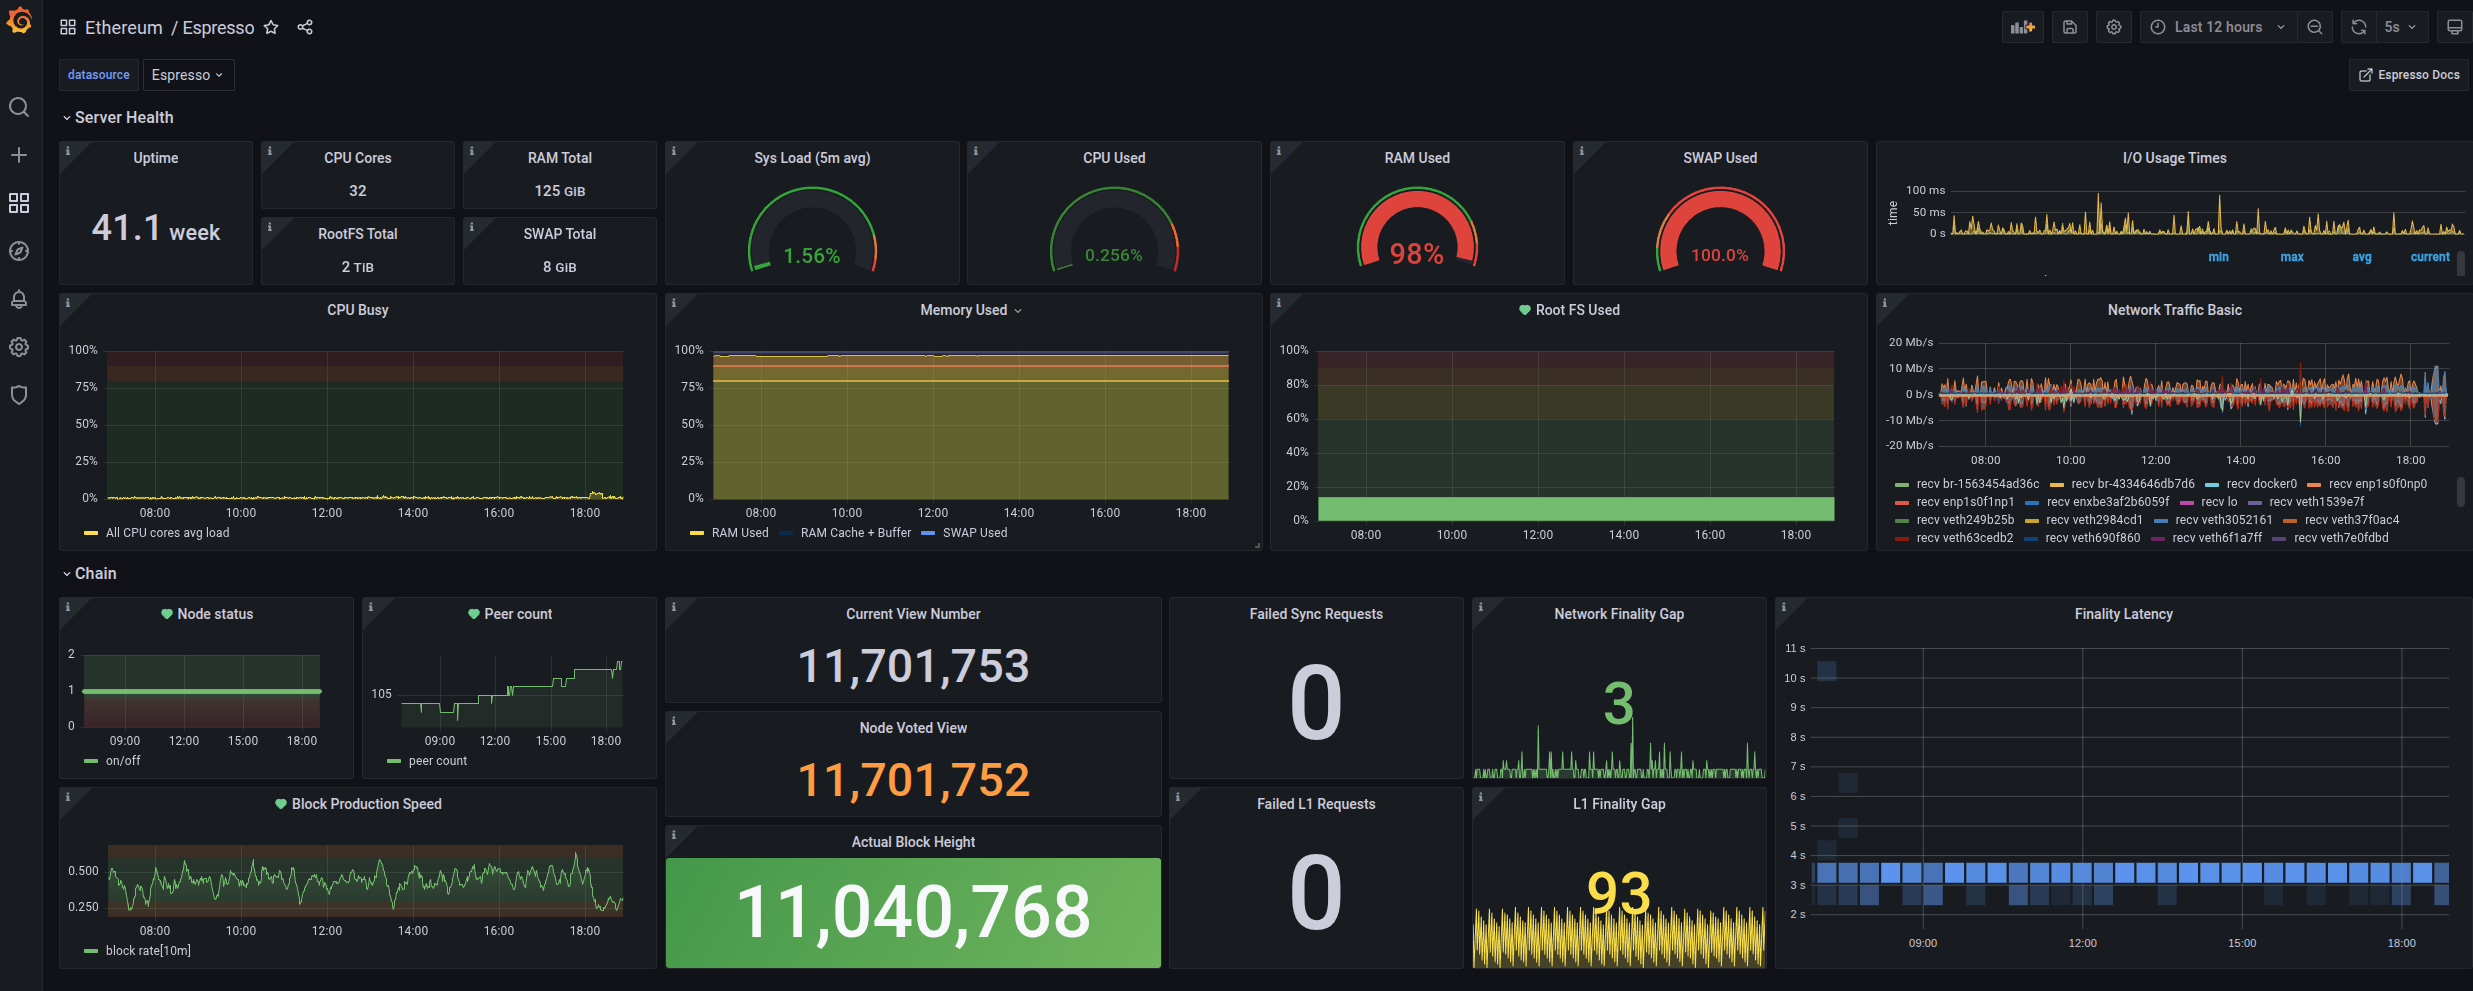
Dashboard uses Prometheus datasource to get the Espresso node metrics and NodeExporter for the HW metrics
example from Prometheus config:
scrape_configs:
- job_name: "prometheus"
scrape_interval: 5s
static_configs:
- targets: ["localhost:9090"]
- job_name: "espresso"
scrape_interval: 5s
metrics_path: '/v1/status/metrics'
static_configs:
- targets: ["localhost:24000"]
- job_name: "node_exporter"
scrape_interval: 5s
static_configs:
- targets: ["localhost:9100"]
Data source config
Collector type:
Collector plugins:
Collector config:
Revisions
Upload an updated version of an exported dashboard.json file from Grafana
| Revision | Description | Created | |
|---|---|---|---|
| Download |