Zero-cache
Zero-cache (Rocicorp Zero) (non-official dashboard) metrics: view-syncer, replication, mutations, CVR, hydration, IVM. Dashboard was created for version Zero 0.24, so there may be new metrics now. Metrics list: zero_sync_*, zero_replication_*, zero_mutation_*.
Zero (Rocicorp Zero-cache) Dashboard
This dashboard visualizes Zero-cache metrics from Rocicorp Zero: view-syncer, replication manager, CVR (Client View Replica), hydration, and IVM (Incremental View Maintenance).
What the Dashboard Shows
| Section | Description |
|---|---|
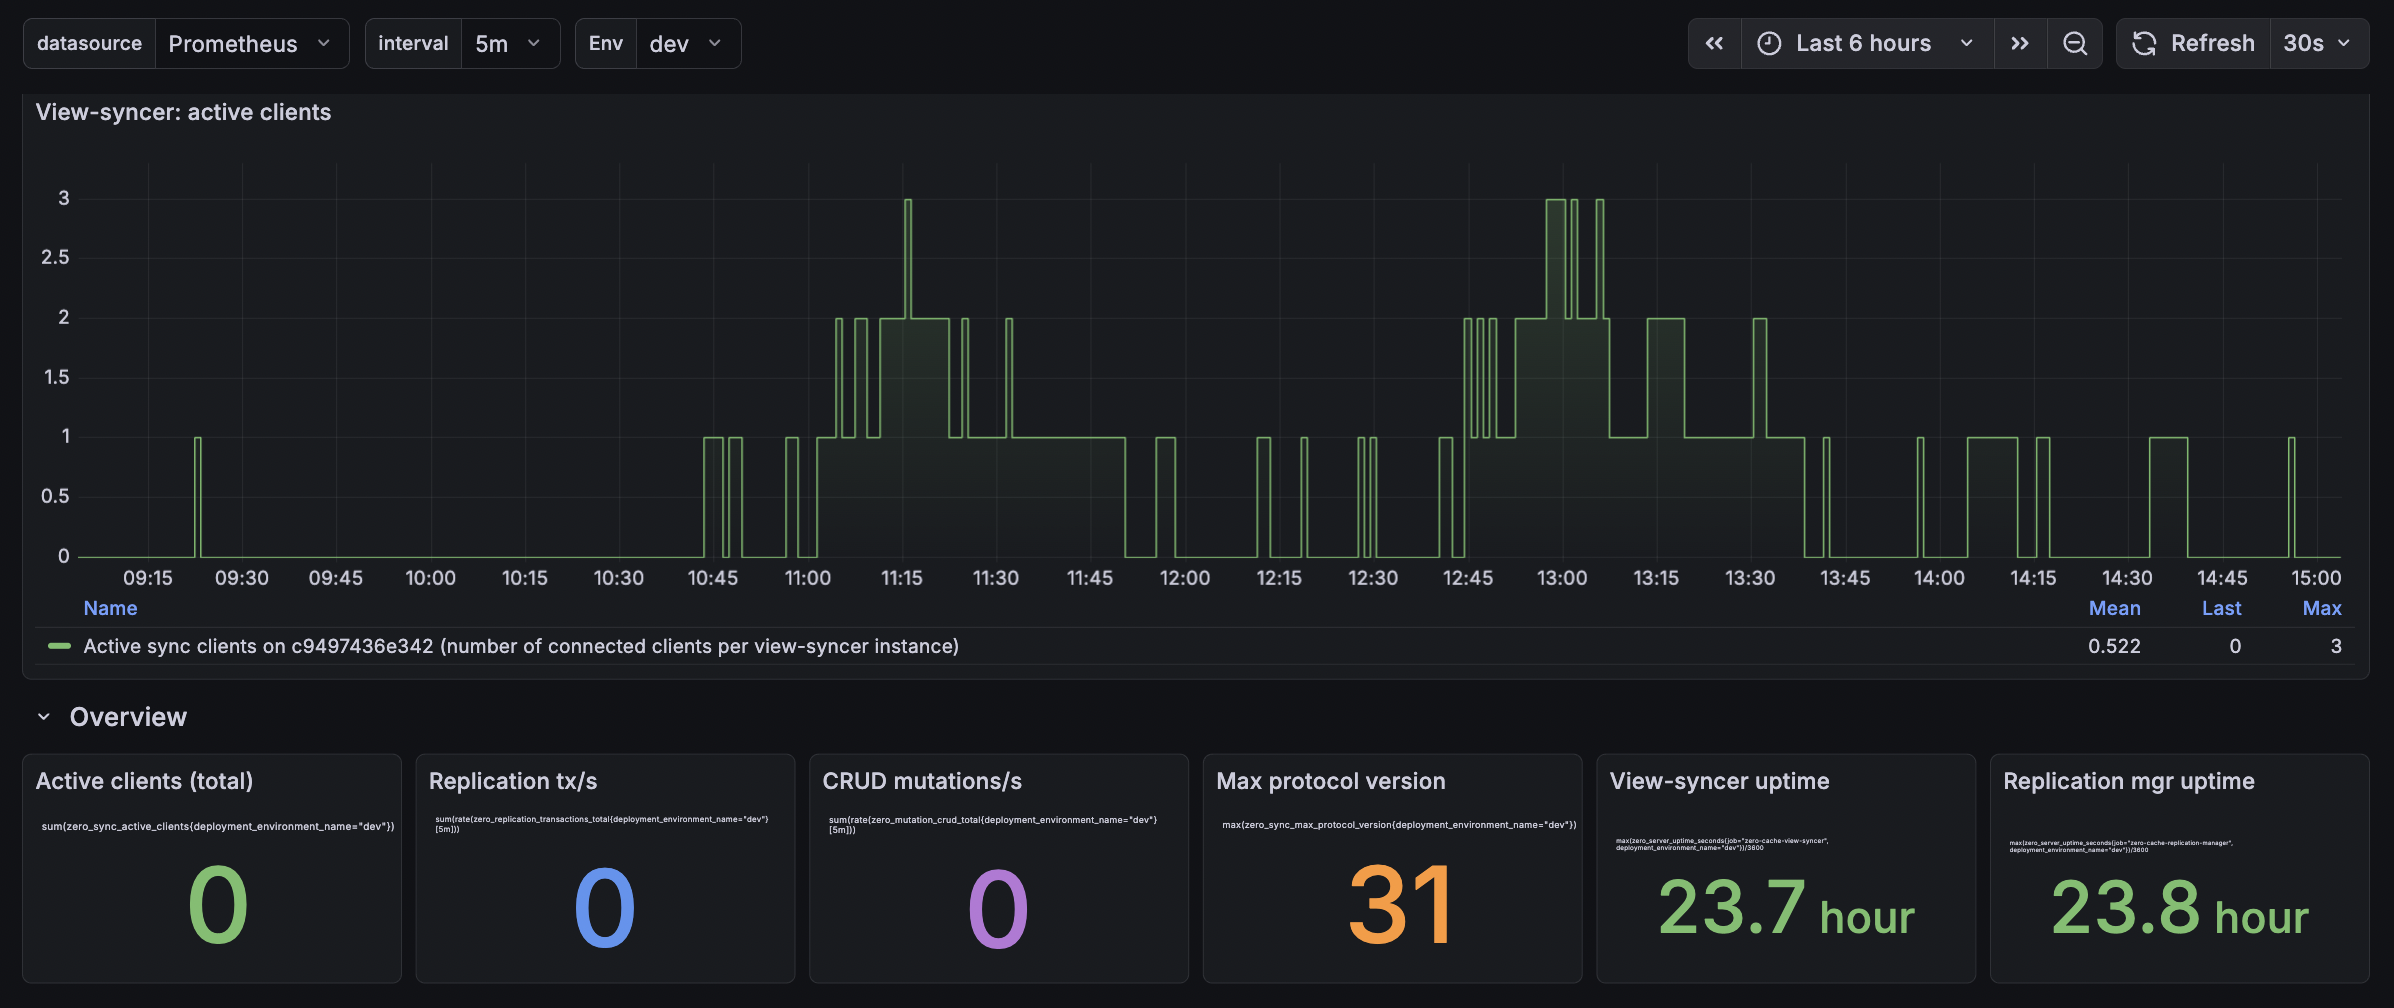
| Active clients | Connected sync clients per view-syncer instance and total across the fleet. |
| Overview | Key stats: total active clients, replication tx/s, CRUD mutations/s, max protocol version, view-syncer and replication-manager uptimes. |
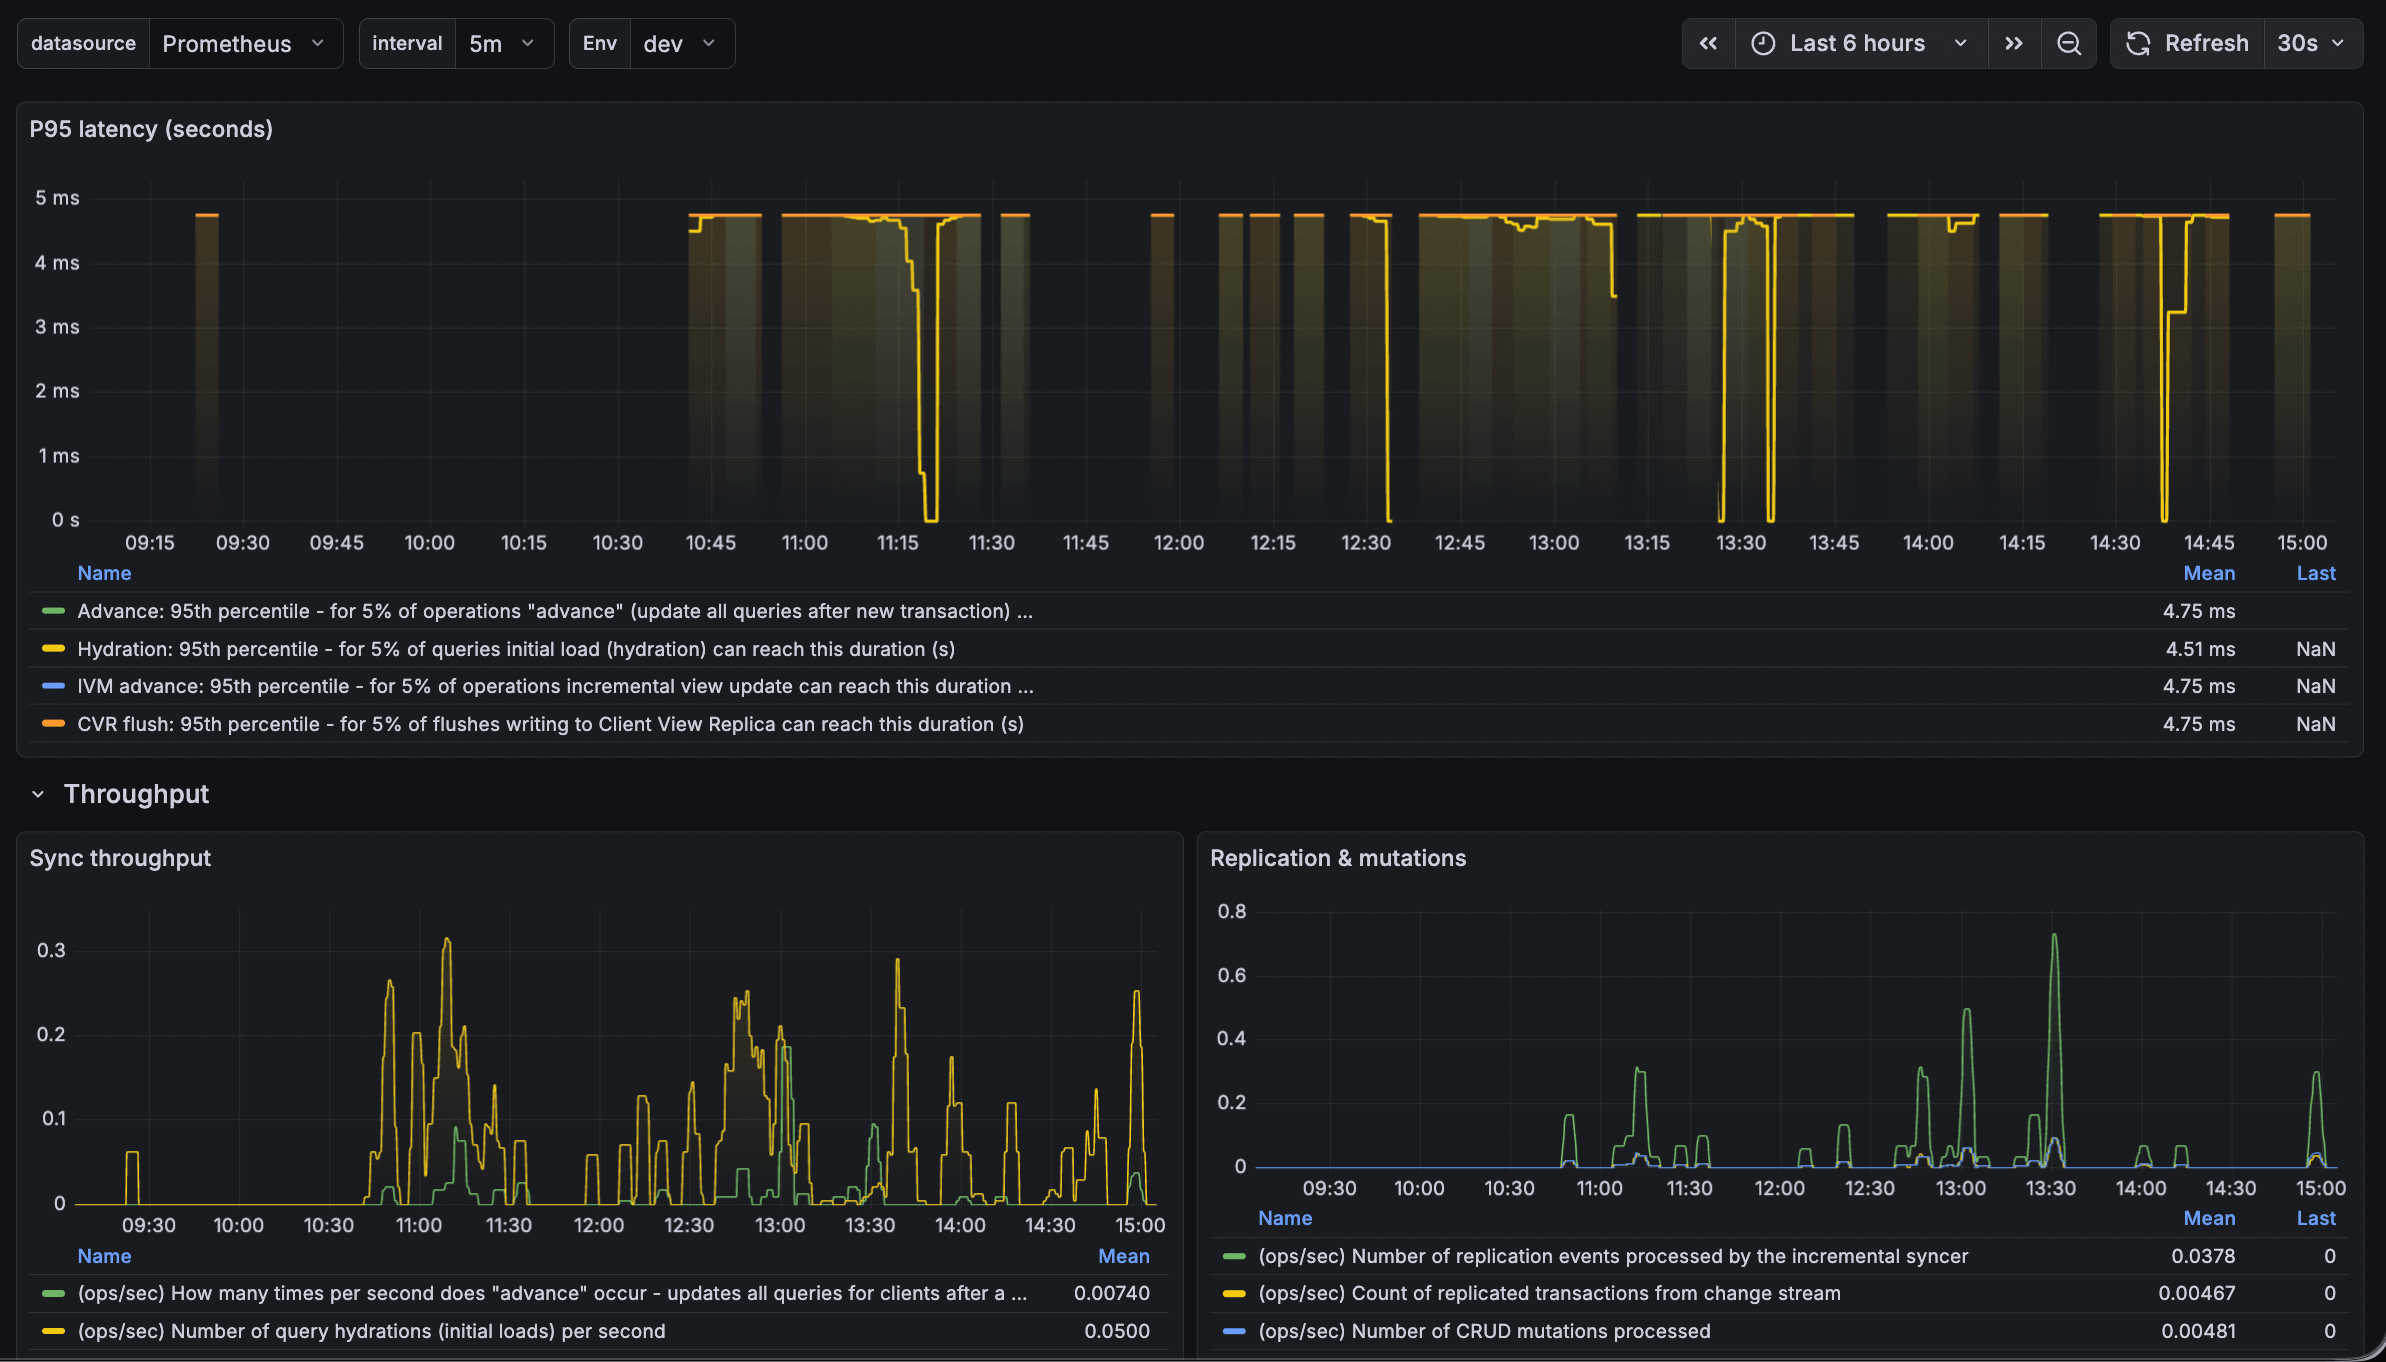
| P95 latency | 95th percentile latency for advance, hydration, IVM advance, and CVR flush operations. |
| Throughput | Advance ops/s, hydration ops/s, replication events, transactions, and mutations. |
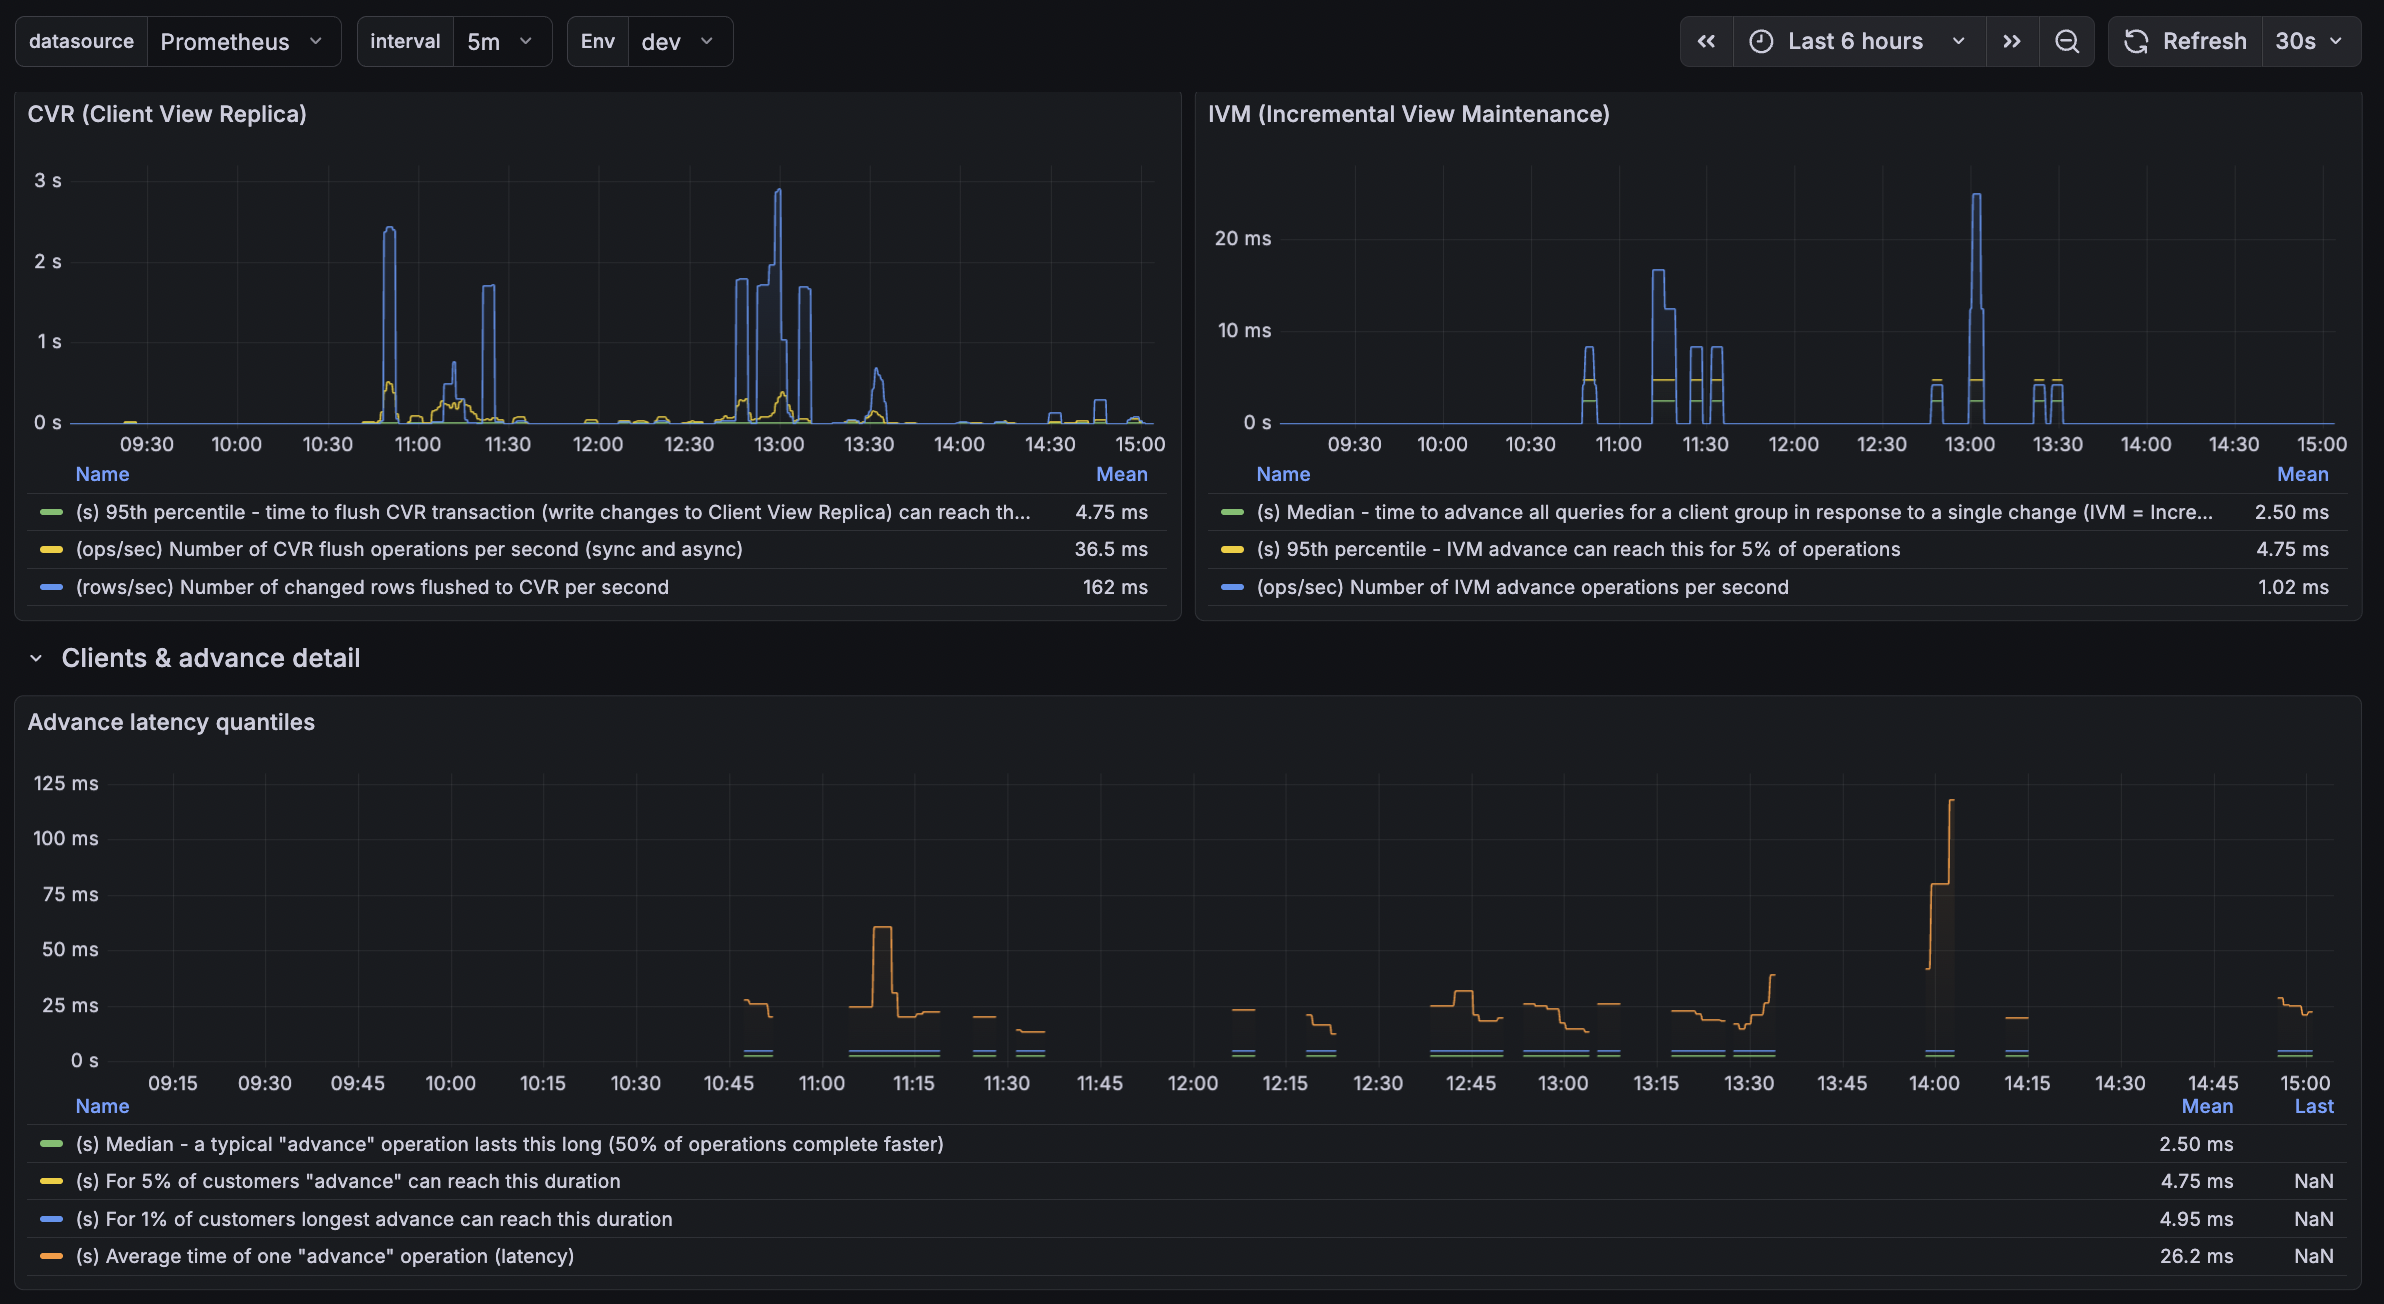
| Advance latency quantiles | P50, P95, P99, and average for the "advance" operation. |
| CVR & IVM | Client View Replica flush latency and throughput; IVM advance latency and throughput. |
| Hydration latency | P50, P95, P99, and average for query hydration (initial load). |
Required Prometheus Metrics
The dashboard expects these metric families. All must be exposed to Prometheus (or compatible backends such as VictoriaMetrics, Mimir).
View-syncer (job="zero-cache-view-syncer")
zero_sync_active_clients— connected clients per instancezero_sync_max_protocol_version— max protocol versionzero_sync_advance_time_seconds_bucket/_sum/_count— advance operation duration (histogram)zero_sync_hydration_total— hydration operation countzero_sync_hydration_time_seconds_bucket/_sum/_count— hydration durationzero_sync_cvr_flush_time_seconds_bucket/_count— CVR flush durationzero_sync_cvr_rows_flushed_total— rows flushed to CVRzero_sync_ivm_advance_time_seconds_bucket/_count— IVM advance durationzero_server_uptime_seconds— process uptime
Replication manager (job="zero-cache-replication-manager")
zero_replication_transactions_totalzero_replication_events_totalzero_mutation_crud_totalzero_server_uptime_seconds
Required Labels
deployment_environment_name— environment (e.g.dev,prod). Used for the Env variable and filtering.
How to Collect Metrics
Zero natively exports metrics via OpenTelemetry (OTLP). Point the Zero containers at an OTLP receiver; the receiver then exports to Prometheus or a Prometheus-compatible store.
Grafana Alloy as OTLP receiver
Configure Alloy to receive OTLP and remote-write to Prometheus/Mimir:
otelcol.receiver.otlp "default" {
  http { endpoint = "0.0.0.0:14318" }
  output {
    metrics = [otelcol.exporter.prometheus.default.input]
  }
}
otelcol.exporter.prometheus "default" {
forward_to = [prometheus.remote_write.default.receiver]
resource_to_telemetry_conversion = true
}
Set environment variables on the Zero containers:
OTEL_EXPORTER_OTLP_ENDPOINT=http://your-alloy-host:14318
OTEL_RESOURCE_ATTRIBUTES=service.name=zero-cache-view-syncer,deployment.environment.name=dev
(Use zero-cache-replication-manager for the replication-manager service.)
Alloy will convert OTLP to Prometheus format; ensure deployment.environment.name is mapped to deployment_environment_name in the final metrics (e.g. via relabeling).
Dashboard Variables
- Env —
deployment_environment_name(fromlabel_values(zero_server_uptime_seconds, deployment_environment_name)). - interval — aggregation window for rate queries (1m, 5m, 15m).
Histogram Note
The Zero OTEL exporter uses histogram bucket boundaries in milliseconds (e.g. 10, 100, 1000 ms). The dashboard divides quantiles by 1000 to convert to seconds. If your metrics use different units, adjust the queries accordingly.
Data source config
Collector config:
Upload an updated version of an exported dashboard.json file from Grafana
| Revision | Description | Created | |
|---|---|---|---|
| Download |
Varnish Cache
Easily monitor Varnish Cache, an open source web application accelerator, with Grafana Cloud's out-of-the-box monitoring solution.
Learn more